Dashboard management
The Dashboard management section allows you to do the following:
Configure and customize your Wazuh dashboard experience.
View generated reports.
Access application logs.
Dashboards Management
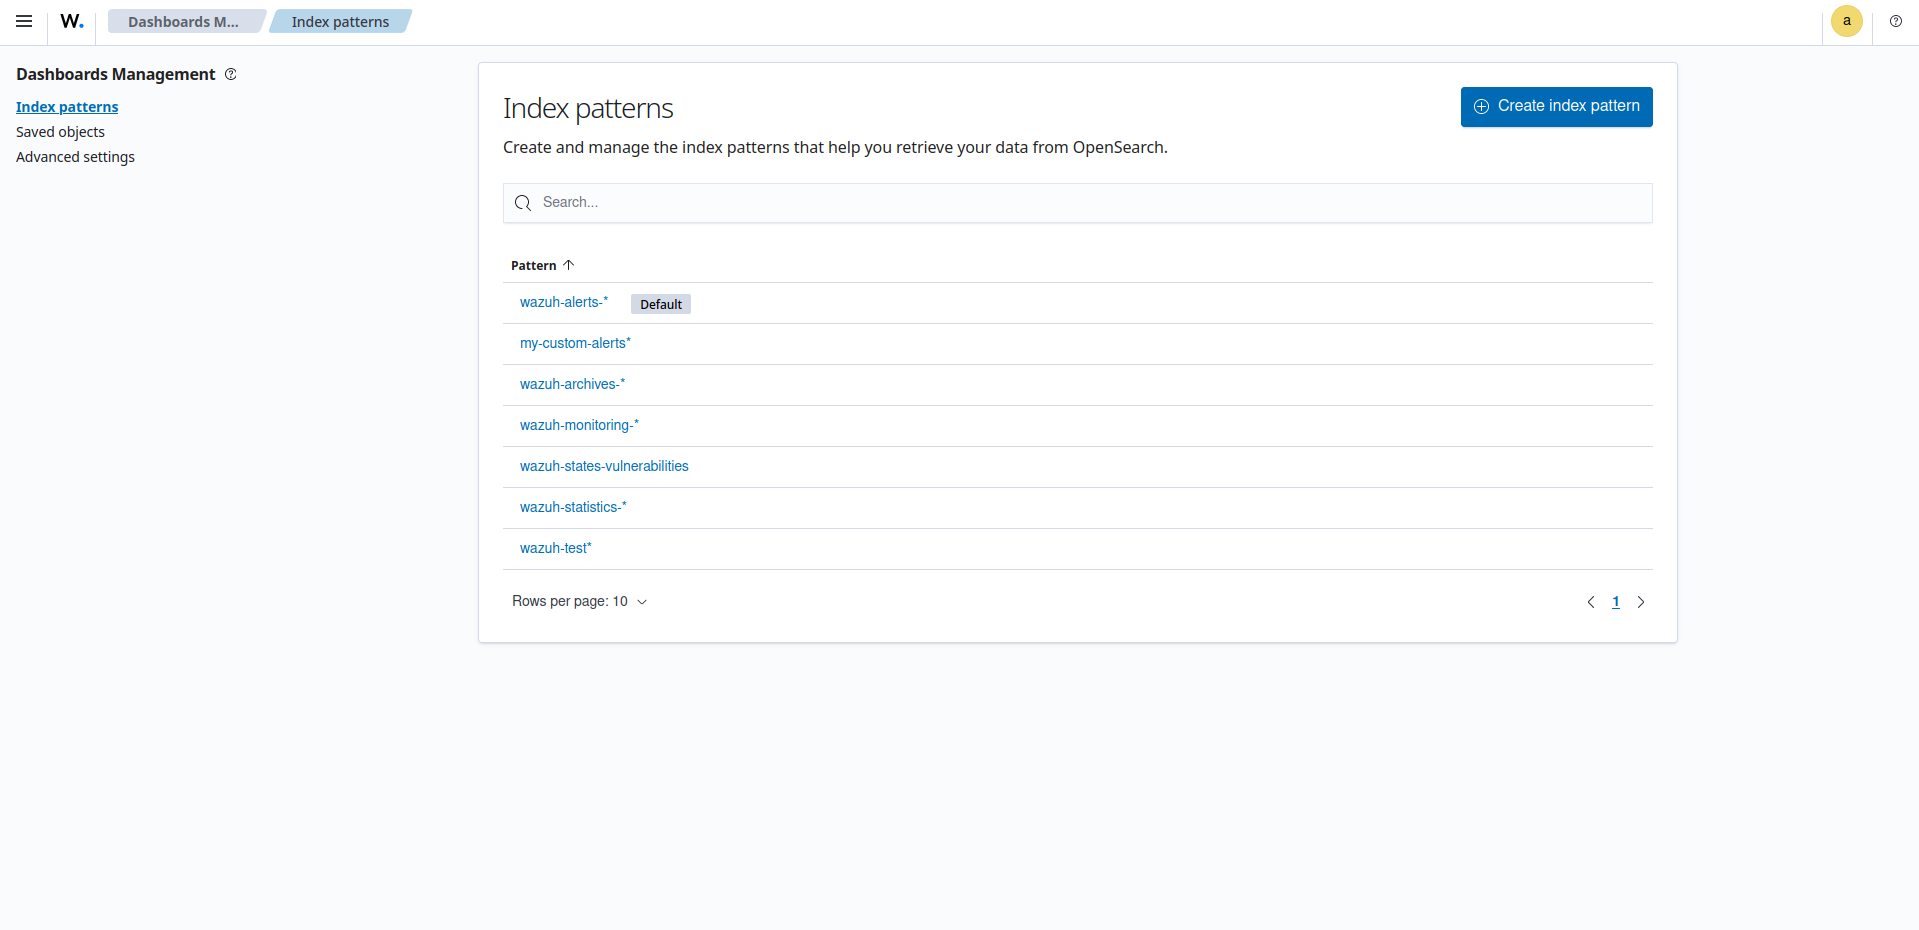
Index patterns
In this section, you can list, configure, and create new index patterns. Index patterns are templates defining data organization for efficient retrieval and analysis.
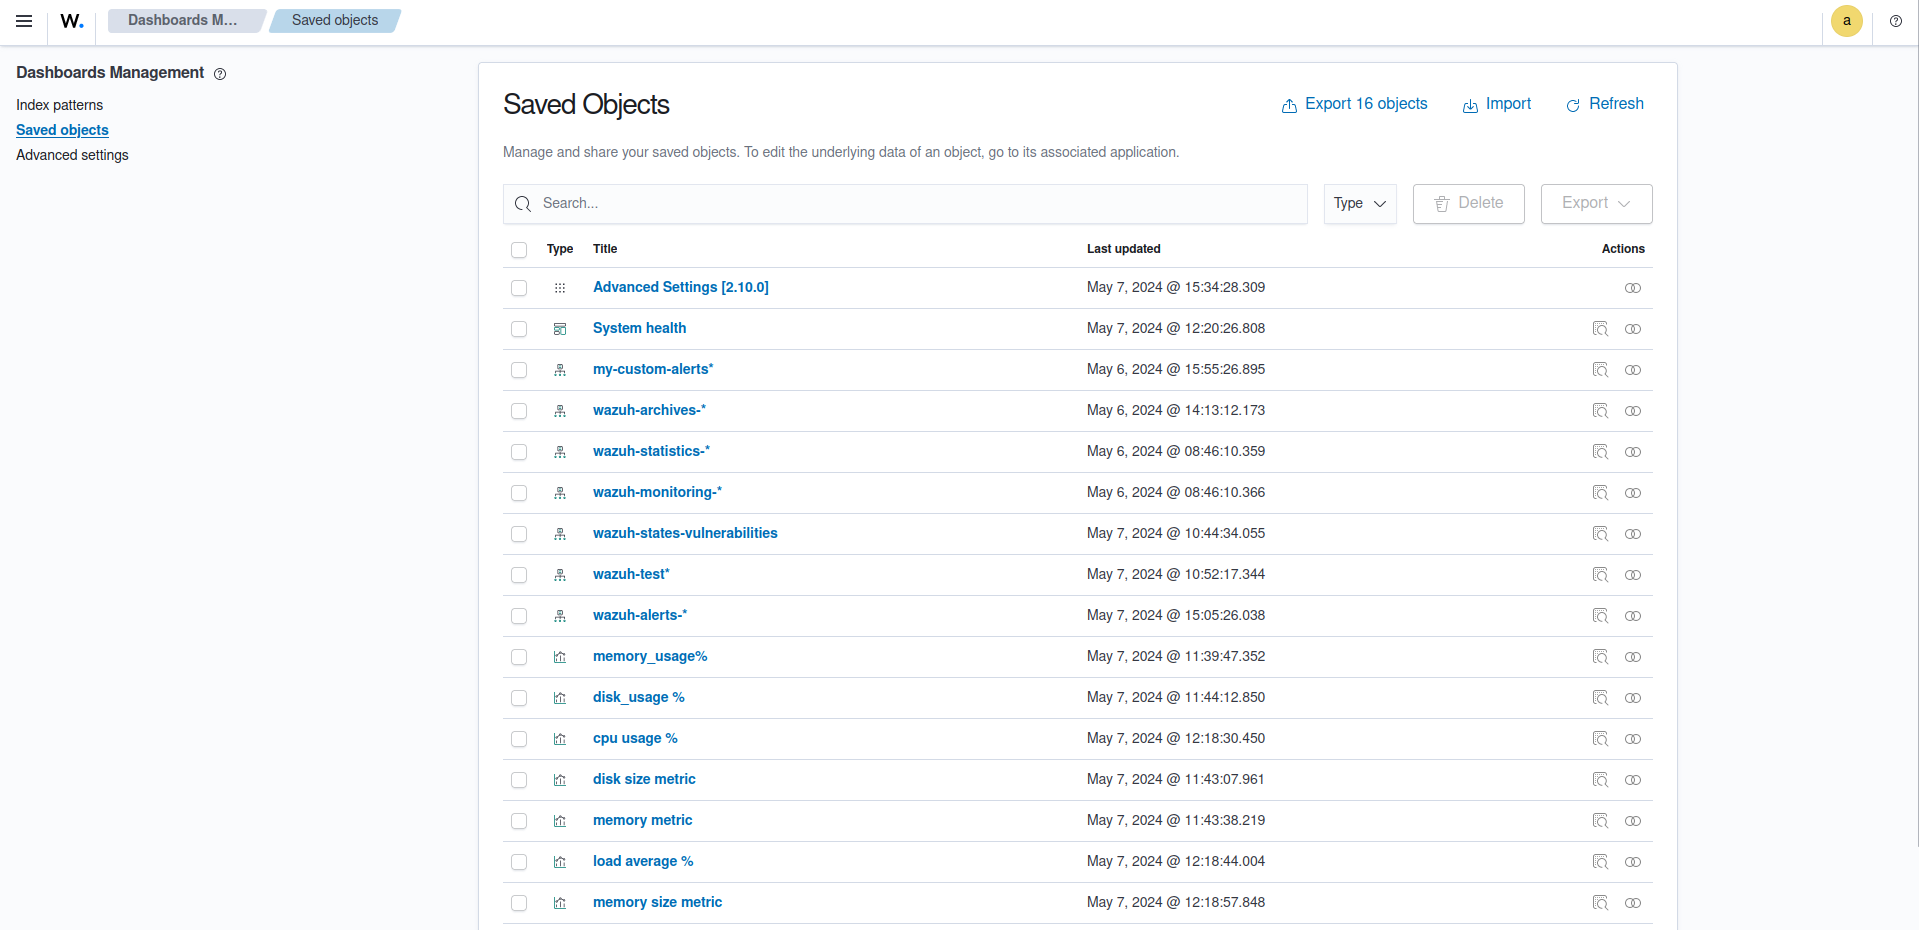
Saved objects
Saved objects of the application include:
Index patterns
Application settings
Custom visualizations and dashboards
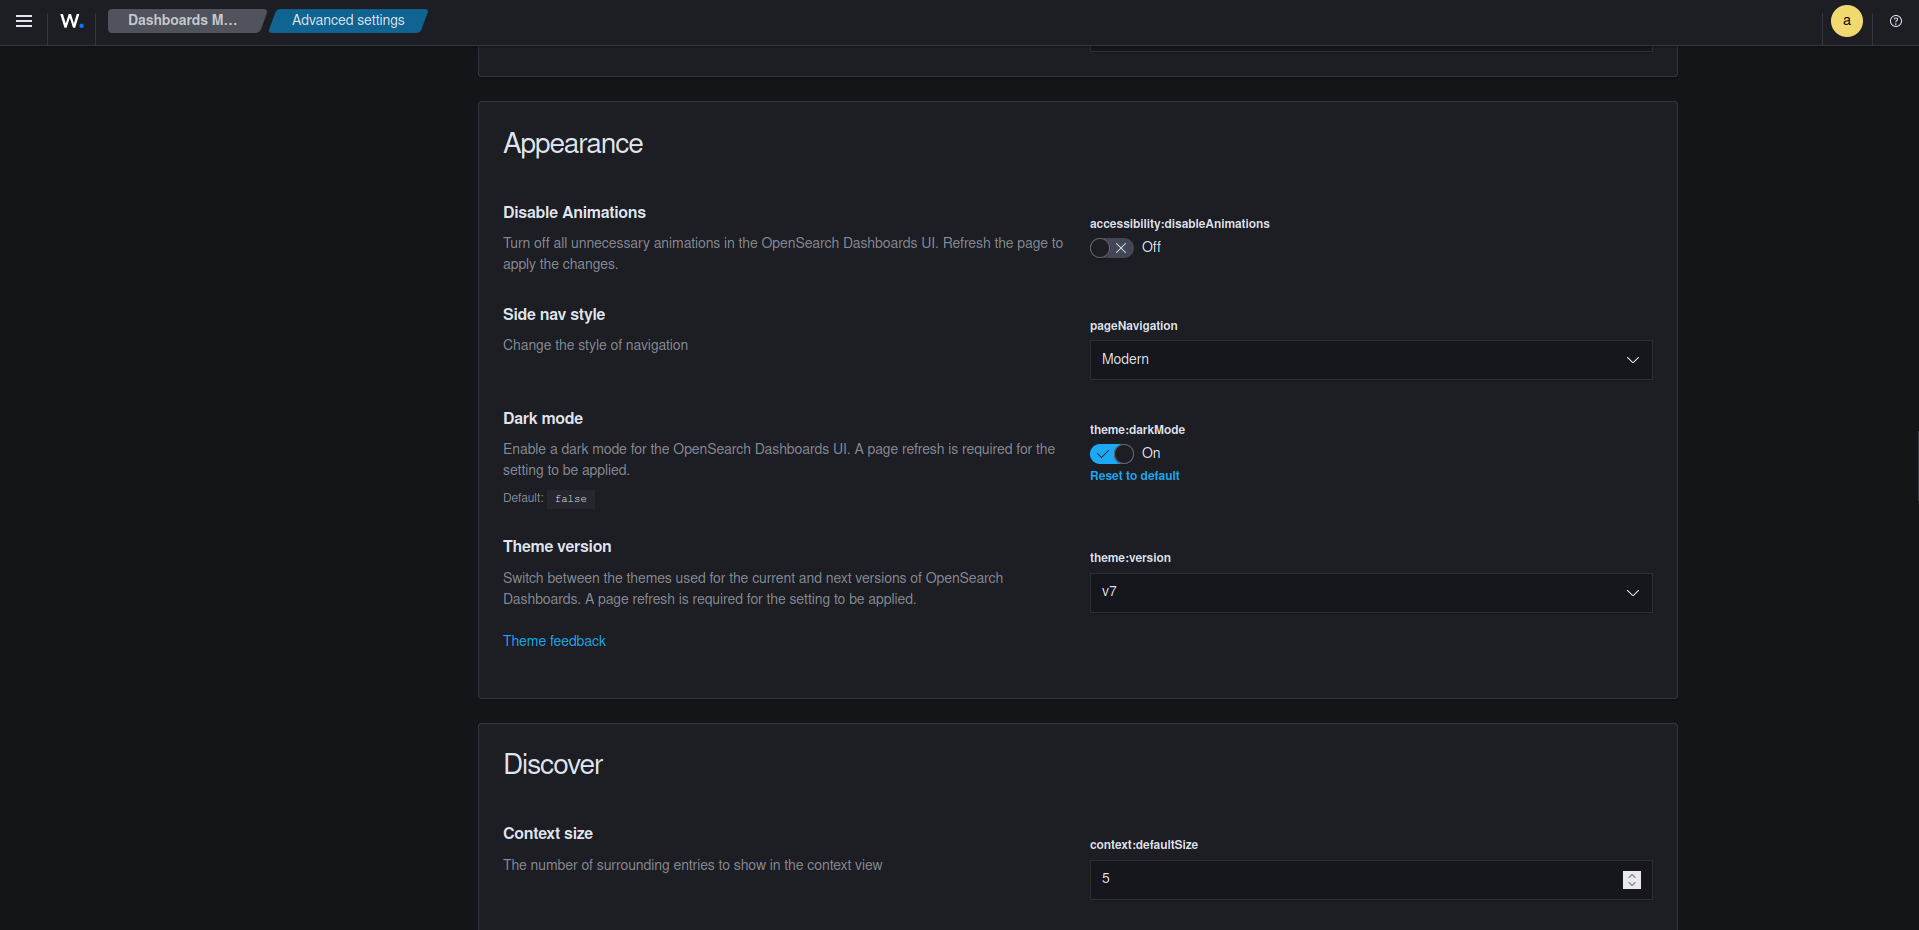
Advanced settings
In this section, you can configure advanced settings of the Wazuh Dashboard such as the date format.
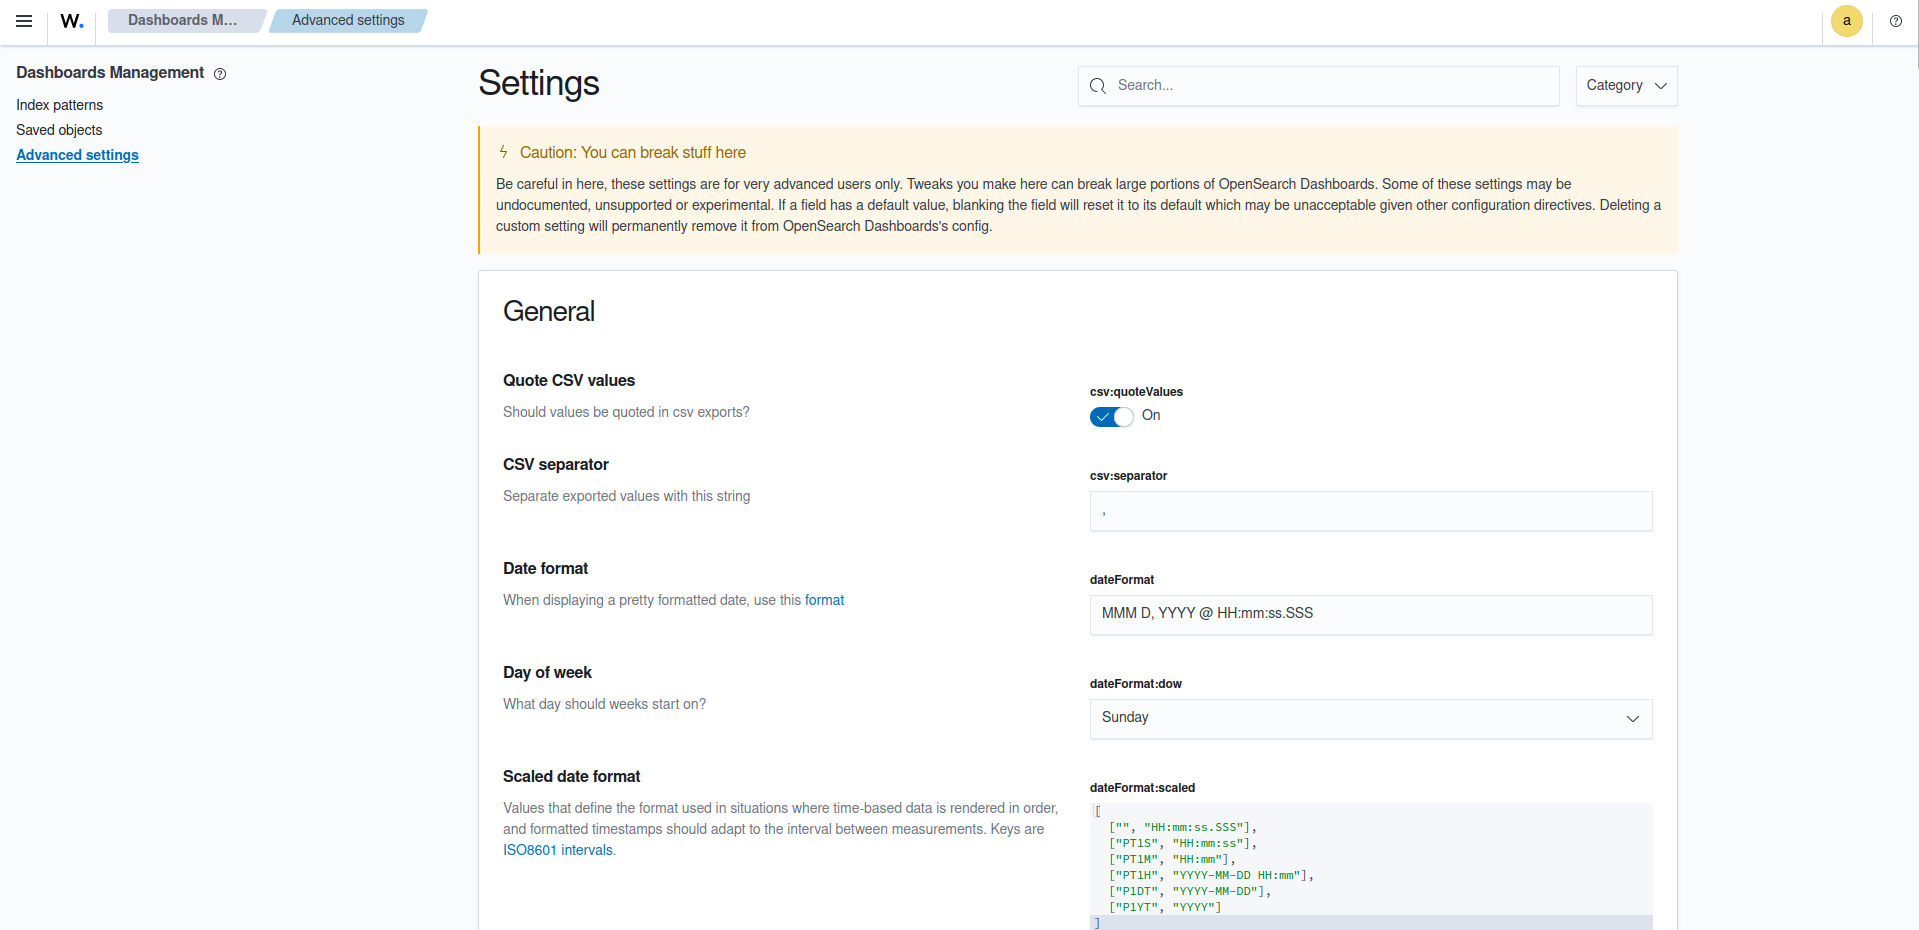
You can also switch the appearance to dark mode within advanced settings.
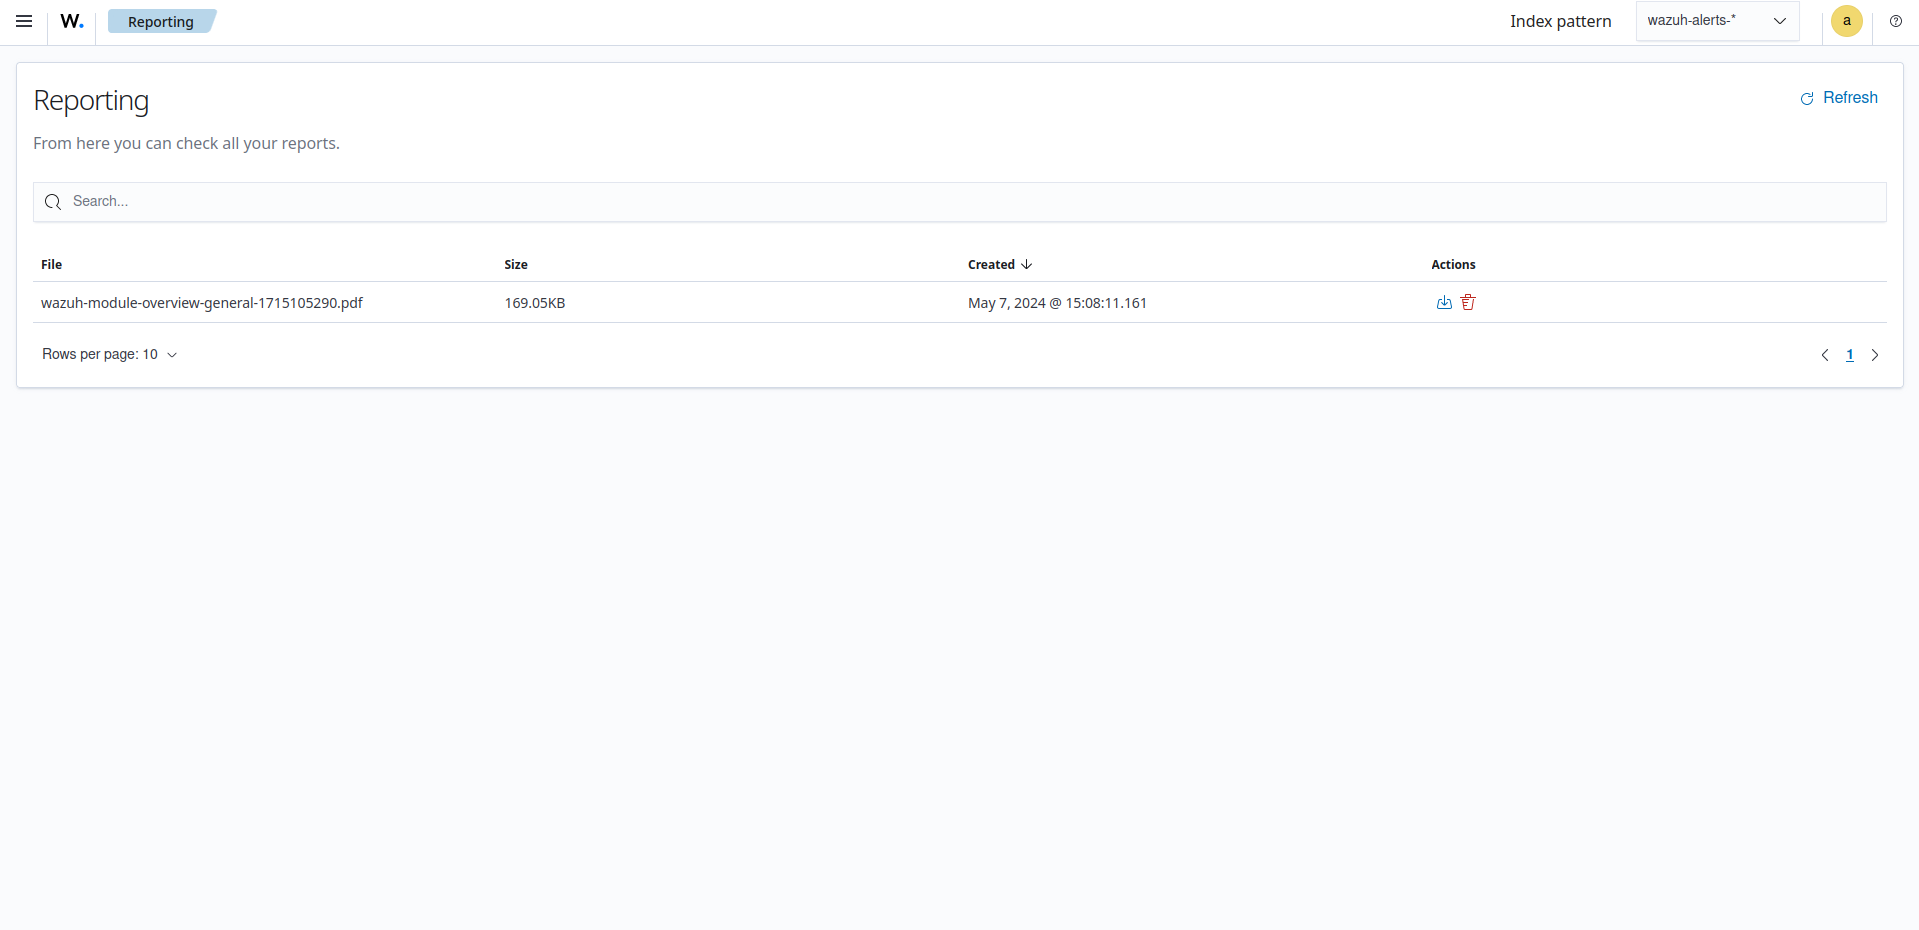
Reporting
Here, you can access the reports generated when clicked Generate Report in various modules.
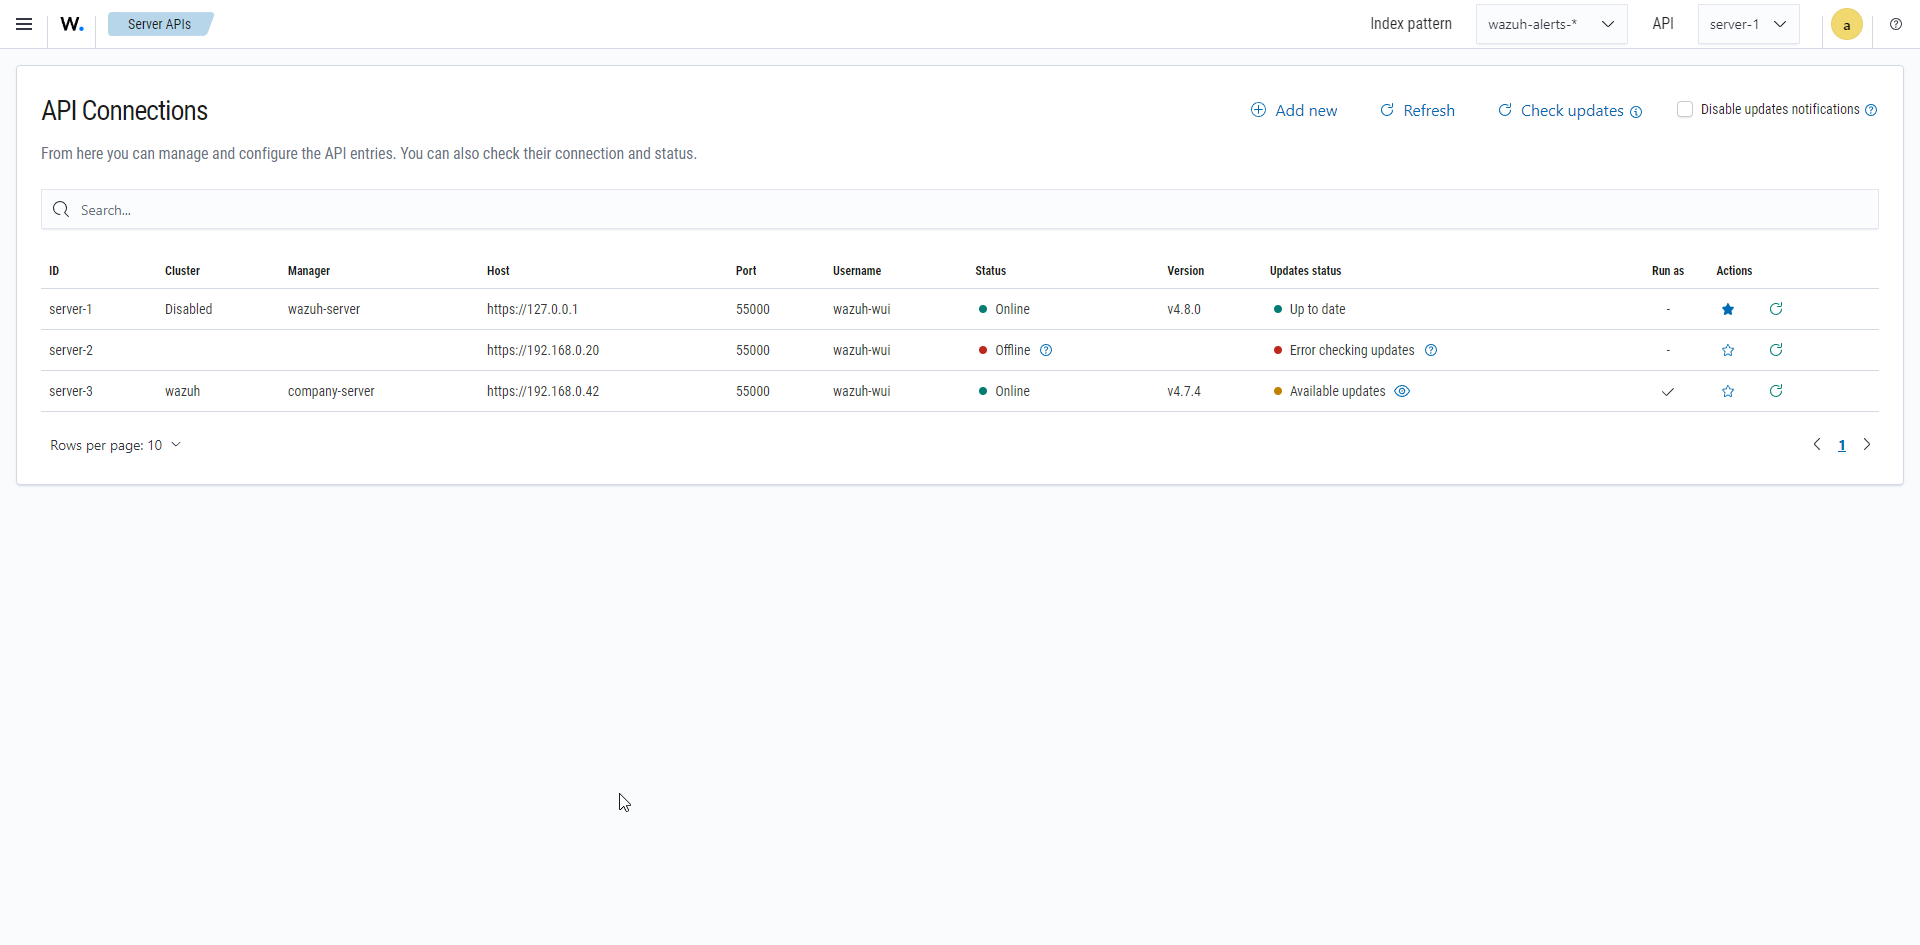
Server APIs
In this section, you can see information from all the Wazuh servers configured in /usr/share/wazuh-dashboard/data/wazuh/config/wazuh.yml. This information includes:
ID
Cluster mode
Hostname
Version
Run as mode
It also includes connection information such as
Server host
API port
API connection status.
Additionally, it shows possible updates for each server.
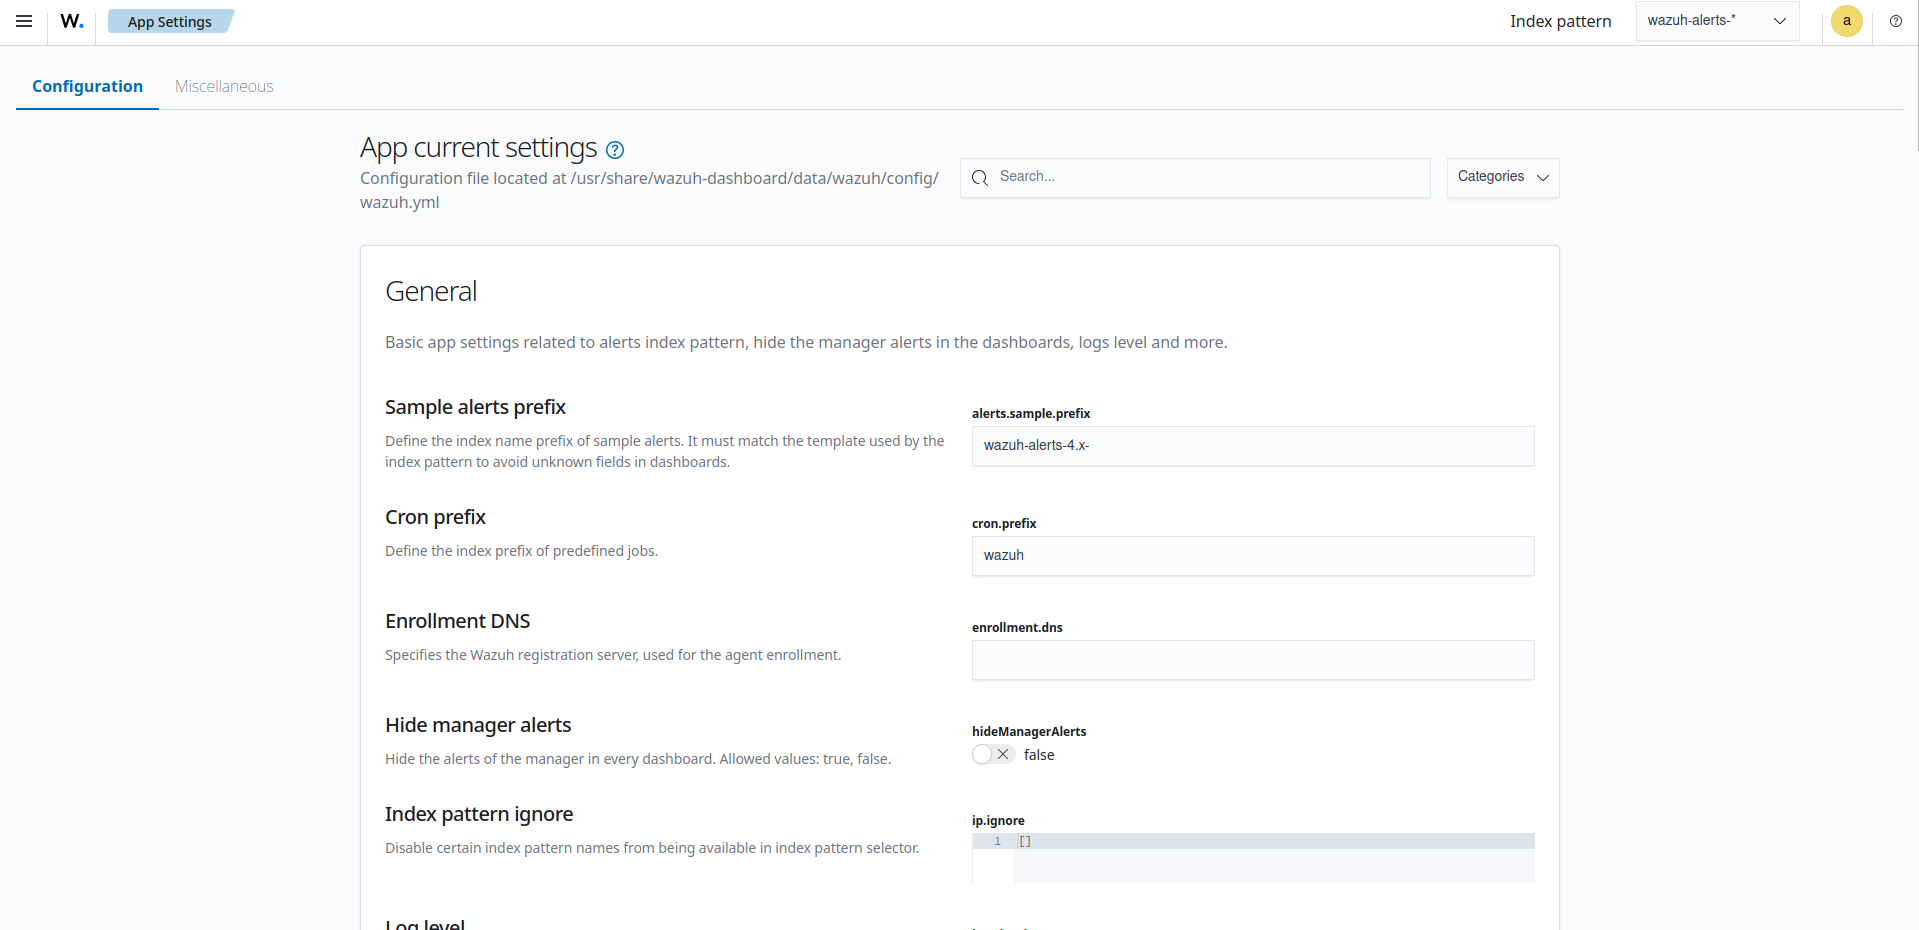
App Settings
Configuration
The Wazuh dashboard configuration file is located at /usr/share/wazuh-dashboard/data/wazuh/config/wazuh.yml. You can take a look at the configuration parameters in the Wazuh dashboard under Configuration.
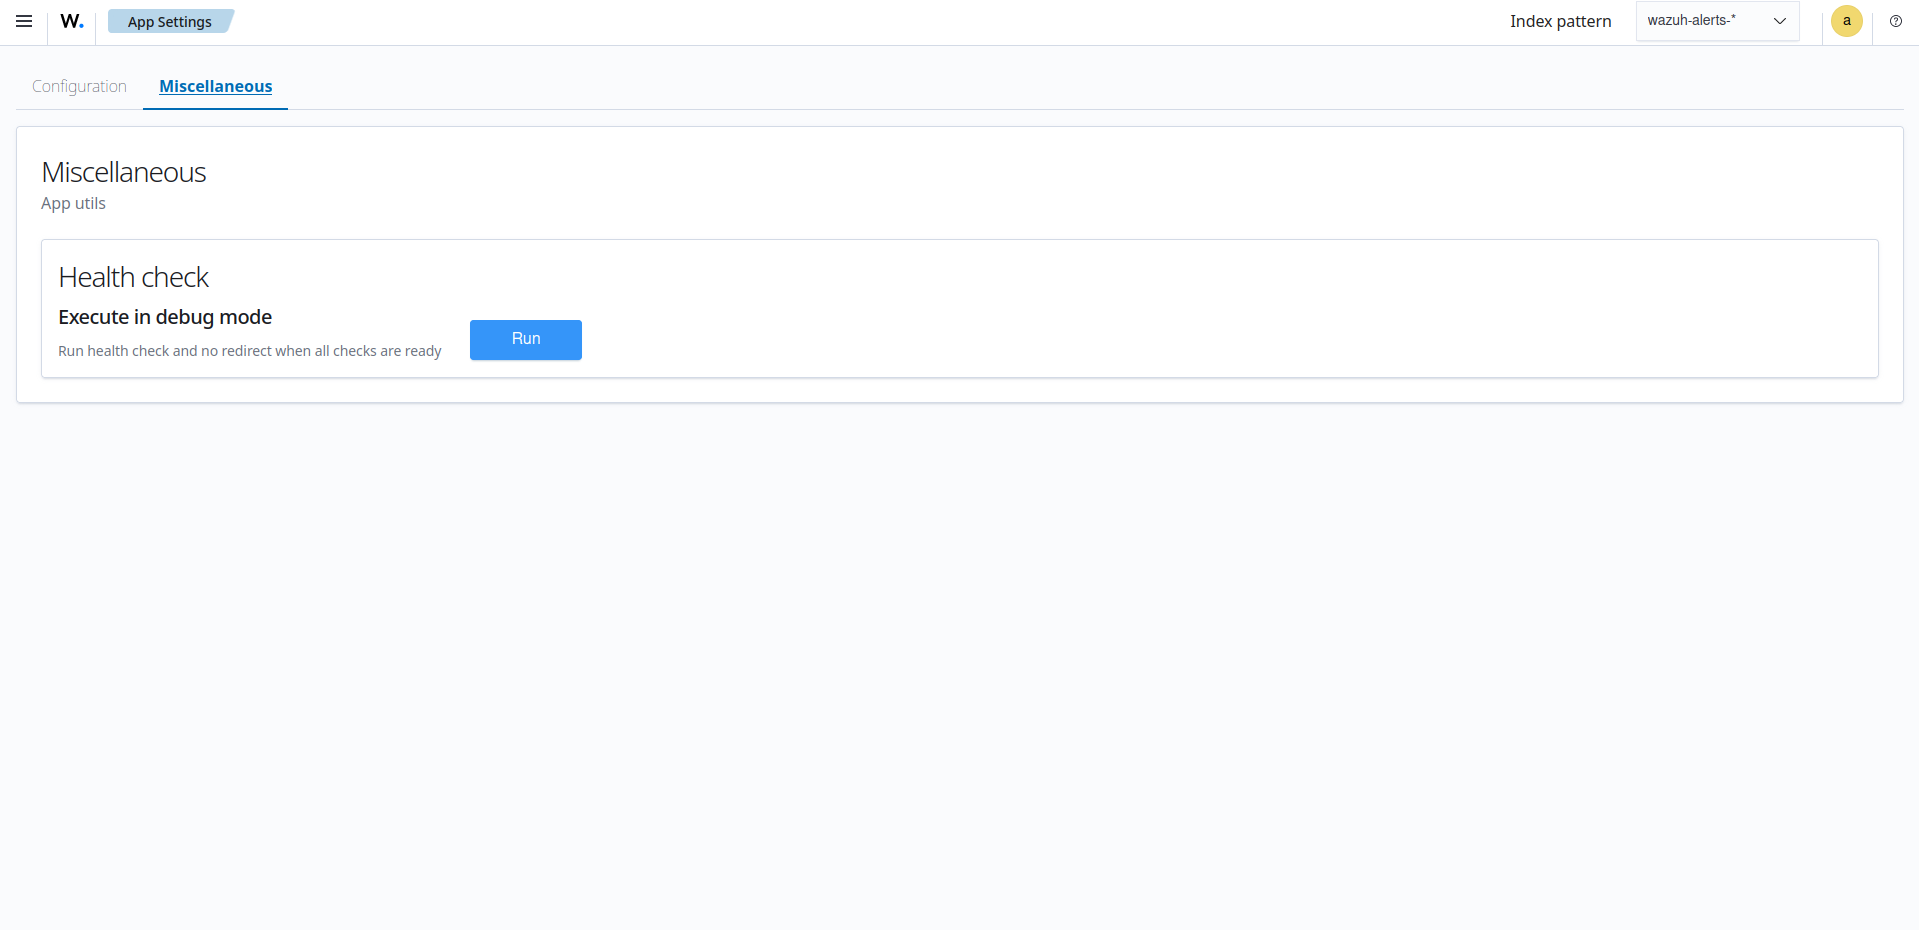
Miscellaneous
You can manually run the Wazuh dashboard health check from this section. This health check assesses the operational status and performance of the Wazuh dashboard.
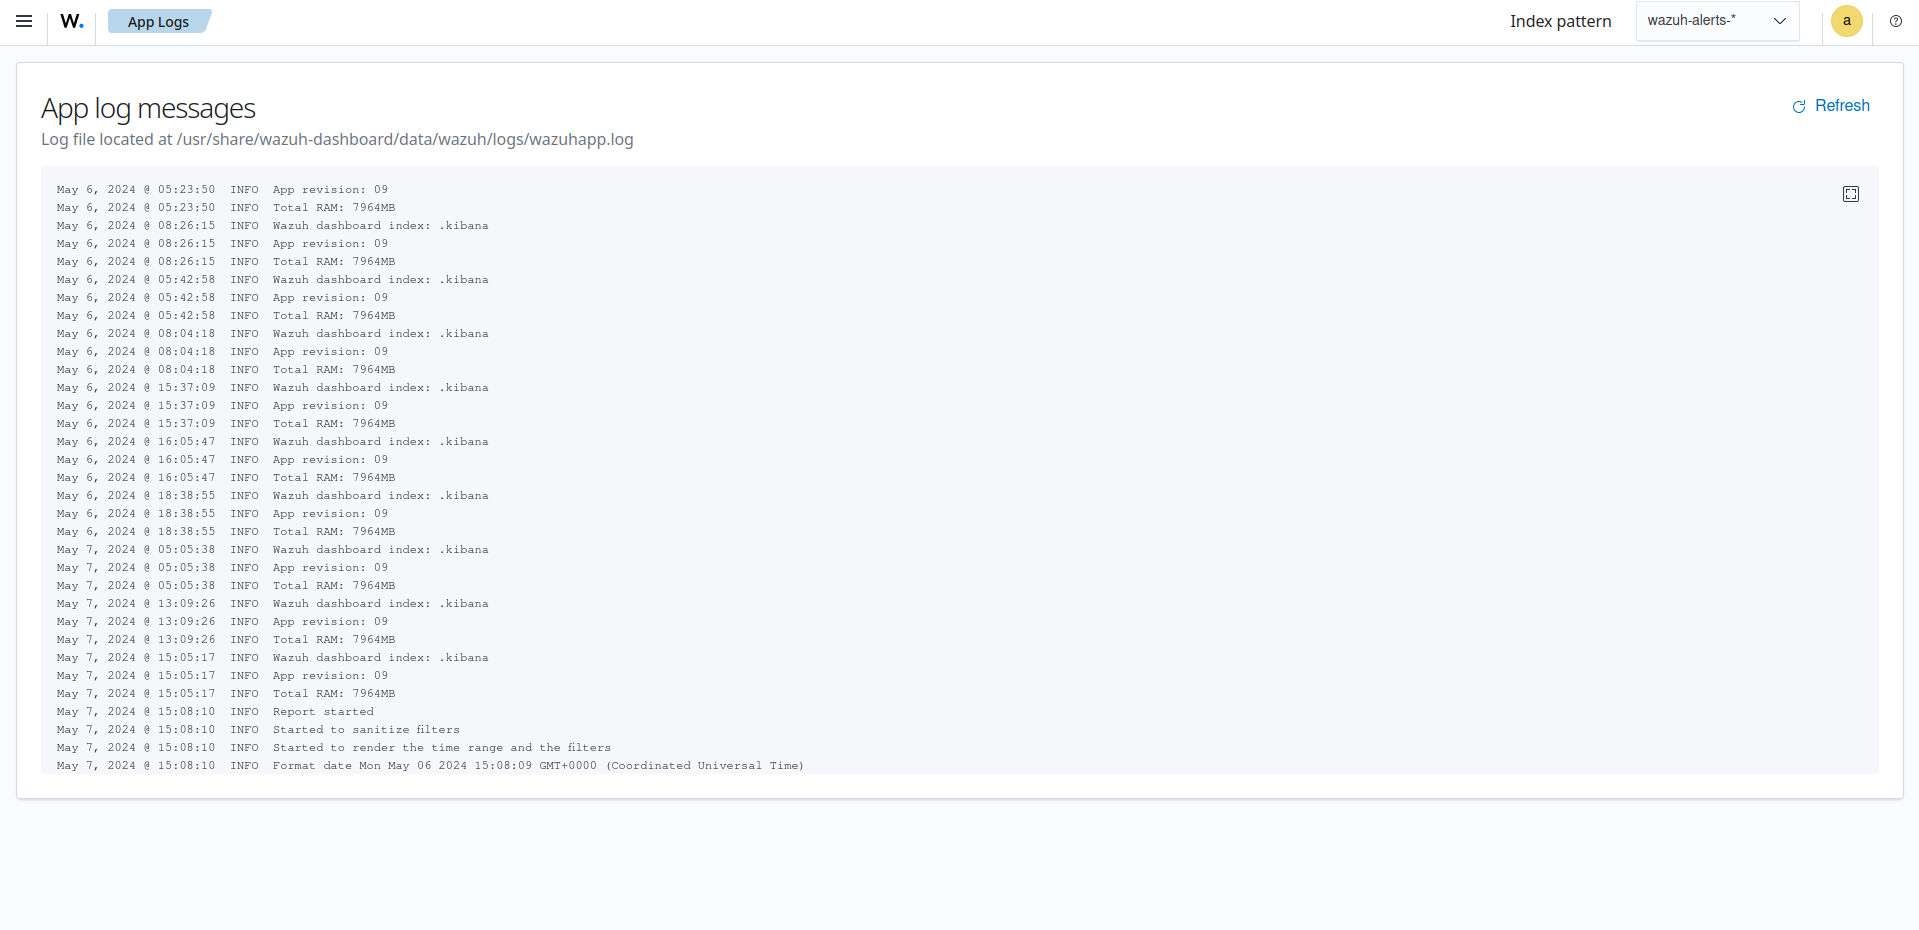
App Logs
The Wazuh dashboard stores log information in the /usr/share/wazuh-dashboard/data/wazuh/logs/wazuhapp.log file. These logs help with troubleshooting.
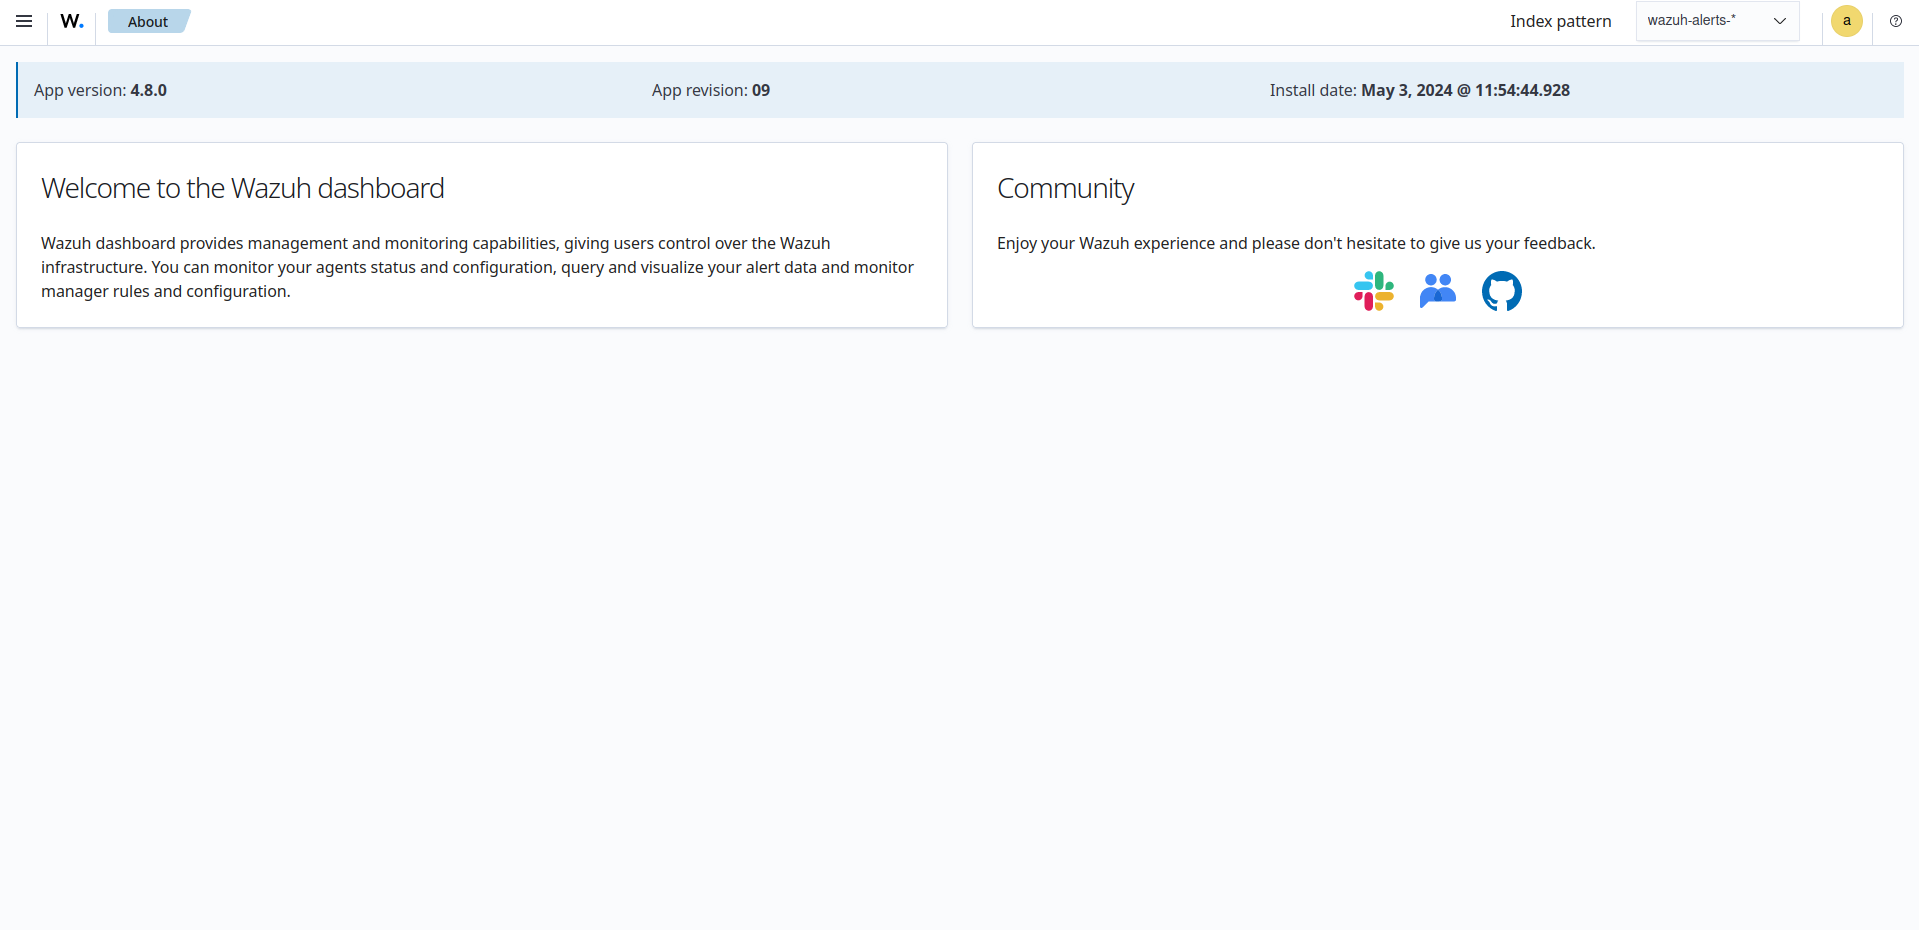
About
This section provides information about your currently installed Wazuh dashboard package, including:
Version
Revision
Installation date
To discover new features in each release, check the Wazuh dashboard changelog file.