Viewing system inventory data
You can query and visualize centralized system inventory data from all monitored endpoints in the IT Hygiene section on the Wazuh dashboard. This provides a unified view of your environment's status across all monitored endpoints.
The IT Hygiene section organizes data into multiple categories:
Dashboard: View an overview of key metrics and a summary of your environment.
System: Analyze operating system and hardware information.
Software: Review installed packages and software vendors.
Processes: Monitor running processes.
Network: Inspect network configurations, interfaces, and traffic.
To access the IT hygiene section, navigate to Security operations > IT Hygiene on the Wazuh dashboard.
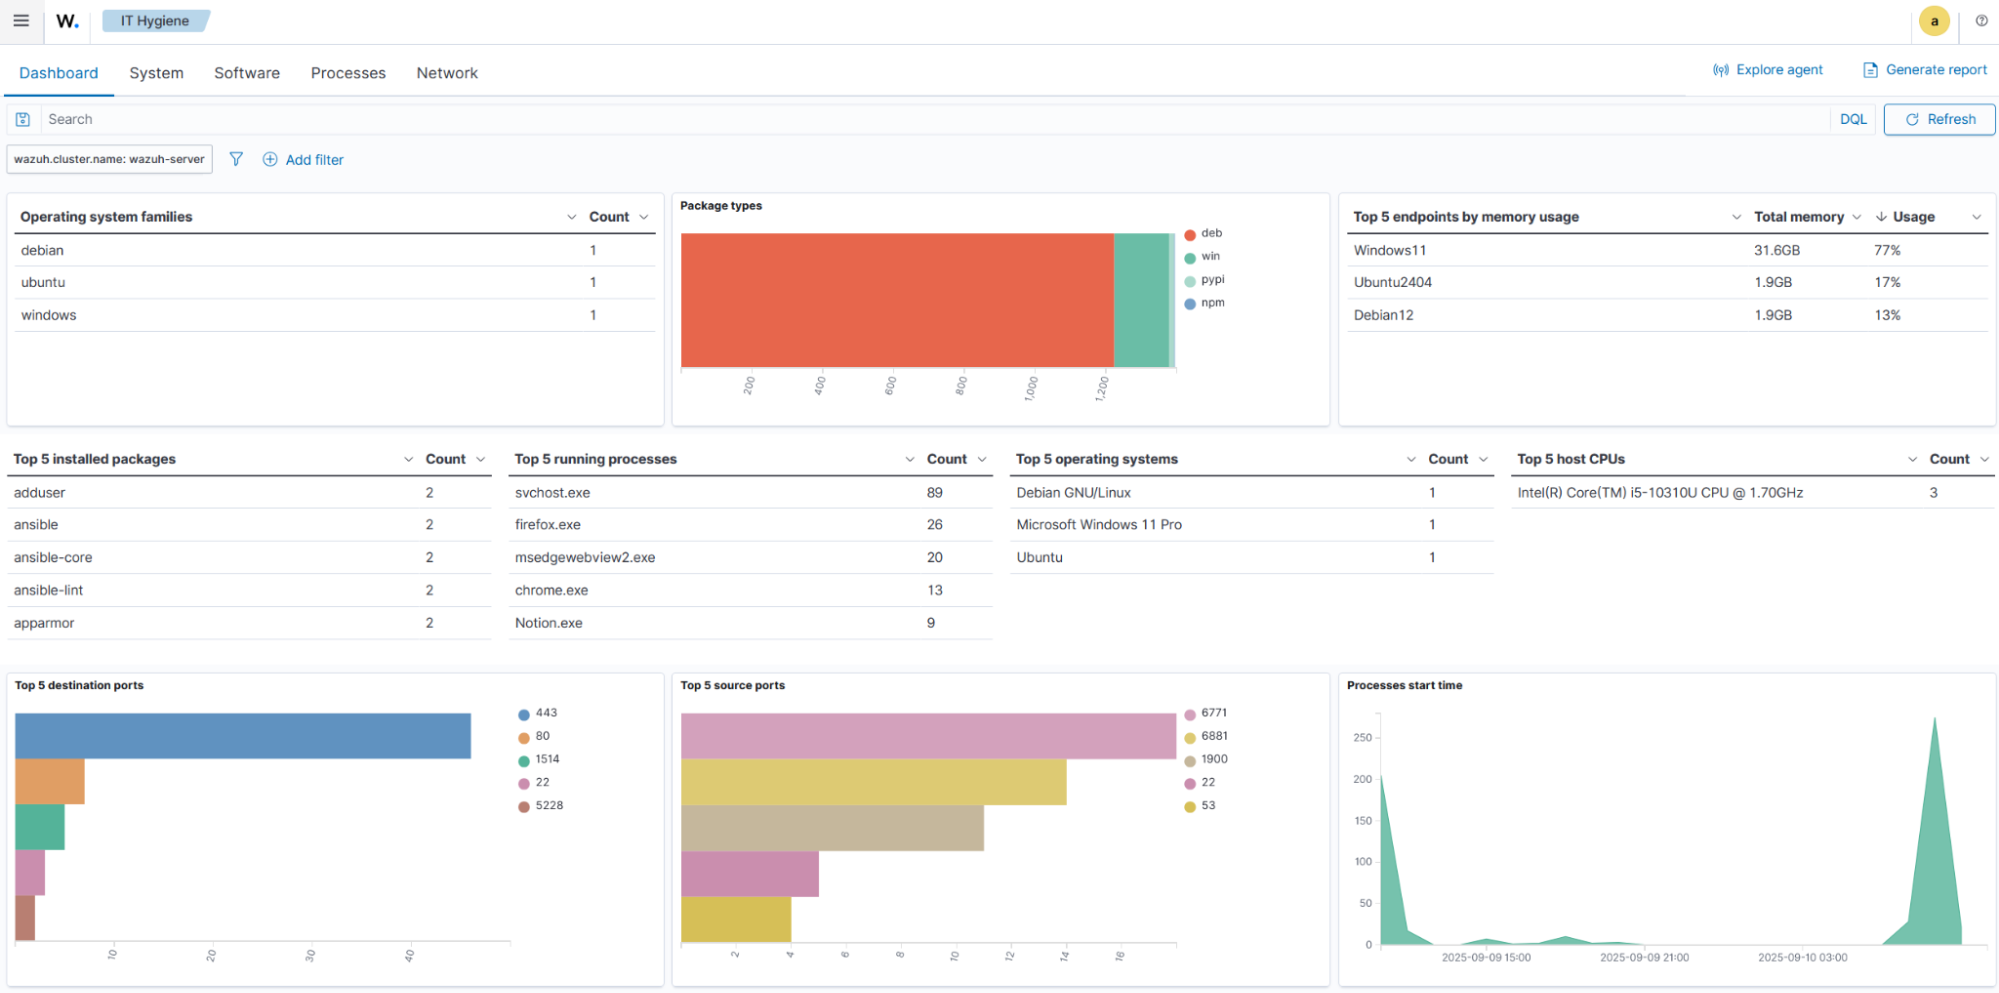
Dashboard
Shows a consolidated view of the system inventory data across multiple or selected monitored endpoints. It visualizes key metrics such as operating system families, package types, installed packages, running packages, operating systems, host CPUs, source ports, and process start times.
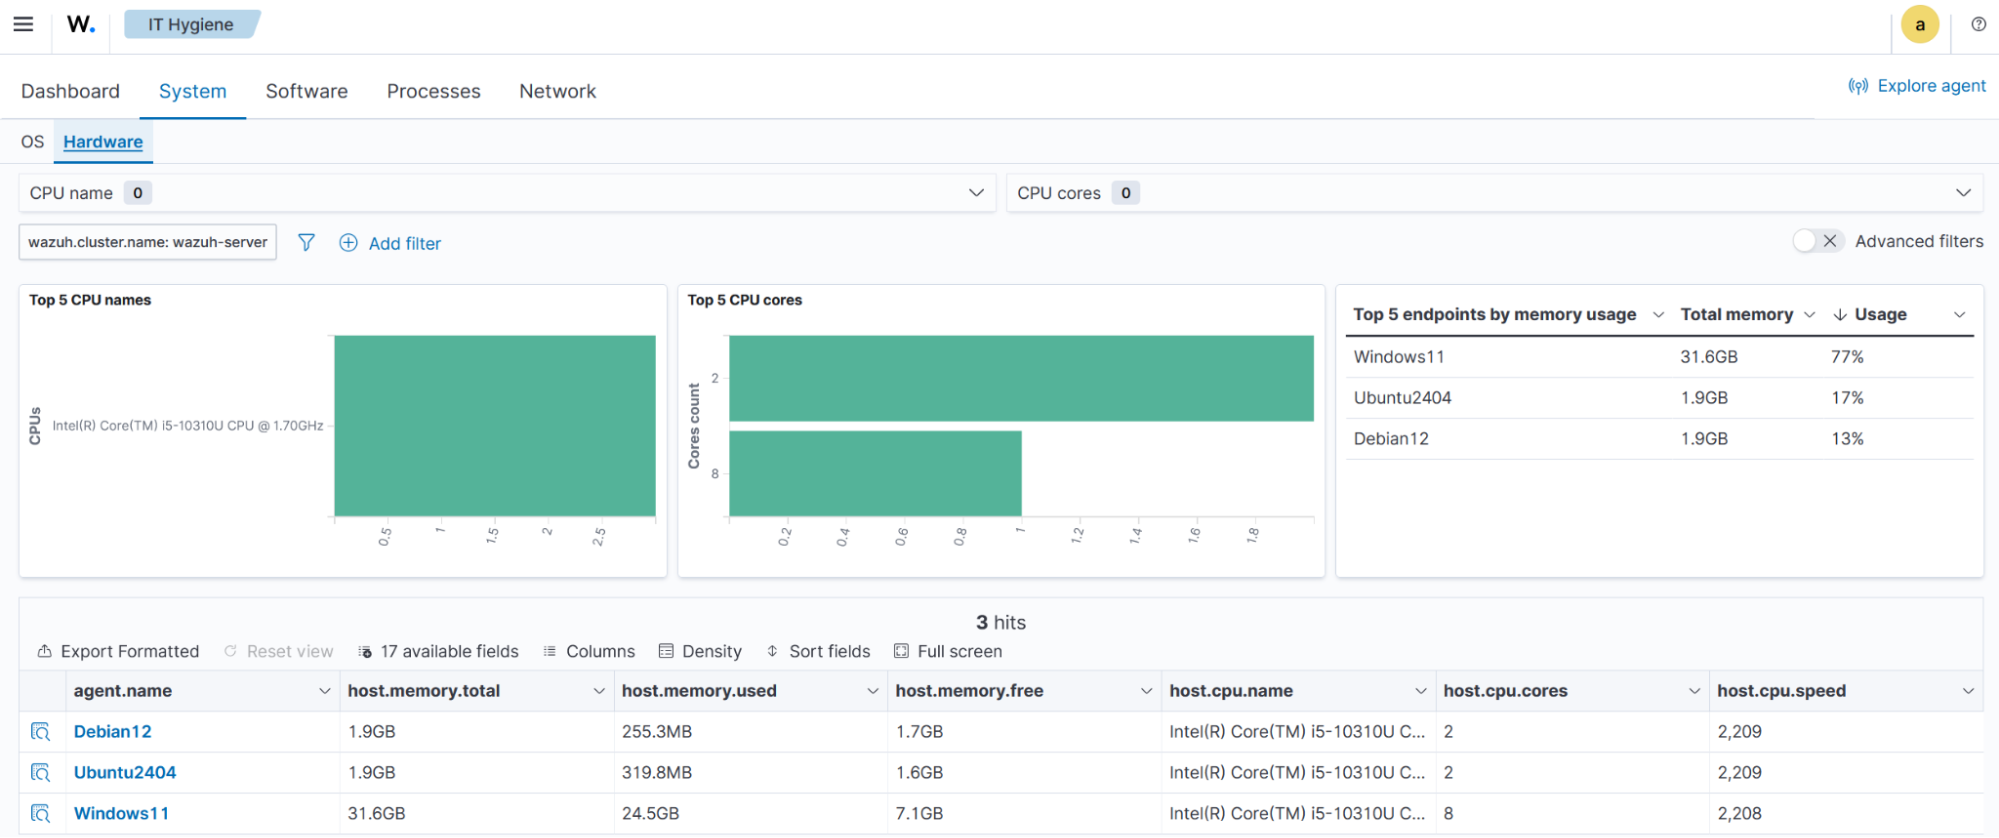
System
Provides a detailed breakdown of the operating systems and hardware in your environment.
The OS tab provides an operating system and hardware information breakdown across all monitored endpoints.

The Hardware tab displays top CPU models, CPU cores, the most used memory, and a summary data table.
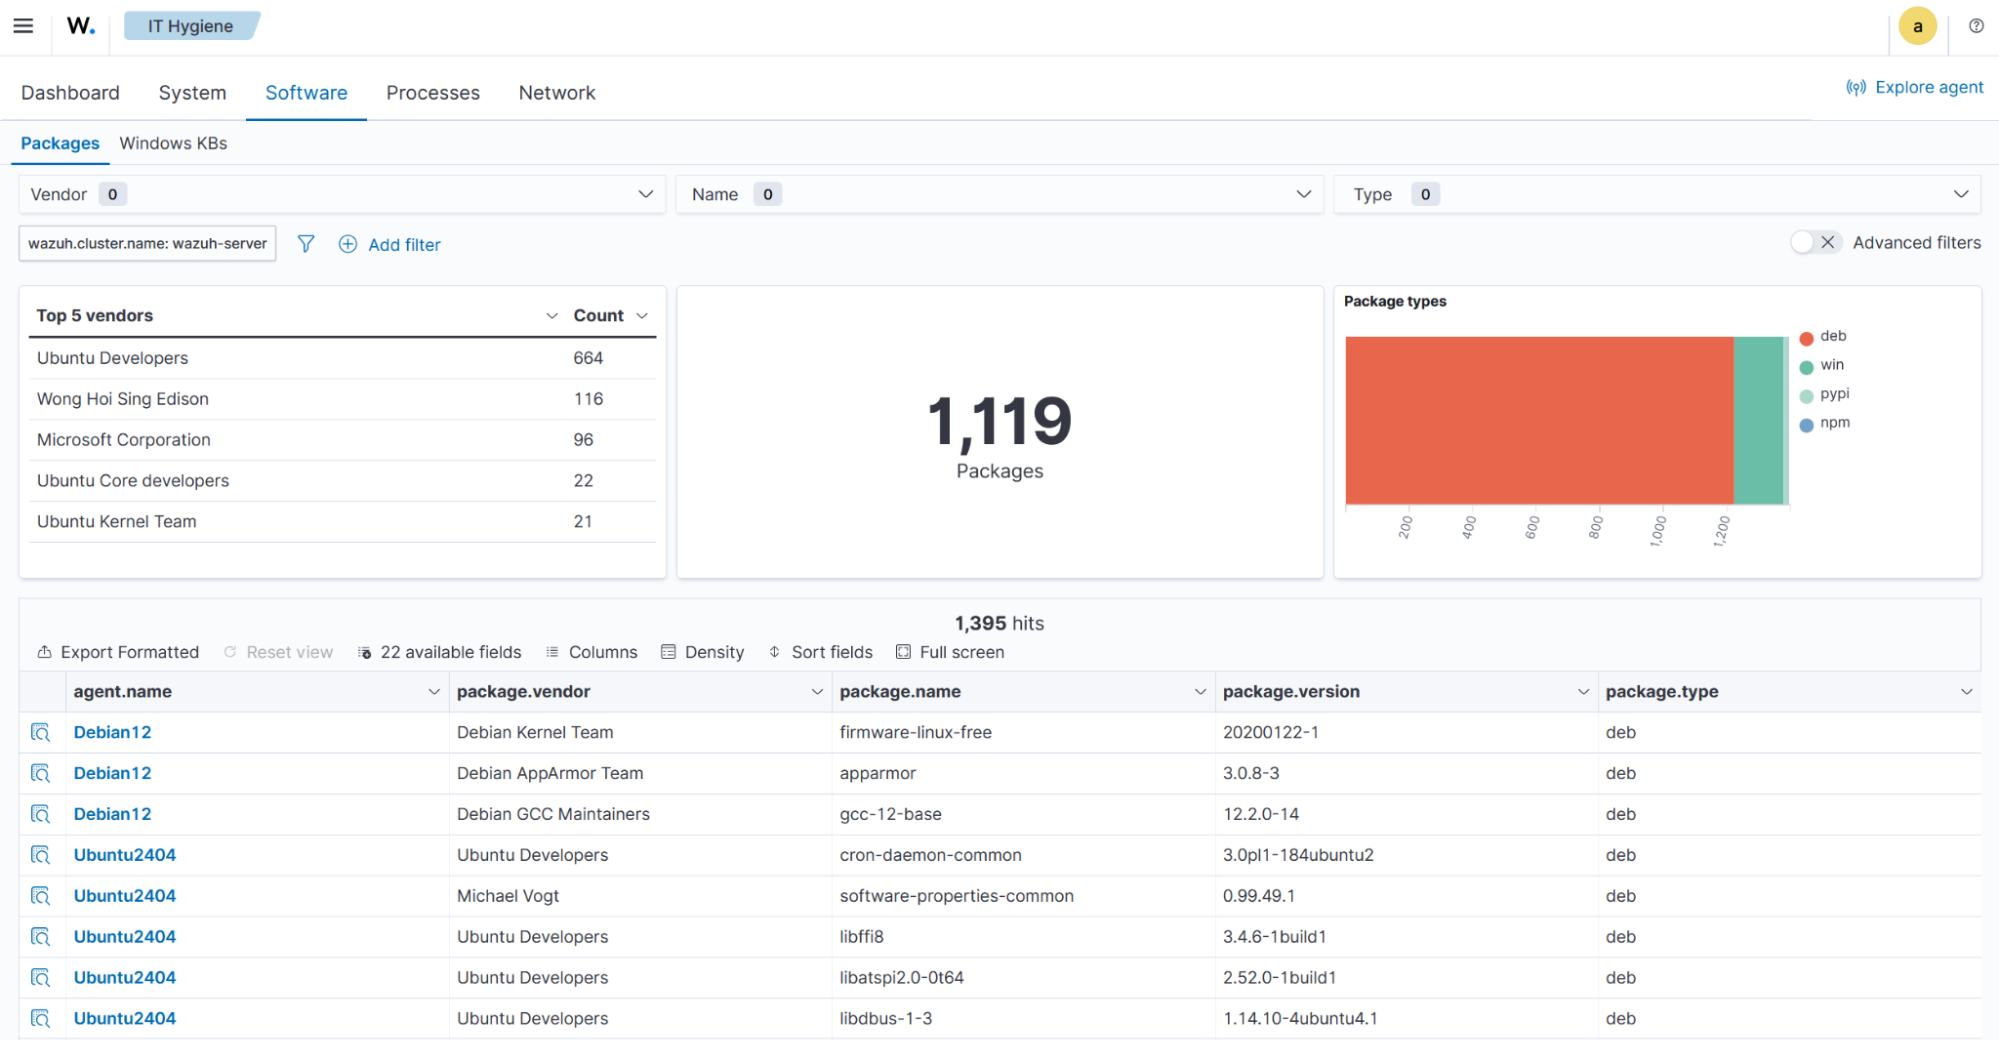
Software
Contains an overview of software packages and Windows KBs on monitored endpoints.
The Packages tab displays package data, including top software vendors, the number of installed packages, the types of packages, and a summary data table.
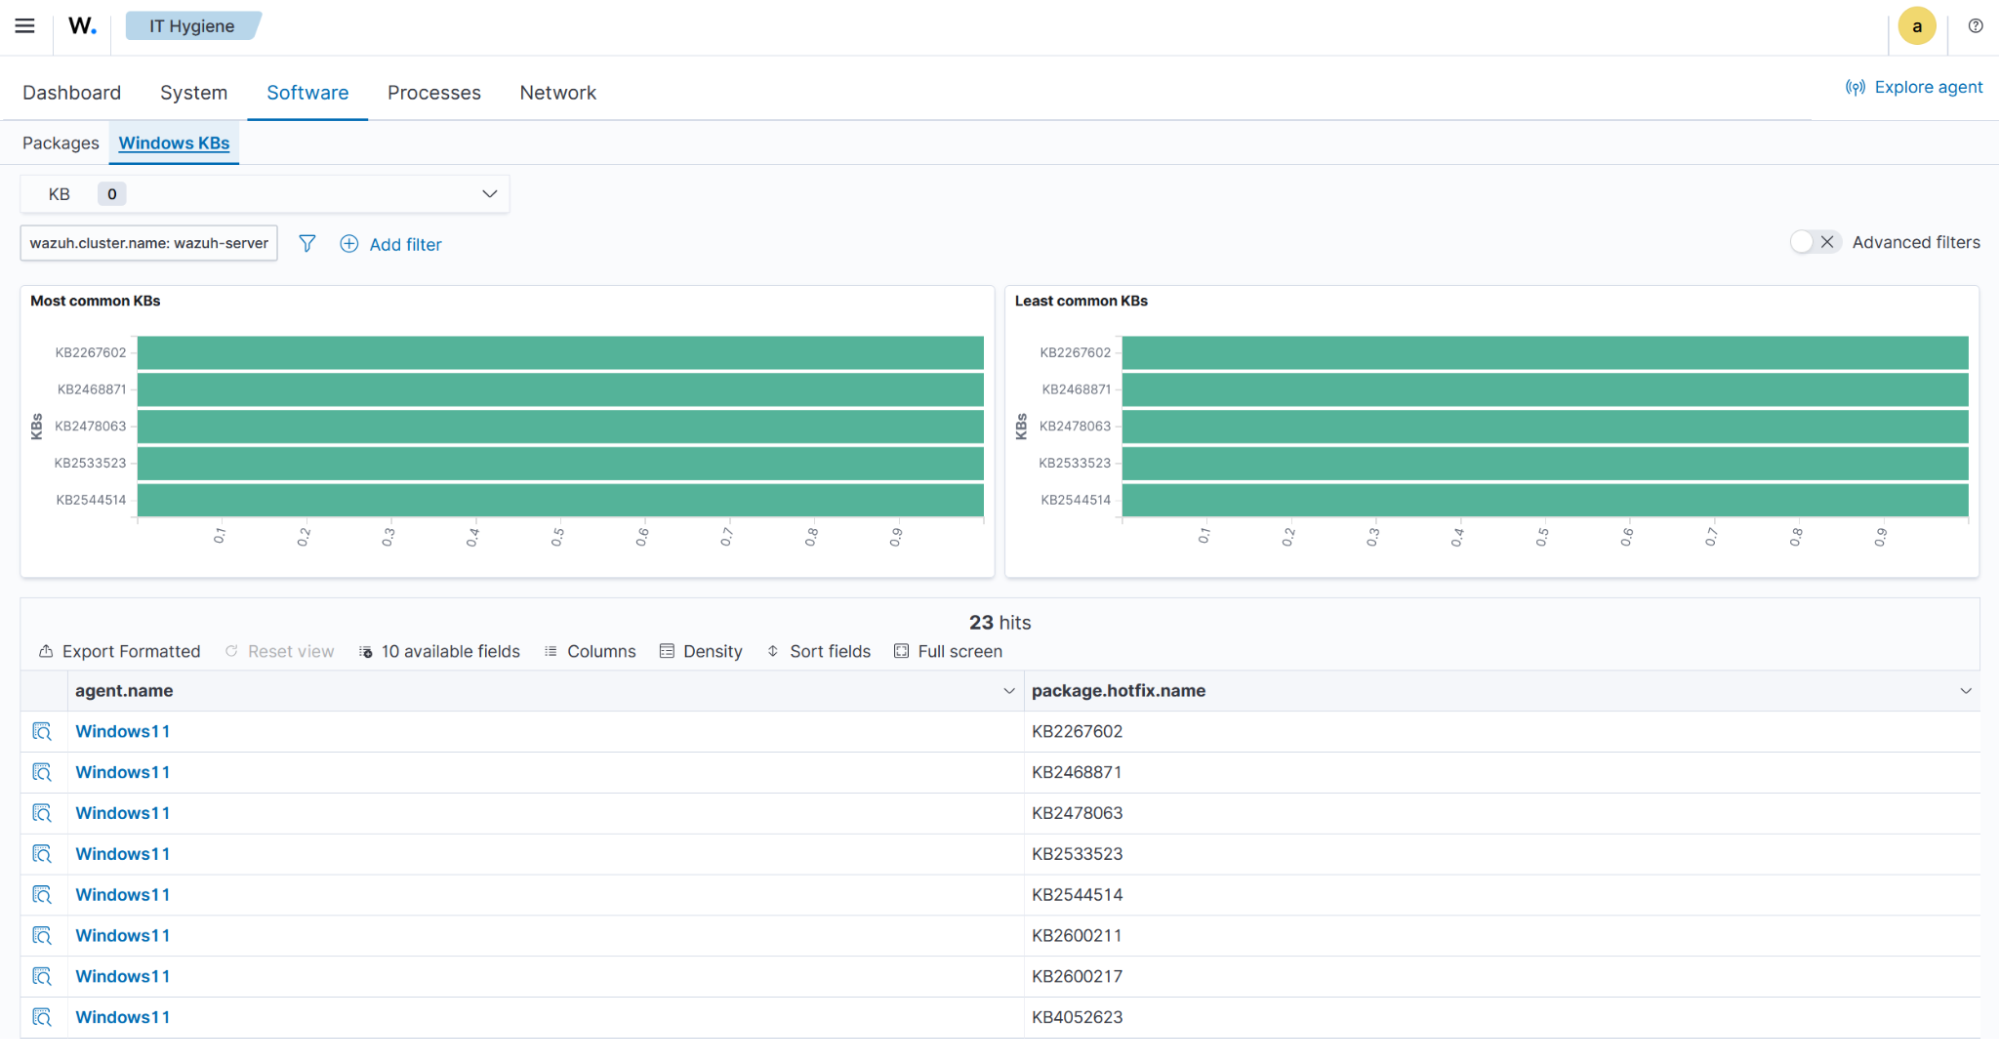
The Windows KBs tab displays the Windows Knowledge Base data, including the most and least common Knowledge Bases.
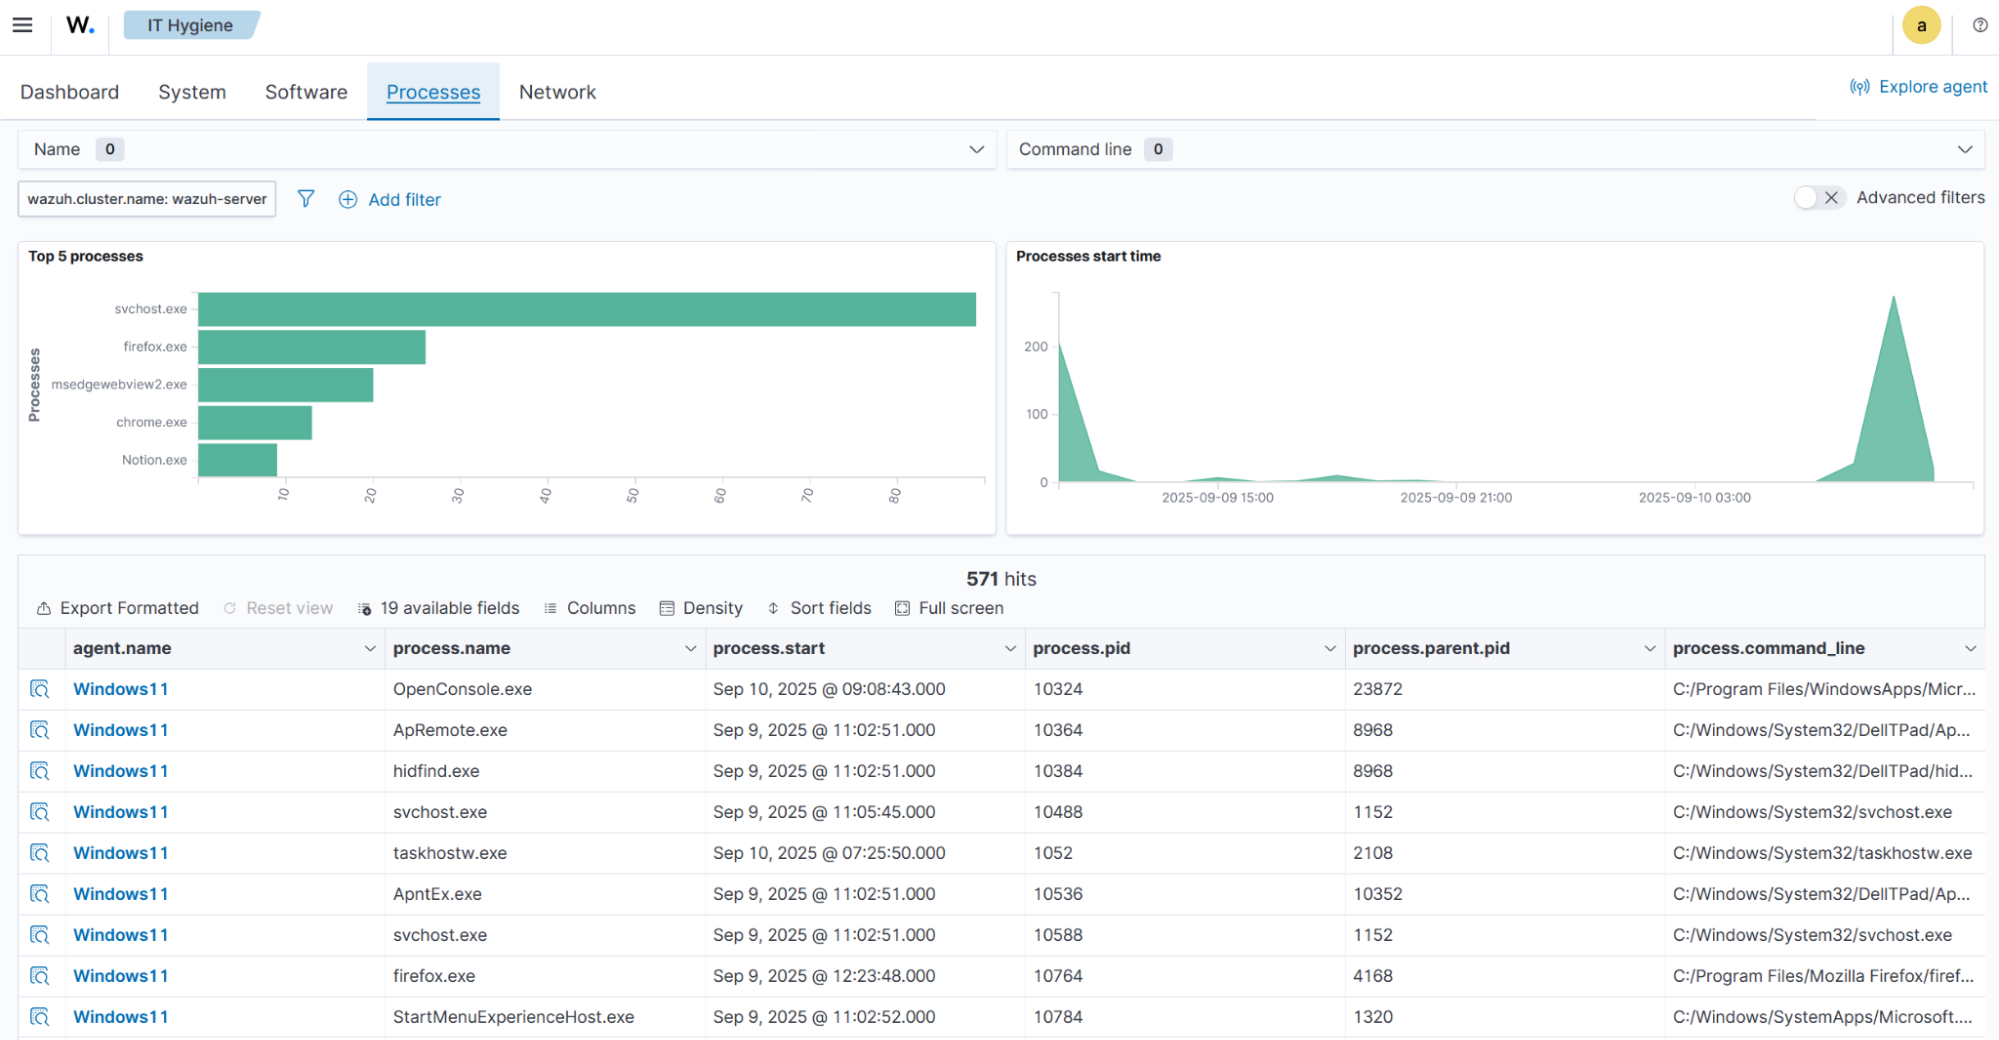
Processes
Displays running processes, process start times, and a summary data table containing process details for the monitored endpoints.
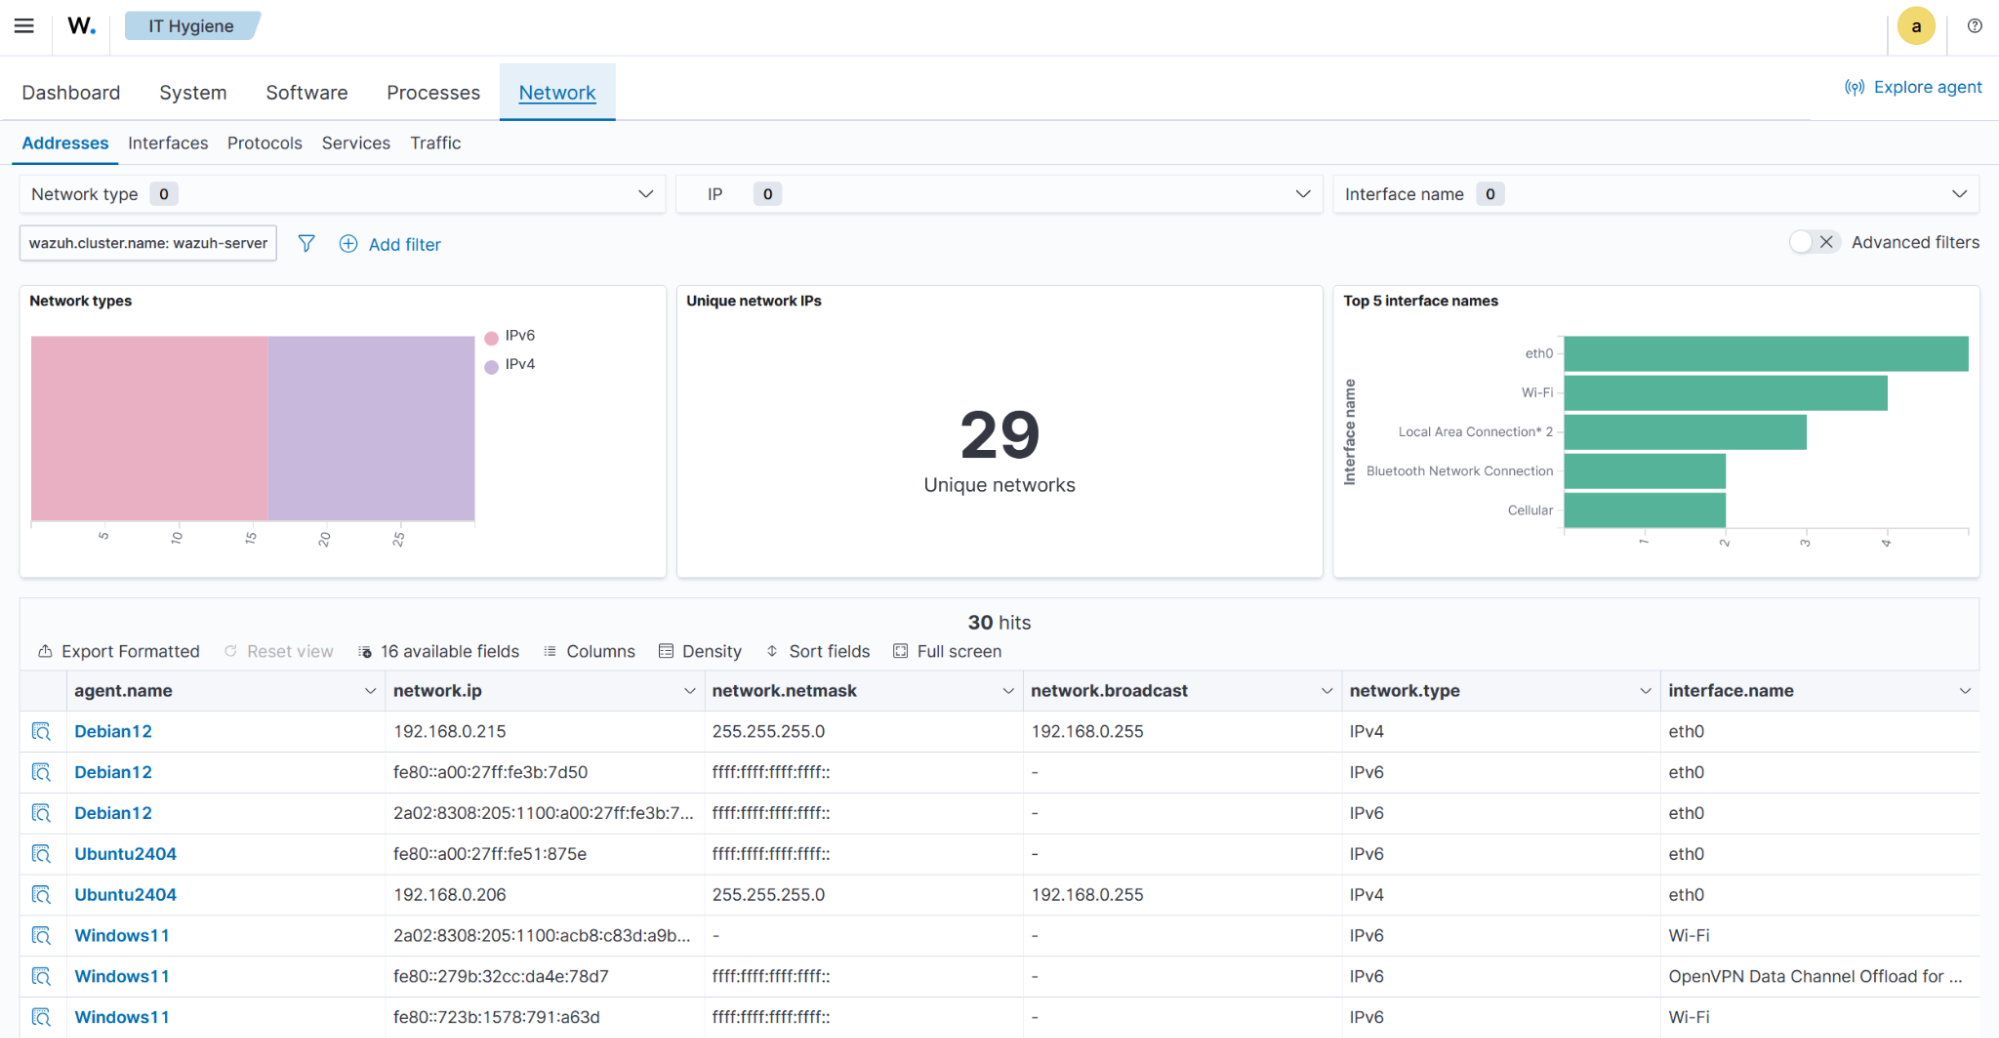
Network
Contains the Addresses, Interfaces, Protocols, Services, and Traffic tabs.
The Addresses tab provides a detailed view of network types, unique network IP addresses, interface names, and a summary data table containing detailed network address information.
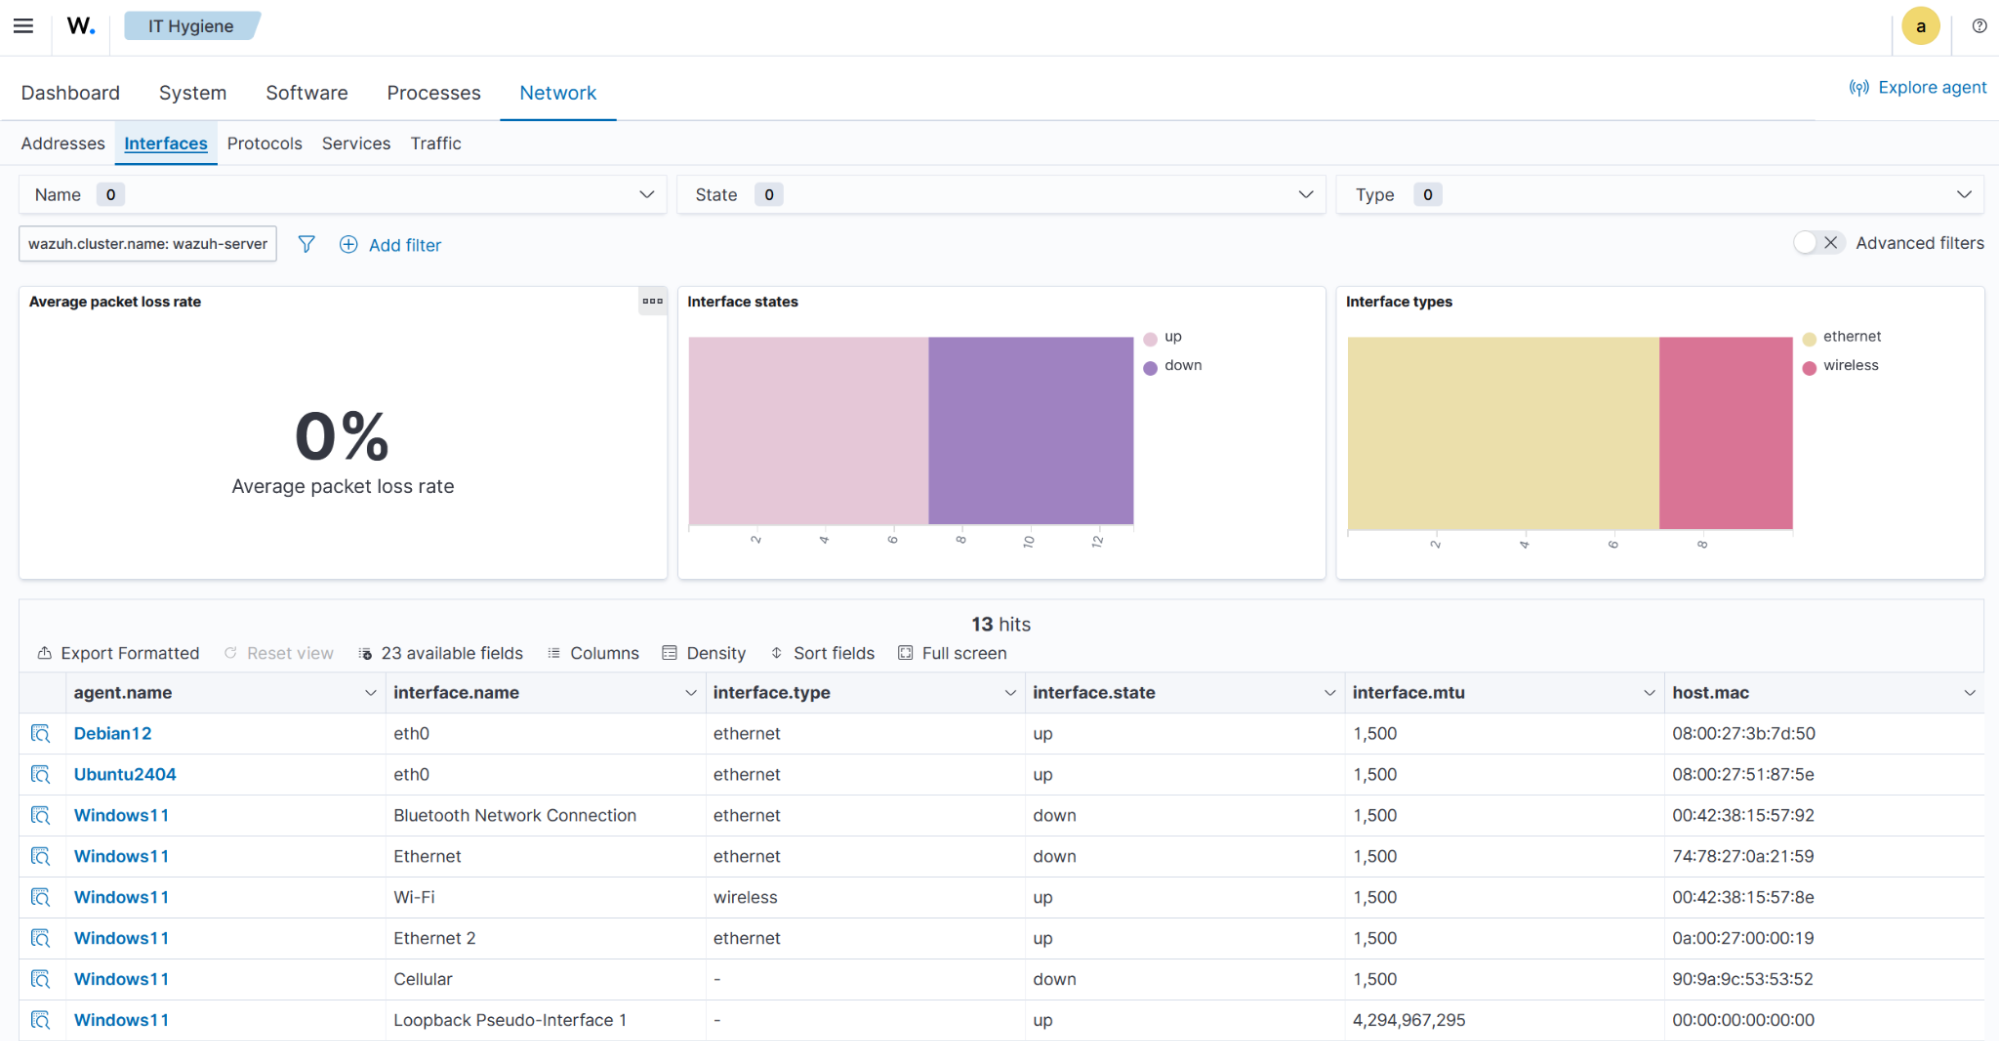
The Interfaces tab offers a detailed view of network interfaces, displaying average packet loss, interface states, interface types, and a summary data table of interface-level details.
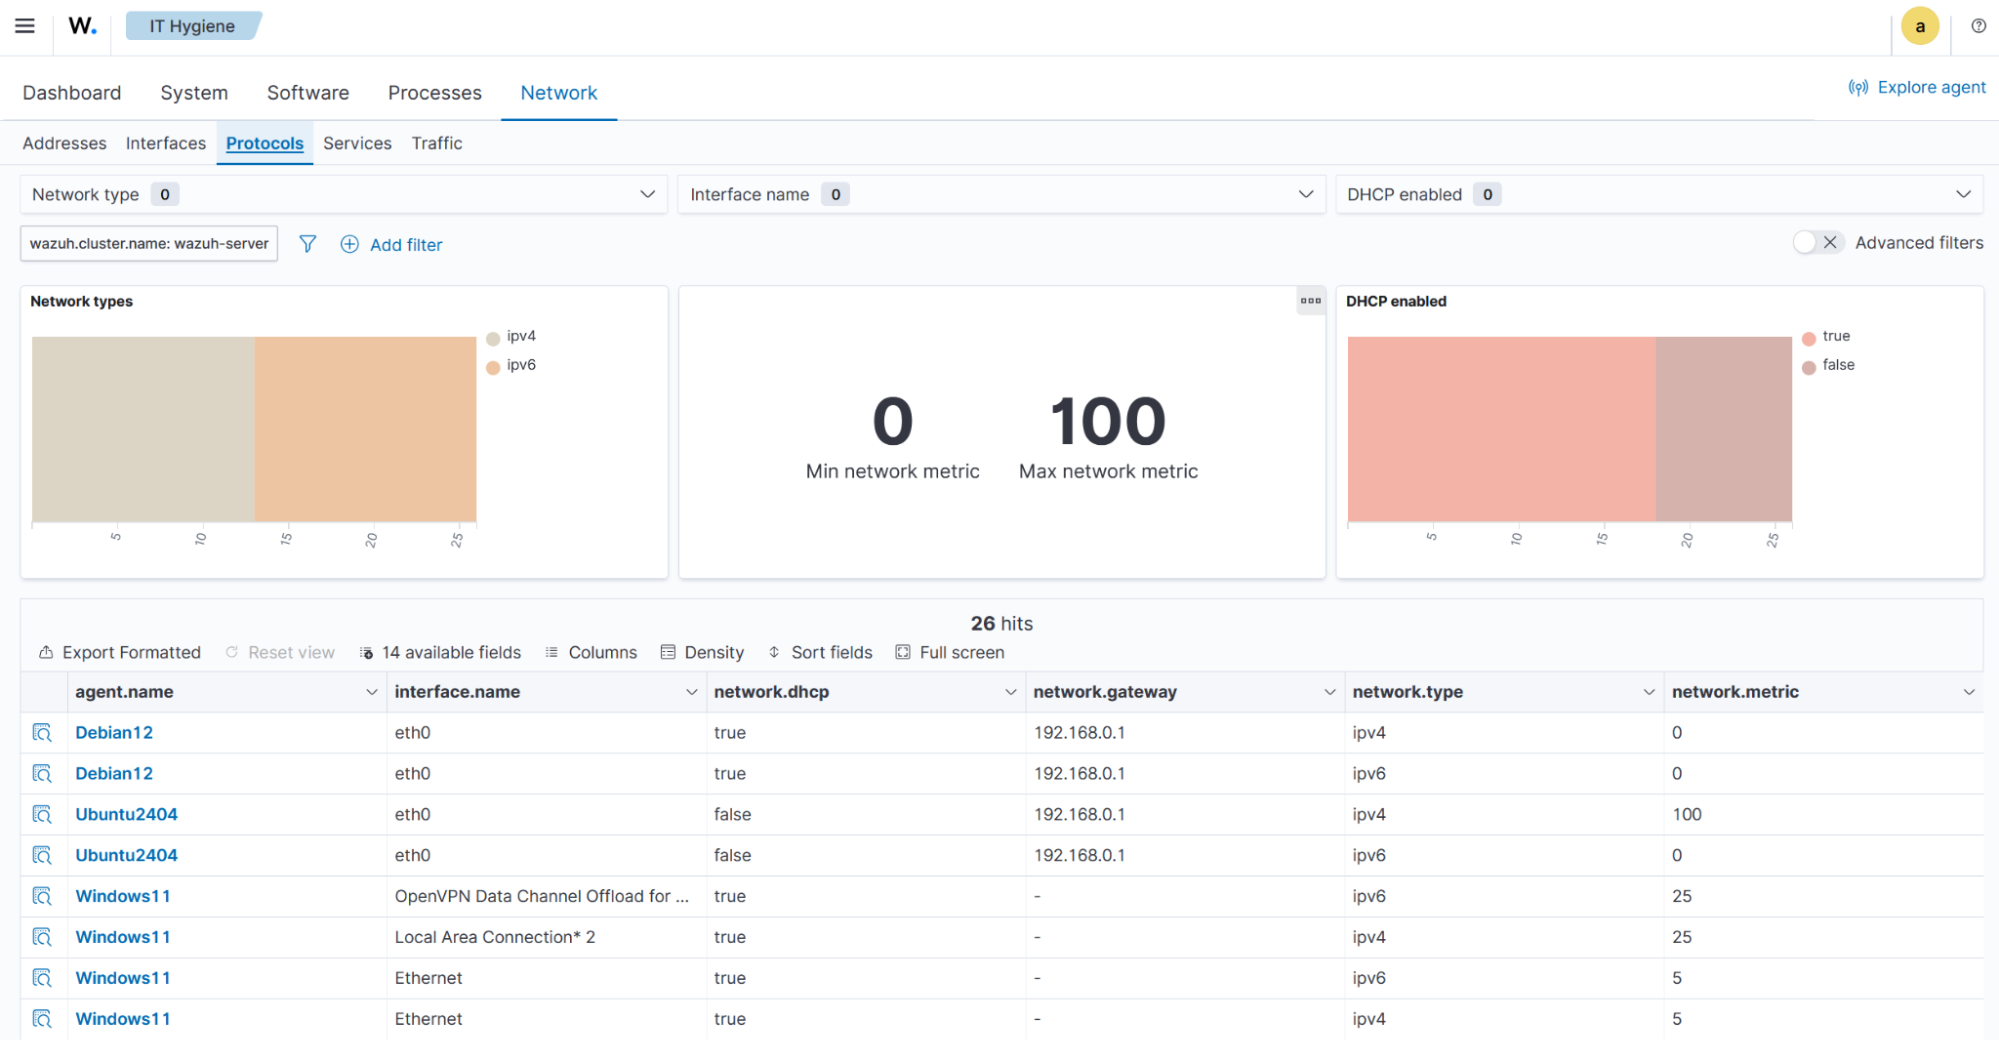
The Protocols tab offers a detailed view of network types, network metrics, and DHCP status, and a summary table with more protocol-level details.
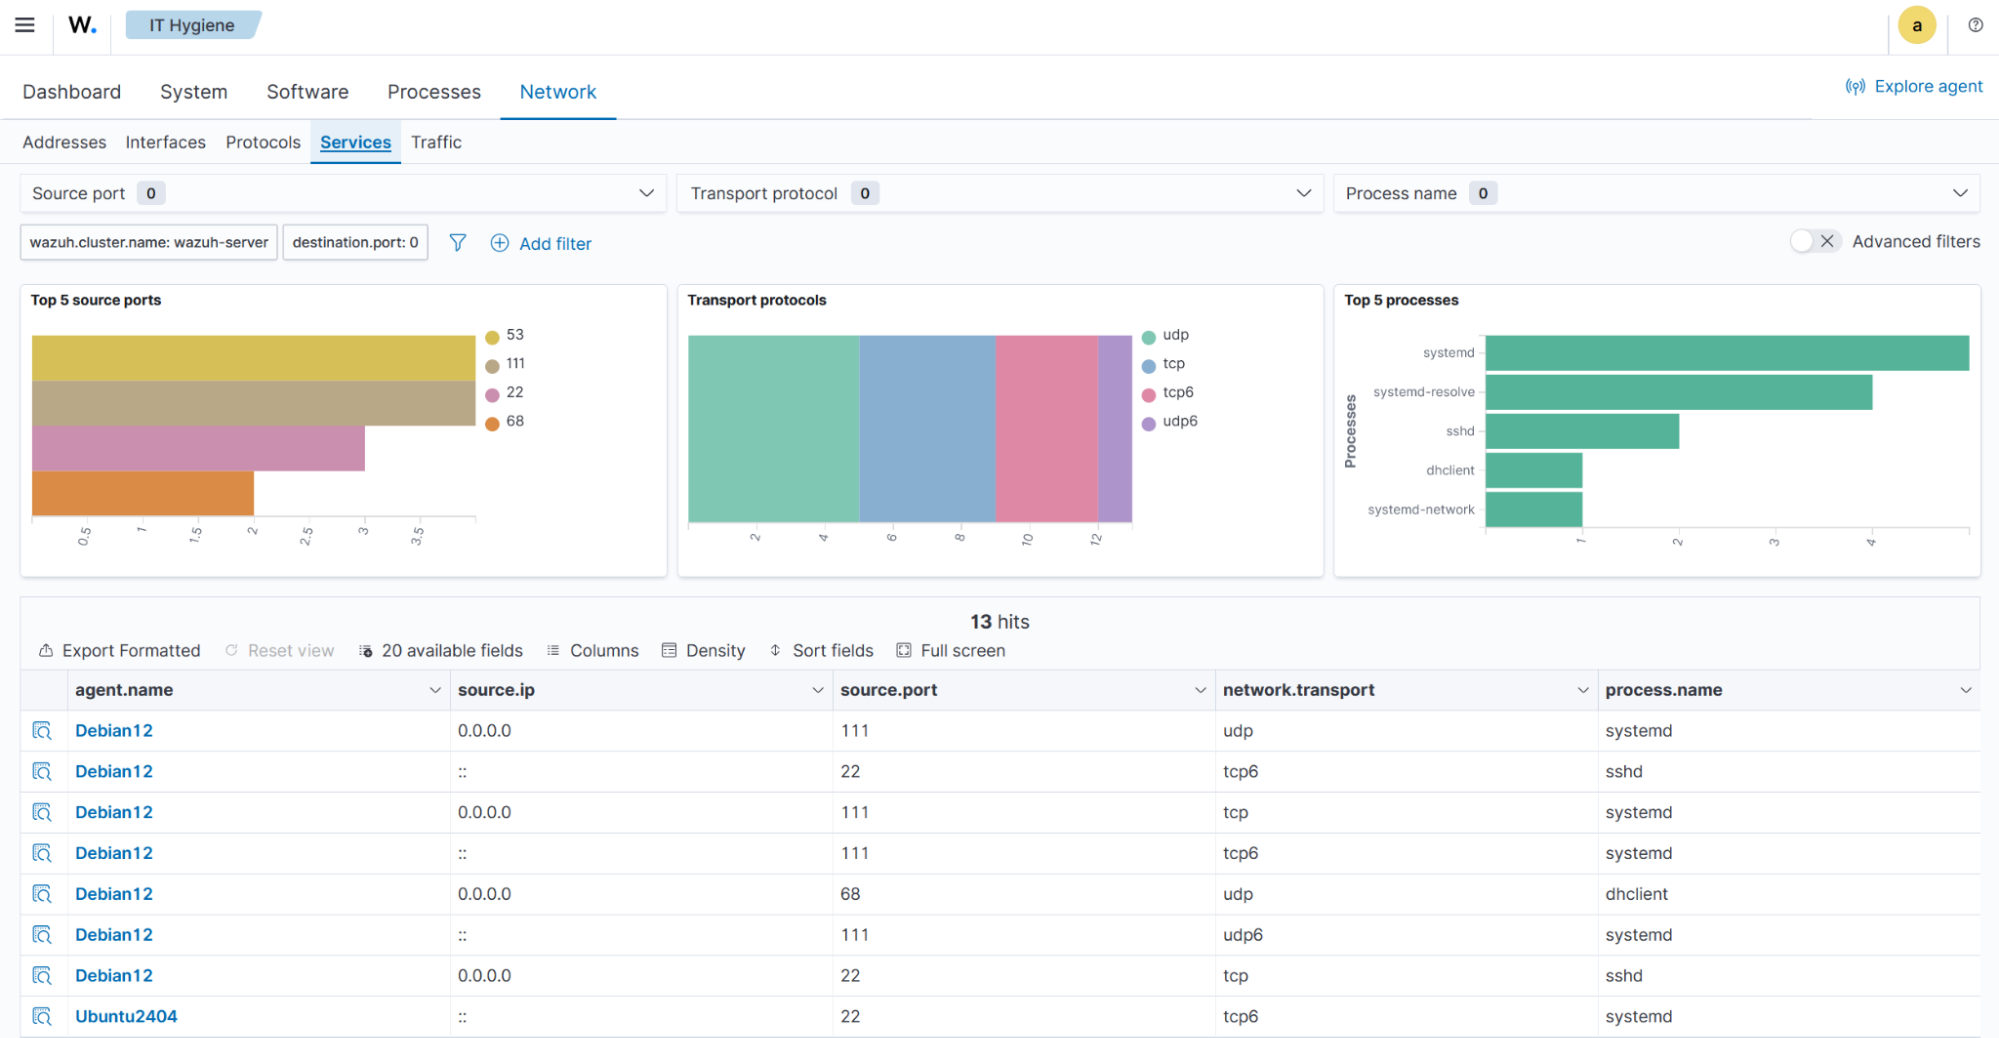
The Services tab presents a detailed view of source ports, transport protocols, processes, and a summary data table for each endpoint.
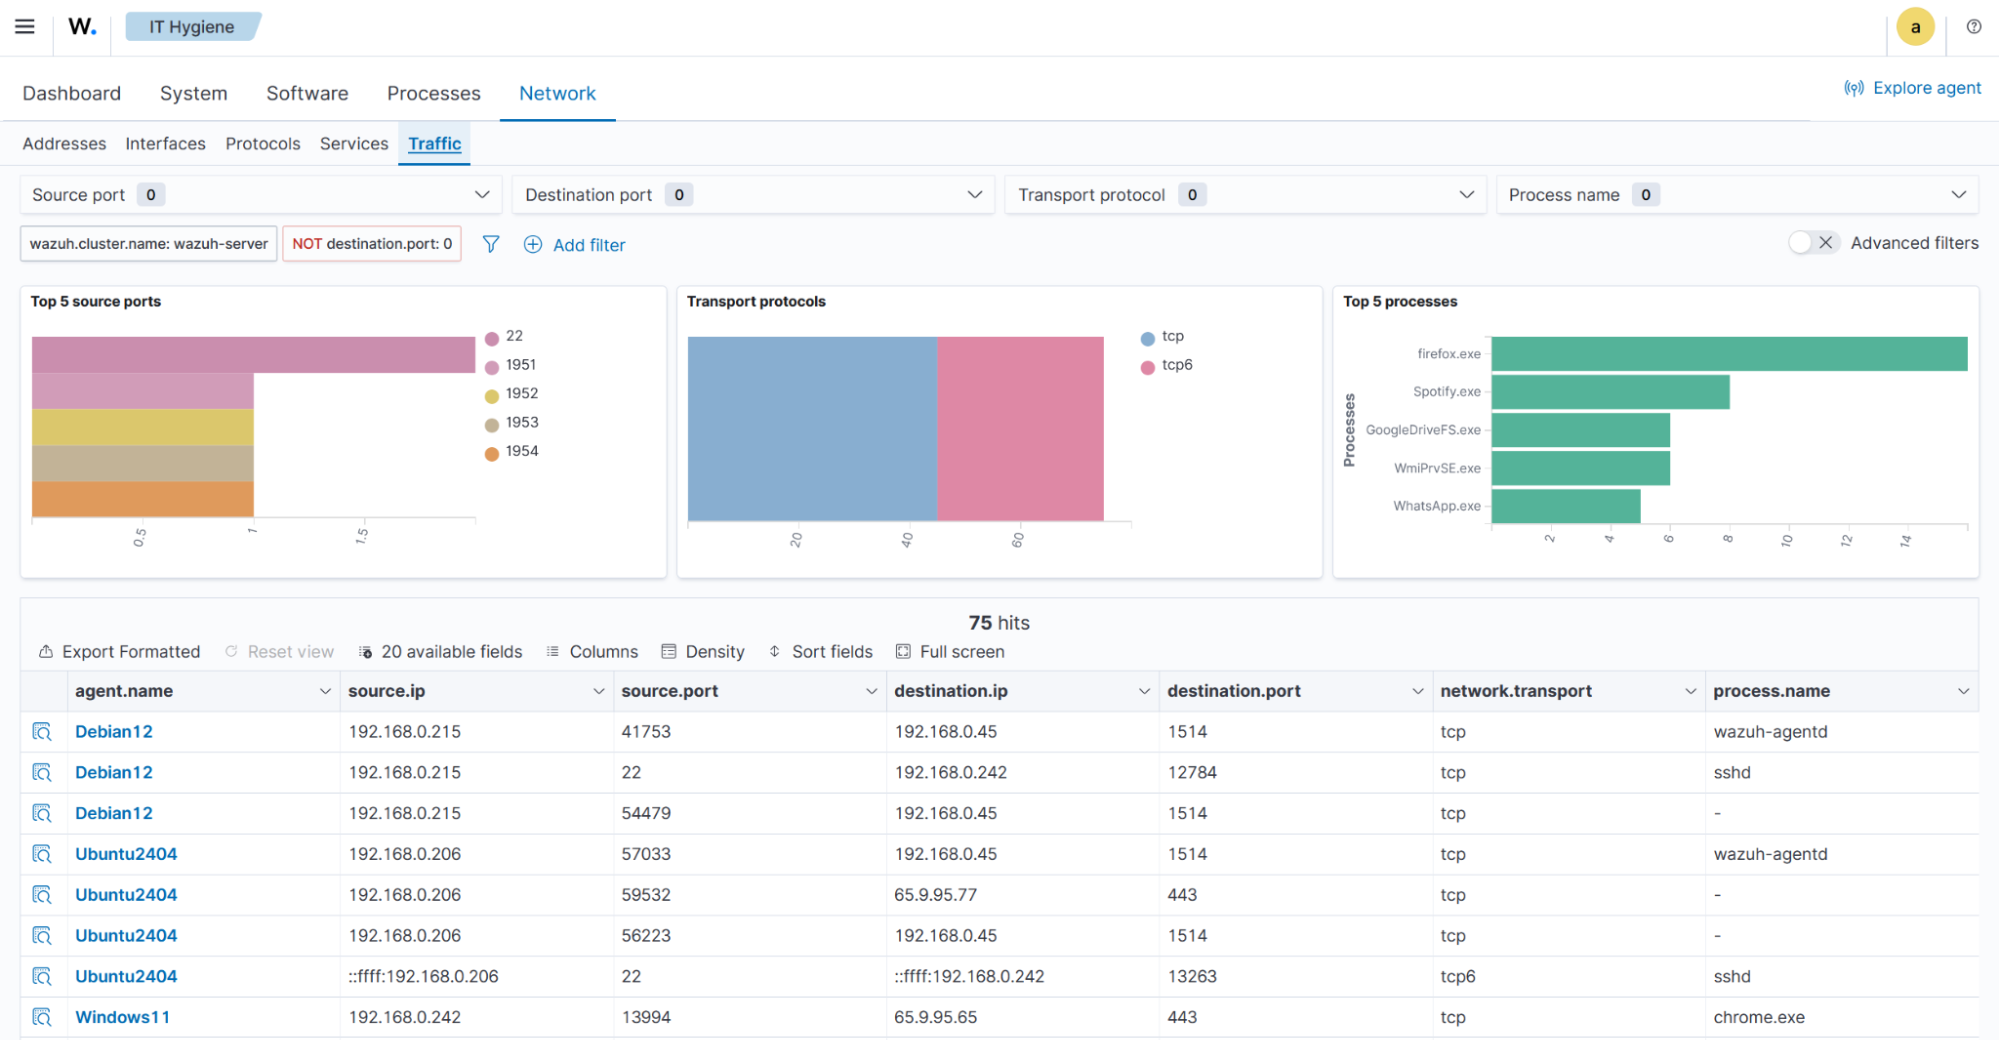
The Traffic tab provides a detailed view of active listening ports, including source ports, destination ports, transport protocols, processes, and a summary data table for each endpoint.
Query the agent inventory data
The Syscollector module runs periodic scans and sends the updated data in JSON format to the Wazuh server. The Wazuh server analyzes and stores this data in a separate database for each endpoint. The databases contain tables that store each type of system information. The system inventory databases on the Wazuh server are then processed and forwarded to the Wazuh indexer, where it is stored as the global state data. You can query the system inventory data for specific information using the Wazuh indexer API, Wazuh server API, or the SQLite tool.
Using the Wazuh indexer API
The Wazuh indexer API enables you to perform actions such as adding new indices, querying existing indices, and modifying the Wazuh indexer settings. It can retrieve system inventory data from global state indices for selected or multiple monitored endpoints and display it in a human‑readable format. You can perform these queries through the Wazuh indexer API interface on the dashboard or by using command‑line tools such as cURL.
Wazuh indexer API GUI
Follow these steps to access the Wazuh indexer API from the Wazuh dashboard.
On the Wazuh dashboard, click the hamburger icon from the top left side and navigate to Indexer management > Dev Tools.
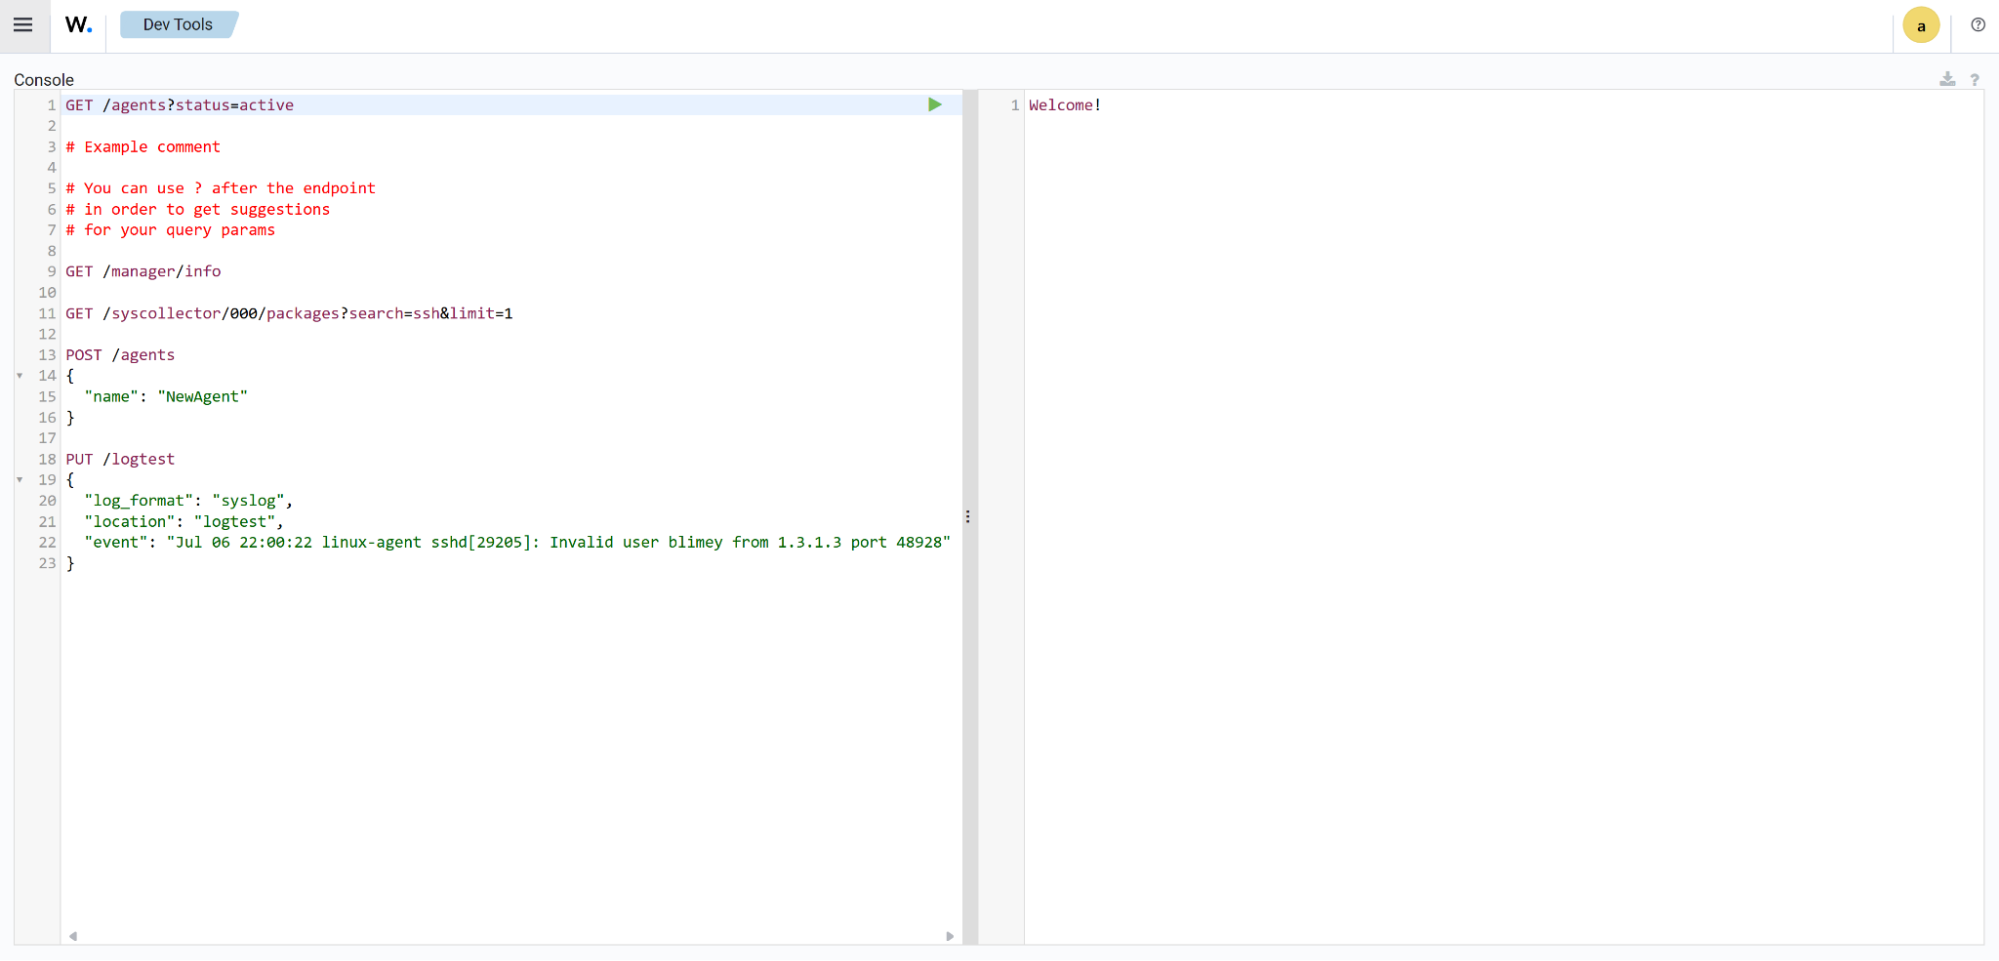
Type the following command in the console and click the play icon to run the query:
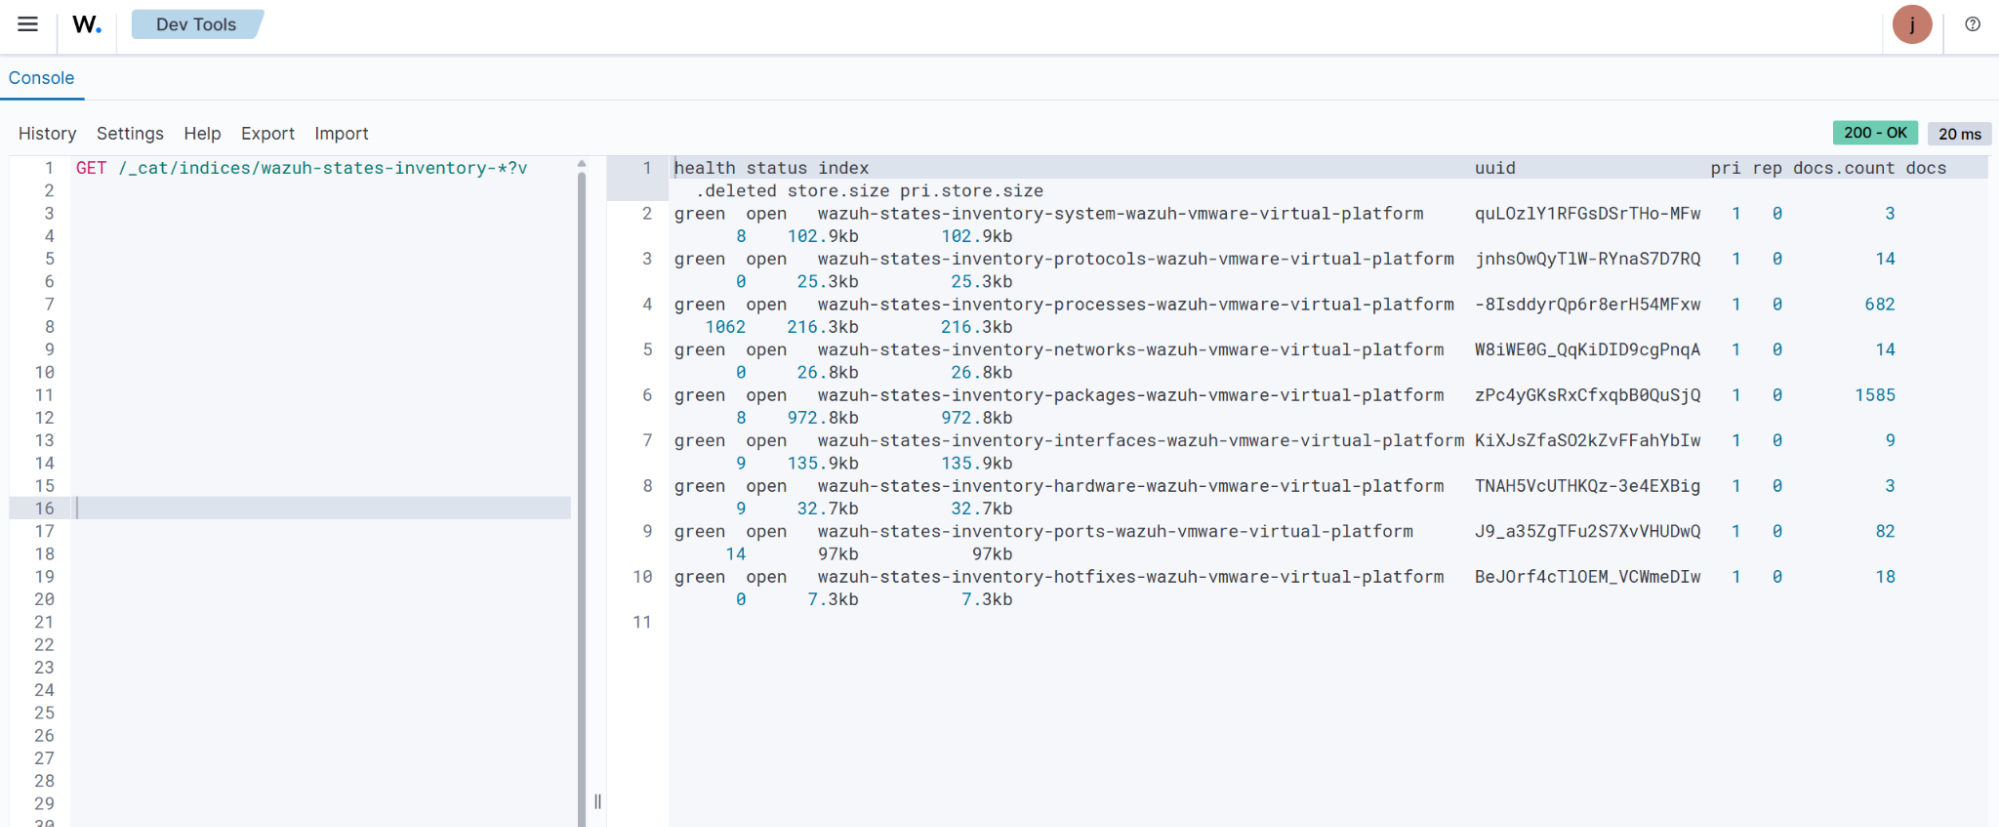
GET /_cat/indices/wazuh-states-inventory-*?v
The command retrieves information about the system inventory indices
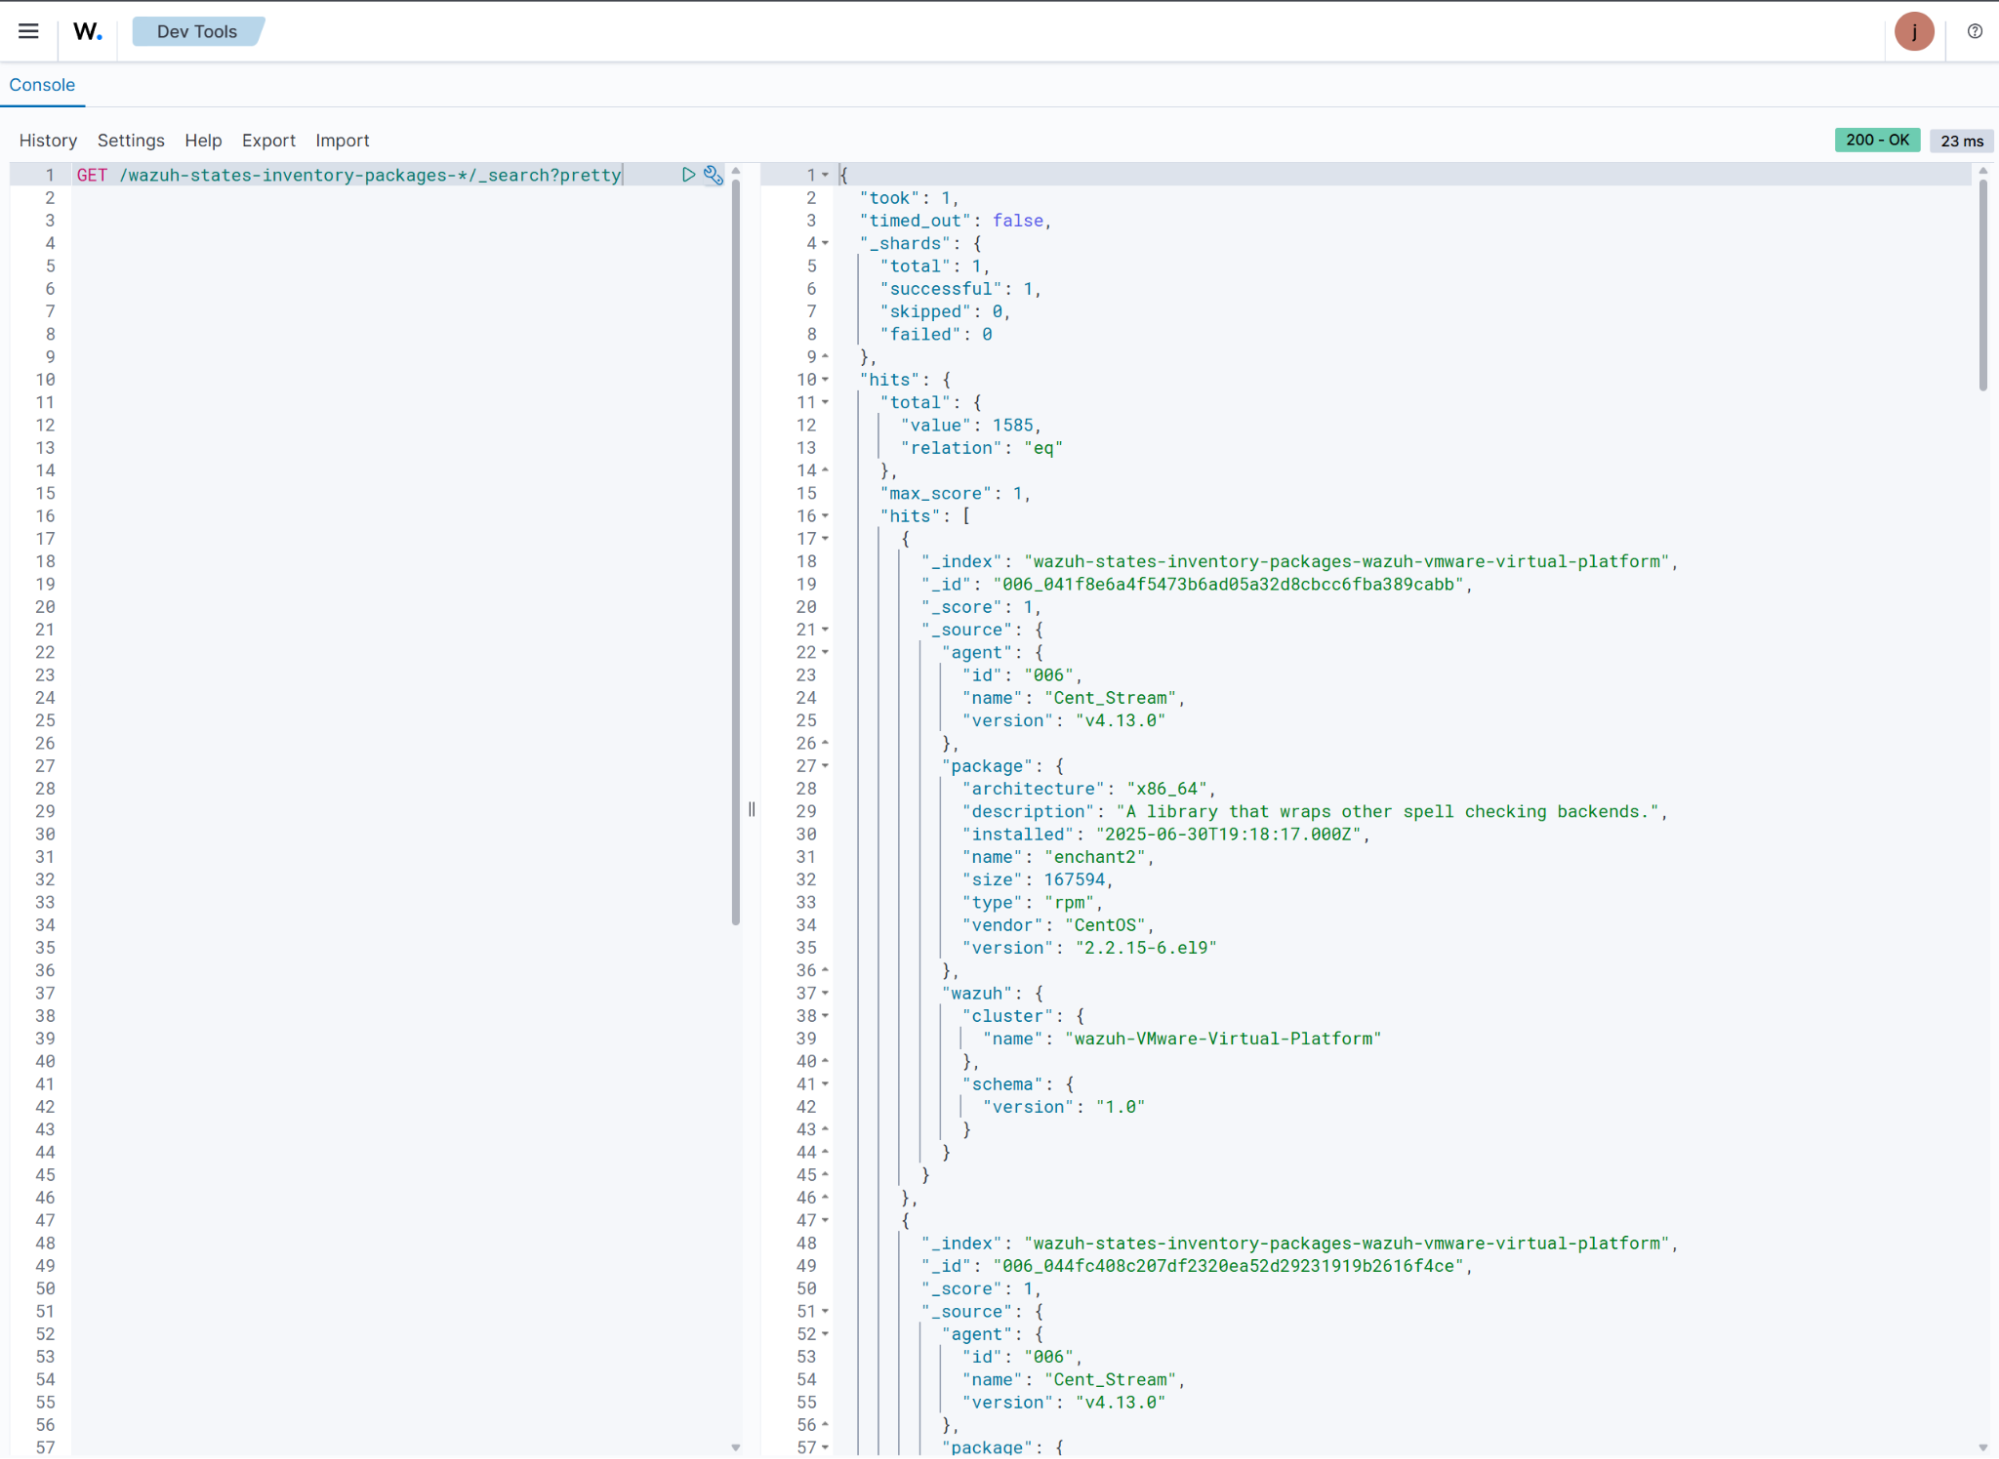
Use the command below to query the system inventory index for installed packages within your infrastructure. After typing, click the play icon to run the query.
GET /wazuh-states-inventory-packages-*/_search?pretty
You can query the system inventory index to look up specific details, such as whether a particular package is installed on any monitored endpoints. For example, the following command checks the package inventory for the presence of the
wazuh-agentpackage.GET /wazuh-states-inventory-packages-*/_search?pretty { "query": { "match": { "package.name": "wazuh-agent" } } }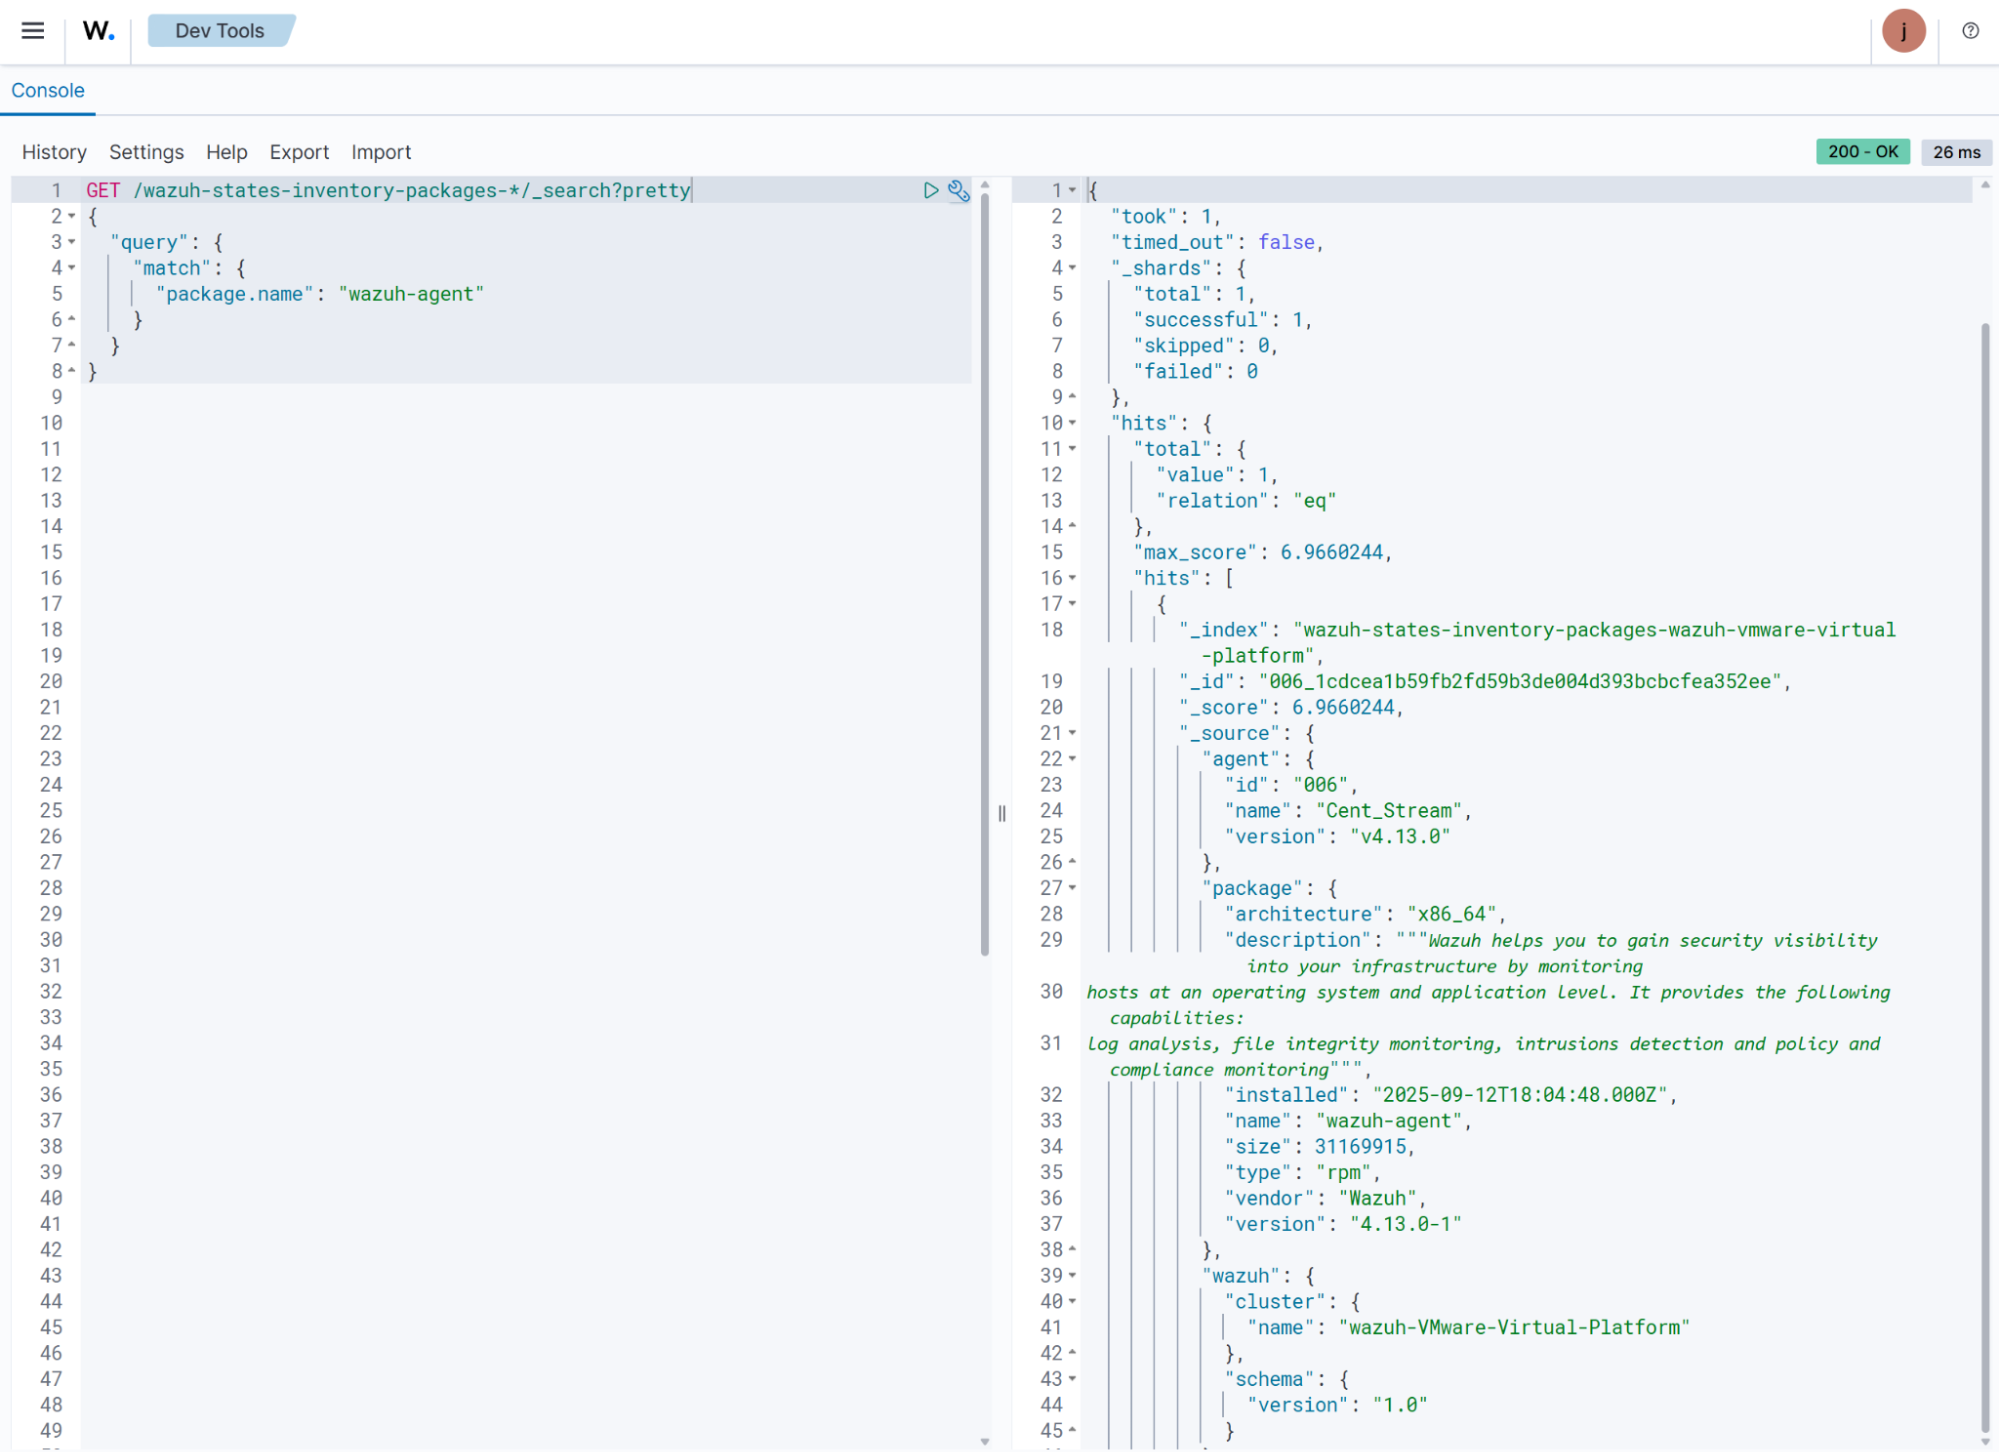
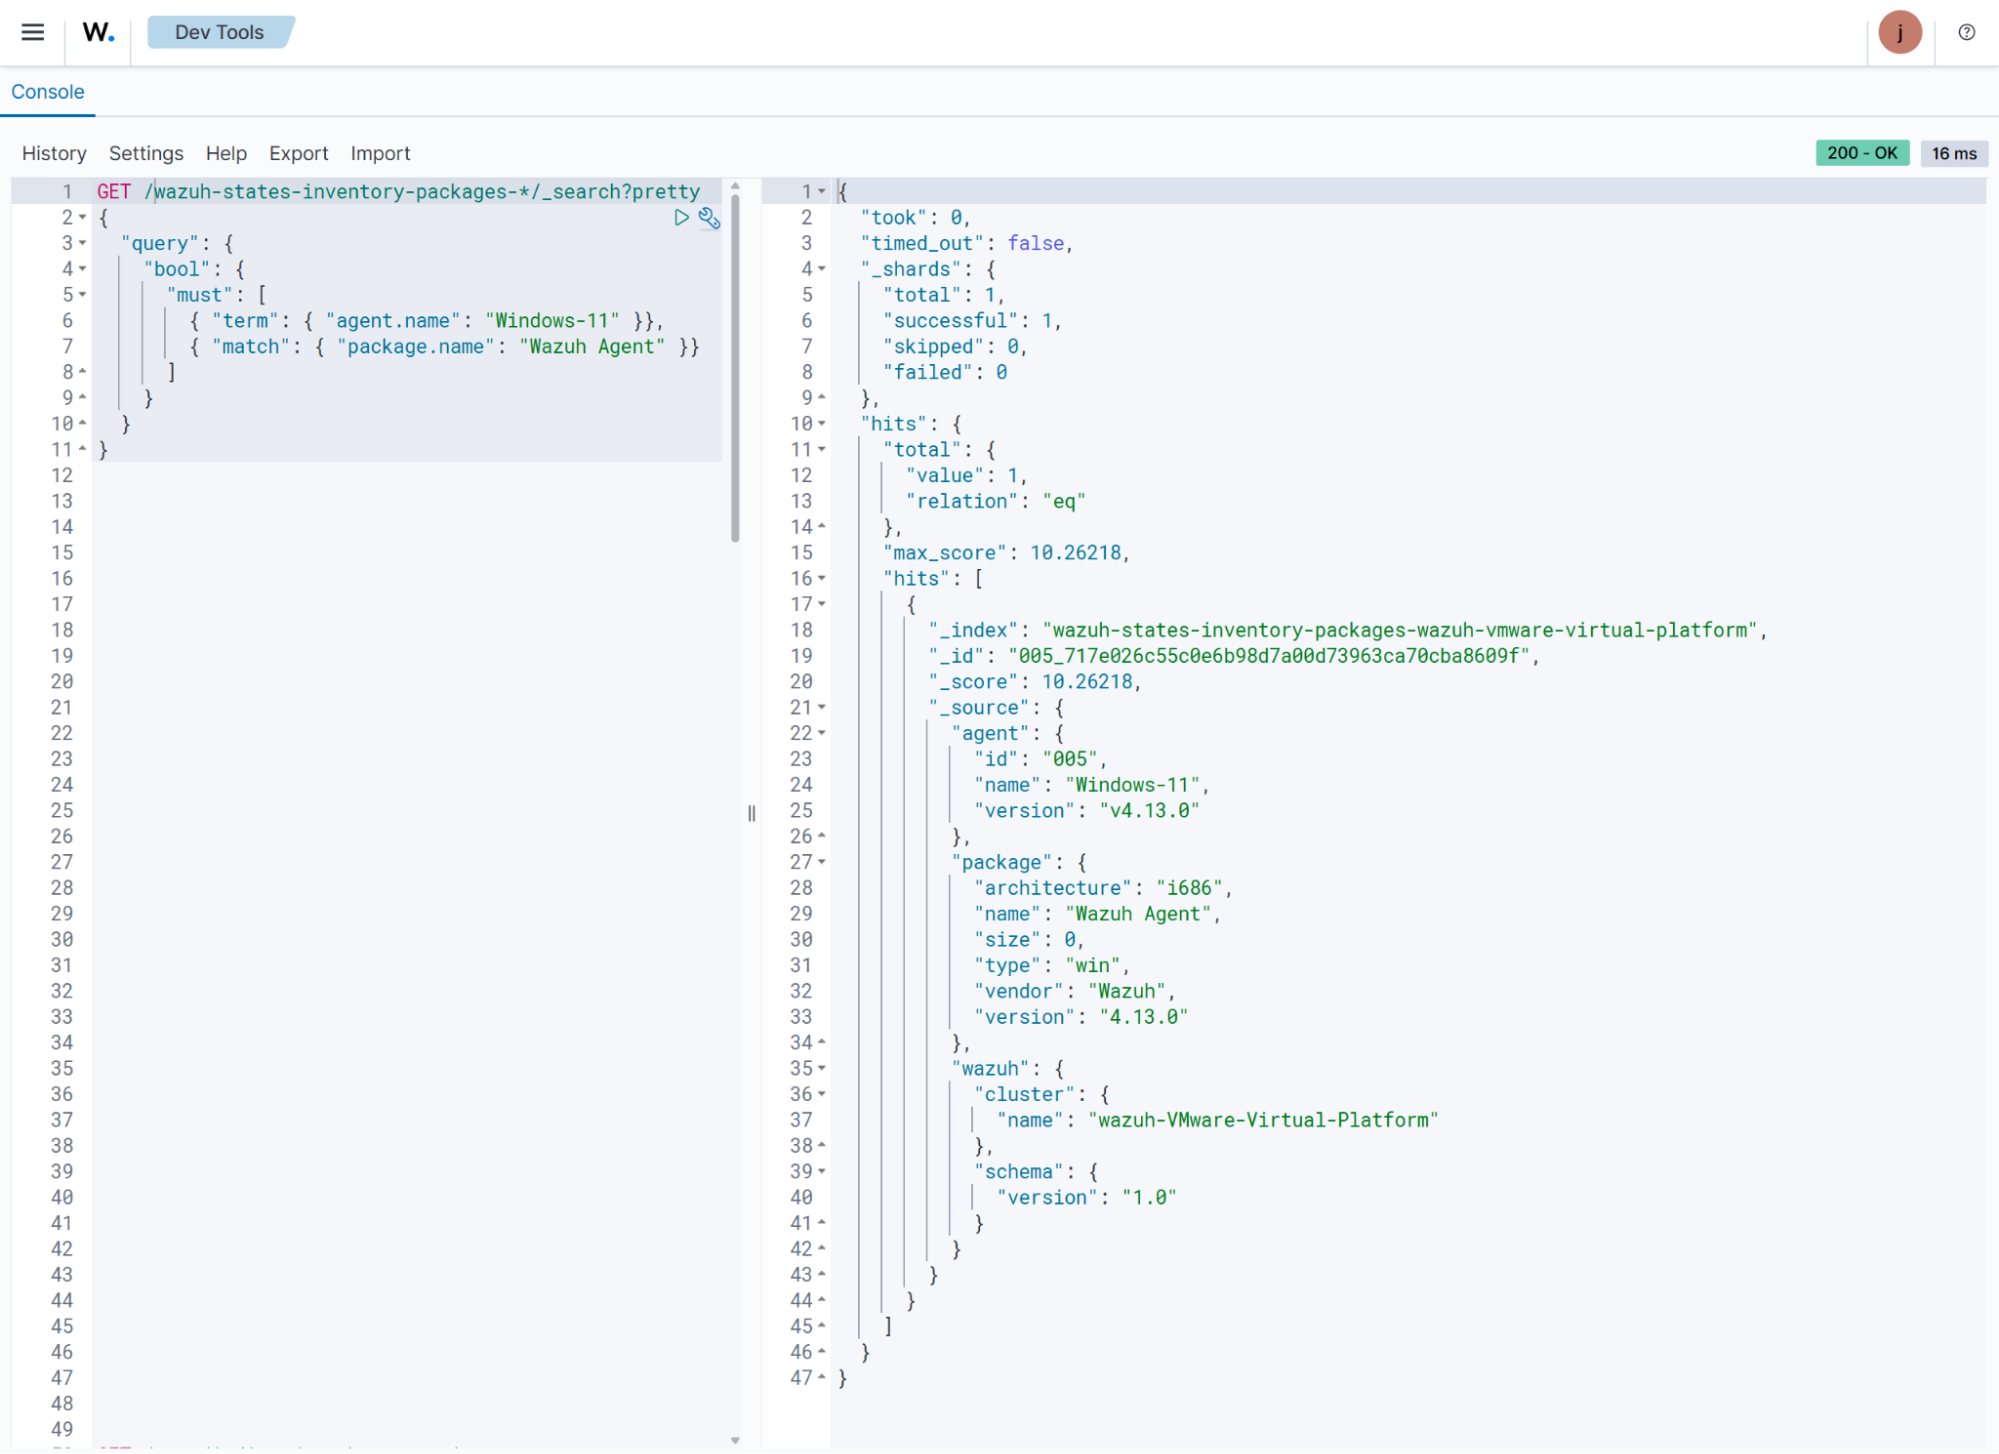
Furthermore, you can check whether a package is installed on a specific endpoint. In the command below, we check if the Wazuh agent is installed on a Windows endpoint. Replace
<AGENT_NAME>with the name of the Wazuh endpoint.GET /wazuh-states-inventory-packages-*/_search?pretty { "query": { "bool": { "must": [ { "term": { "agent.name": "<AGENT_NAME>" }}, { "match": { "package.name": "Wazuh Agent" }} ] } } }
cURL
Follow the steps below to query the system inventory indices from the command line using cURL.
Run the command below to retrieve information about the system inventory indices. Replace
<WAZUH_INDEXER_USERNAME>with the Wazuh indexer username and type the Wazuh indexer password when prompted:# curl -k -u "<WAZUH_INDEXER_USERNAME>" https://<WAZUH_INDEXER_IP>:9200/_cat/indices/wazuh-states-inventory-*?v
health status index                                                           uuid                   pri rep docs.count docs.deleted store.size pri.store.size
green  open   wazuh-states-inventory-system-wazuh-vmware-virtual-platform     quLOzlY1RFGsDSrTHo-MFw   1   0          3            4     61.7kb         61.7kb
green  open   wazuh-states-inventory-protocols-wazuh-vmware-virtual-platform  jnhsOwQyTlW-RYnaS7D7RQ   1   0         14            0     25.3kb         25.3kb
green  open   wazuh-states-inventory-processes-wazuh-vmware-virtual-platform  -8IsddyrQp6r8erH54MFxw   1   0        690          655    253.3kb        253.3kb
green  open   wazuh-states-inventory-networks-wazuh-vmware-virtual-platform   W8iWE0G_QqKiDID9cgPnqA   1   0         14            0     26.8kb         26.8kb
green  open   wazuh-states-inventory-packages-wazuh-vmware-virtual-platform   zPc4yGKsRxCfxqbB0QuSjQ   1   0       1585            8    972.8kb        972.8kb
green  open   wazuh-states-inventory-interfaces-wazuh-vmware-virtual-platform KiXJsZfaSO2kZvFFahYbIw   1   0          9            5     80.2kb         80.2kb
green  open   wazuh-states-inventory-hardware-wazuh-vmware-virtual-platform   TNAH5VcUTHKQz-3e4EXBig   1   0          3            5     76.8kb         76.8kb
green  open   wazuh-states-inventory-ports-wazuh-vmware-virtual-platform      J9_a35ZgTFu2S7XvVHUDwQ   1   0         84           10     99.8kb         99.8kb
green  open   wazuh-states-inventory-hotfixes-wazuh-vmware-virtual-platform   BeJOrf4cTlOEM_VCWmeDIw   1   0         18            0      7.3kb          7.3kb
Use the command below to query the system inventory index for the packages on the endpoints. Replace
<WAZUH_INDEXER_USERNAME>with the Wazuh indexer username and type the Wazuh indexer password when prompted.# curl -k -u "<WAZUH_INDEXER_USERNAME>" https://<WAZUH_INDEXER_IP>:9200/wazuh-states-inventory-packages-*/_search?pretty
{
  "took" : 1,
  "timed_out" : false,
  "_shards" : {
    "total" : 1,
    "successful" : 1,
    "skipped" : 0,
    "failed" : 0
  },
  "hits" : {
    "total" : {
      "value" : 1585,
      "relation" : "eq"
    },
    "max_score" : 1.0,
    "hits" : [
      {
        "_index" : "wazuh-states-inventory-packages-wazuh-vmware-virtual-platform",
        "_id" : "006_041f8e6a4f5473b6ad05a32d8cbcc6fba389cabb",
        "_score" : 1.0,
        "_source" : {
          "agent" : {
            "id" : "006",
            "name" : "Cent_Stream",
            "version" : "v4.13.0"
          },
          "package" : {
            "architecture" : "x86_64",
            "description" : "A library that wraps other spell checking backends.",
            "installed" : "2025-06-30T19:18:17.000Z",
            "name" : "enchant2",
            "size" : 167594,
            "type" : "rpm",
            "vendor" : "CentOS",
            "version" : "2.2.15-6.el9"
          },
          "wazuh" : {
            "cluster" : {
              "name" : "wazuh-VMware-Virtual-Platform"
            },
            "schema" : {
              "version" : "1.0"
            }
          }
        }
      },
      {
        "_index" : "wazuh-states-inventory-packages-wazuh-vmware-virtual-platform",
        "_id" : "006_044fc408c207df2320ea52d29231919b2616f4ce",
        "_score" : 1.0,
        "_source" : {
          "agent" : {
            "id" : "006",
            "name" : "Cent_Stream",
            "version" : "v4.13.0"
          },
          "package" : {
            "architecture" : "x86_64",
            "description" : "The ATK library provides a set of interfaces for adding accessibility\nsupport to applications and graphical user interface toolkits. By\nsupporting the ATK interfaces, an application or toolkit can be used\nwith tools such as screen readers, magnifiers, and alternative input\ndevices.",
            "installed" : "2025-06-30T19:18:17.000Z",
            "name" : "atk",
            "size" : 1304627,
            "type" : "rpm",
            "vendor" : "CentOS",
            "version" : "2.36.0-5.el9"
          },
          "wazuh" : {
            "cluster" : {
              "name" : "wazuh-VMware-Virtual-Platform"
            },
            "schema" : {
              "version" : "1.0"
            }
          }
        }
      },
      {
        "_index" : "wazuh-states-inventory-packages-wazuh-vmware-virtual-platform",
        "_id" : "006_045d1c99dc4f5c48377352432af35e0cd2c2451c",
        "_score" : 1.0,
        "_source" : {
          "agent" : {
            "id" : "006",
            "name" : "Cent_Stream",
            "version" : "v4.13.0"
          },
          "package" : {
            "architecture" : "x86_64",
            "description" : "A backend implementation for xdg-desktop-portal that is using various pieces of\nGNOME infrastructure, such as the org.gnome.Shell.Screenshot or\norg.gnome.SessionManager D-Bus interfaces.",
            "installed" : "2025-06-30T19:31:26.000Z",
            "name" : "xdg-desktop-portal-gnome",
            "size" : 568978,
            "type" : "rpm",
            "vendor" : "CentOS",
            "version" : "41.2-3.el9"
          },
          "wazuh" : {
            "cluster" : {
              "name" : "wazuh-VMware-Virtual-Platform"
            },
            "schema" : {
              "version" : "1.0"
            }
          }
        }
      },
      {
        "_index" : "wazuh-states-inventory-packages-wazuh-vmware-virtual-platform",
        "_id" : "006_0467d452f839f61a318267d502b6c81154316e40",
        "_score" : 1.0,
        "_source" : {
          "agent" : {
            "id" : "006",
            "name" : "Cent_Stream",
            "version" : "v4.13.0"
          },
          "package" : {
            "architecture" : "x86_64",
            "description" : "This package contains the shared library for sqlite.",
            "installed" : "2025-06-30T19:30:06.000Z",
            "name" : "sqlite-libs",
            "size" : 1368872,
            "type" : "rpm",
            "vendor" : "CentOS",
            "version" : "3.34.1-8.el9"
          },
          "wazuh" : {
            "cluster" : {
              "name" : "wazuh-VMware-Virtual-Platform"
            },
            "schema" : {
              "version" : "1.0"
            }
          }
        }
      },
      {
        "_index" : "wazuh-states-inventory-packages-wazuh-vmware-virtual-platform",
        "_id" : "006_0480a23ae60e573ec6b243b3a6068723fda63ee2",
        "_score" : 1.0,
        "_source" : {
          "agent" : {
            "id" : "006",
            "name" : "Cent_Stream",
            "version" : "v4.13.0"
          },
          "package" : {
            "architecture" : "x86_64",
            "description" : "Cheese is a Photobooth-inspired GNOME application for taking pictures and\nvideos from a webcam. It can also apply fancy graphical effects.",
            "installed" : "2025-06-30T19:19:07.000Z",
            "name" : "cheese",
            "size" : 378533,
            "type" : "rpm",
            "vendor" : "CentOS",
            "version" : "2:3.38.0-6.el9"
          },
          "wazuh" : {
            "cluster" : {
              "name" : "wazuh-VMware-Virtual-Platform"
            },
            "schema" : {
              "version" : "1.0"
            }
          }
        }
      },
      {
        "_index" : "wazuh-states-inventory-packages-wazuh-vmware-virtual-platform",
        "_id" : "006_048923b45c38753ce27dc4346d16612a6e9fa6bc",
        "_score" : 1.0,
        "_source" : {
          "agent" : {
            "id" : "006",
            "name" : "Cent_Stream",
            "version" : "v4.13.0"
          },
          "package" : {
            "architecture" : "x86_64",
            "description" : "The filesystem package is one of the basic packages that is installed\non a Linux system. Filesystem contains the basic directory layout\nfor a Linux operating system, including the correct permissions for\nthe directories.",
            "installed" : "2025-06-30T19:30:05.000Z",
            "name" : "filesystem",
            "size" : 106,
            "type" : "rpm",
            "vendor" : "CentOS",
            "version" : "3.16-5.el9"
          },
          "wazuh" : {
            "cluster" : {
              "name" : "wazuh-VMware-Virtual-Platform"
            },
            "schema" : {
              "version" : "1.0"
            }
          }
        }
      },
      {
        "_index" : "wazuh-states-inventory-packages-wazuh-vmware-virtual-platform",
        "_id" : "006_04c8813e7928463fee47e0006c90e16e5d924ca6",
        "_score" : 1.0,
        "_source" : {
          "agent" : {
            "id" : "006",
            "name" : "Cent_Stream",
            "version" : "v4.13.0"
          },
          "package" : {
            "architecture" : "x86_64",
            "description" : "The POSIX module permits you to access all (or nearly all) the standard POSIX\n1003.1 identifiers. Many of these identifiers have been given Perl interfaces.",
            "installed" : "2025-07-17T14:42:06.000Z",
            "name" : "perl-POSIX",
            "size" : 240020,
            "type" : "rpm",
            "vendor" : "CentOS",
            "version" : "1.94-483.el9"
          },
          "wazuh" : {
            "cluster" : {
              "name" : "wazuh-VMware-Virtual-Platform"
            },
            "schema" : {
              "version" : "1.0"
            }
          }
        }
      },
      {
        "_index" : "wazuh-states-inventory-packages-wazuh-vmware-virtual-platform",
        "_id" : "006_0507d1d203a41466eddaf4e8ea773427f6137e4b",
        "_score" : 1.0,
        "_source" : {
          "agent" : {
            "id" : "006",
            "name" : "Cent_Stream",
            "version" : "v4.13.0"
          },
          "package" : {
            "architecture" : "x86_64",
            "description" : "A library to handle bidirectional scripts (for example Hebrew, Arabic),\nso that the display is done in the proper way; while the text data itself\nis always written in logical order.",
            "installed" : "2025-06-30T19:18:13.000Z",
            "name" : "fribidi",
            "size" : 347380,
            "type" : "rpm",
            "vendor" : "CentOS",
            "version" : "1.0.10-6.el9.2"
          },
          "wazuh" : {
            "cluster" : {
              "name" : "wazuh-VMware-Virtual-Platform"
            },
            "schema" : {
              "version" : "1.0"
            }
          }
        }
      },
      {
        "_index" : "wazuh-states-inventory-packages-wazuh-vmware-virtual-platform",
        "_id" : "006_050946eb0960e99615ecf95988f96aa67b278099",
        "_score" : 1.0,
        "_source" : {
          "agent" : {
            "id" : "006",
            "name" : "Cent_Stream",
            "version" : "v4.13.0"
          },
          "package" : {
            "architecture" : "x86_64",
            "description" : "lxml is a Pythonic, mature binding for the libxml2 and libxslt libraries. It\nprovides safe and convenient access to these libraries using the ElementTree It\nextends the ElementTree API significantly to offer support for XPath, RelaxNG,\nXML Schema, XSLT, C14N and much more.To contact the project, go to the project\nhome page < or see our bug tracker at case you want to use the current ...\n\nPython 3 version.",
            "installed" : "2025-06-30T19:18:20.000Z",
            "name" : "python3-lxml",
            "size" : 4351883,
            "type" : "rpm",
            "vendor" : "CentOS",
            "version" : "4.6.5-3.el9"
          },
          "wazuh" : {
            "cluster" : {
              "name" : "wazuh-VMware-Virtual-Platform"
            },
            "schema" : {
              "version" : "1.0"
            }
          }
        }
      },
      {
        "_index" : "wazuh-states-inventory-packages-wazuh-vmware-virtual-platform",
        "_id" : "006_054268e7568db7e74481fec3f76cabba9612d810",
        "_score" : 1.0,
        "_source" : {
          "agent" : {
            "id" : "006",
            "name" : "Cent_Stream",
            "version" : "v4.13.0"
          },
          "package" : {
            "architecture" : "noarch",
            "description" : "Python3 bindings for firewalld.",
            "installed" : "2025-06-30T19:30:16.000Z",
            "name" : "python3-firewall",
            "size" : 2193288,
            "type" : "rpm",
            "vendor" : "CentOS",
            "version" : "1.3.4-9.el9"
          },
          "wazuh" : {
            "cluster" : {
              "name" : "wazuh-VMware-Virtual-Platform"
            },
            "schema" : {
              "version" : "1.0"
            }
          }
        }
      }
    ]
  }
}
You can query the system inventory index to look up specific details, such as whether a particular package is installed on any monitored endpoints. For example, the following command checks the package inventory for the presence of the
wazuh-agentpackage. Replace<WAZUH_INDEXER_USERNAME>with the Wazuh indexer username and type the Wazuh indexer password when prompted:curl -k -u "<WAZUH_INDEXER_USERNAME>" "https://<WAZUH_INDEXER_IP>:9200/wazuh-states-inventory-packages-*/_search?pretty" \ -H 'Content-Type: application/json' \ -d '{ "query": { "term": { "package.name": "wazuh-agent" } } }'
{
  "took" : 1,
  "timed_out" : false,
  "_shards" : {
    "total" : 1,
    "successful" : 1,
    "skipped" : 0,
    "failed" : 0
  },
  "hits" : {
    "total" : {
      "value" : 1,
      "relation" : "eq"
    },
    "max_score" : 6.9660244,
    "hits" : [
      {
        "_index" : "wazuh-states-inventory-packages-wazuh-vmware-virtual-platform",
        "_id" : "006_1cdcea1b59fb2fd59b3de004d393bcbcfea352ee",
        "_score" : 6.9660244,
        "_source" : {
          "agent" : {
            "id" : "006",
            "name" : "Cent_Stream",
            "version" : "v4.13.0"
          },
          "package" : {
            "architecture" : "x86_64",
            "description" : "Wazuh helps you to gain security visibility into your infrastructure by monitoring\nhosts at an operating system and application level. It provides the following capabilities:\nlog analysis, file integrity monitoring, intrusions detection and policy and compliance monitoring",
            "installed" : "2025-09-12T18:04:48.000Z",
            "name" : "wazuh-agent",
            "size" : 31169915,
            "type" : "rpm",
            "vendor" : "Wazuh",
            "version" : "4.13.0-1"
          },
          "wazuh" : {
            "cluster" : {
              "name" : "wazuh-VMware-Virtual-Platform"
            },
            "schema" : {
              "version" : "1.0"
            }
          }
        }
      }
    ]
  }
}
Furthermore, you can check whether a package is installed on a specific endpoint. In the command below, we check if the Wazuh agent is installed on a Windows endpoint. Replace
<WAZUH_INDEXER_USERNAME>with the Wazuh indexer username,<AGENT_NAME>with the name of the Wazuh endpoint, and type the Wazuh indexer password when prompted.curl -k -u "<WAZUH_INDEXER_USERNAME>" "https://<WAZUH_INDEXER_IP>:9200/wazuh-states-inventory-packages-*/_search?pretty" \ -H 'Content-Type: application/json' \ -d '{ "query": { "bool": { "must": [ { "term": { "agent.name": "Windows-11" }}, { "match": { "package.name": "Wazuh Agent" }} ] } } }'
{
  "took" : 2,
  "timed_out" : false,
  "_shards" : {
    "total" : 1,
    "successful" : 1,
    "skipped" : 0,
    "failed" : 0
  },
  "hits" : {
    "total" : {
      "value" : 1,
      "relation" : "eq"
    },
    "max_score" : 10.26218,
    "hits" : [
      {
        "_index" : "wazuh-states-inventory-packages-wazuh-vmware-virtual-platform",
        "_id" : "005_717e026c55c0e6b98d7a00d73963ca70cba8609f",
        "_score" : 10.26218,
        "_source" : {
          "agent" : {
            "id" : "005",
            "name" : "Windows-11",
            "version" : "v4.13.0"
          },
          "package" : {
            "architecture" : "i686",
            "name" : "Wazuh Agent",
            "size" : 0,
            "type" : "win",
            "vendor" : "Wazuh",
            "version" : "4.13.0"
          },
          "wazuh" : {
            "cluster" : {
              "name" : "wazuh-VMware-Virtual-Platform"
            },
            "schema" : {
              "version" : "1.0"
            }
          }
        }
      }
    ]
  }
}
Using the Wazuh server API
You can query the Wazuh inventory data using the Wazuh server API, which retrieves nested data in JSON format. You can use the Wazuh server API GUI on the dashboard or a command-line tool like cURL to query the inventory database of a Wazuh agent.
Wazuh server API GUI
On the Wazuh dashboard, navigate to Wazuh > Tools > API Console. On the Console, type the following:
GET /syscollector/<AGENT_ID>/
Where <AGENT_ID> corresponds to the agent ID of the endpoint.
The Wazuh dashboard will suggest a list of available tables that you can query via the API.
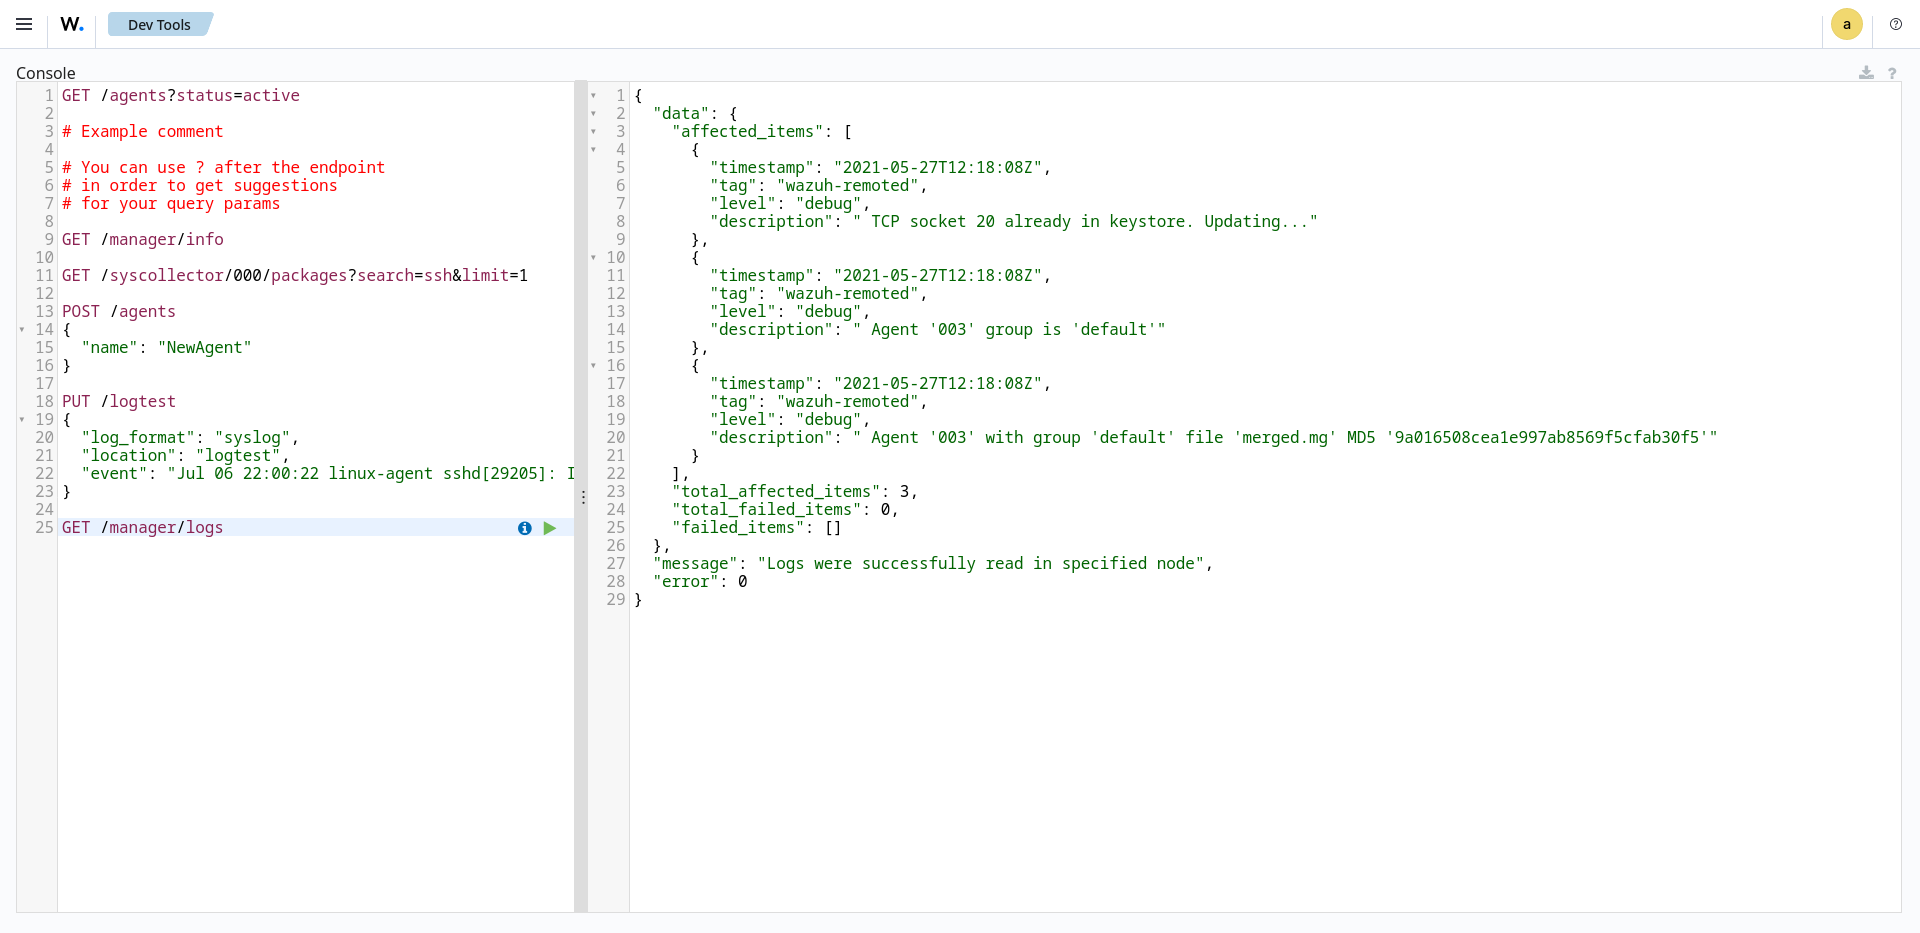
For example, you can use the command GET /syscollector/<AGENT_ID>/packages to query the inventory data for installed packages on the endpoint. After typing, click the play icon to run the query.
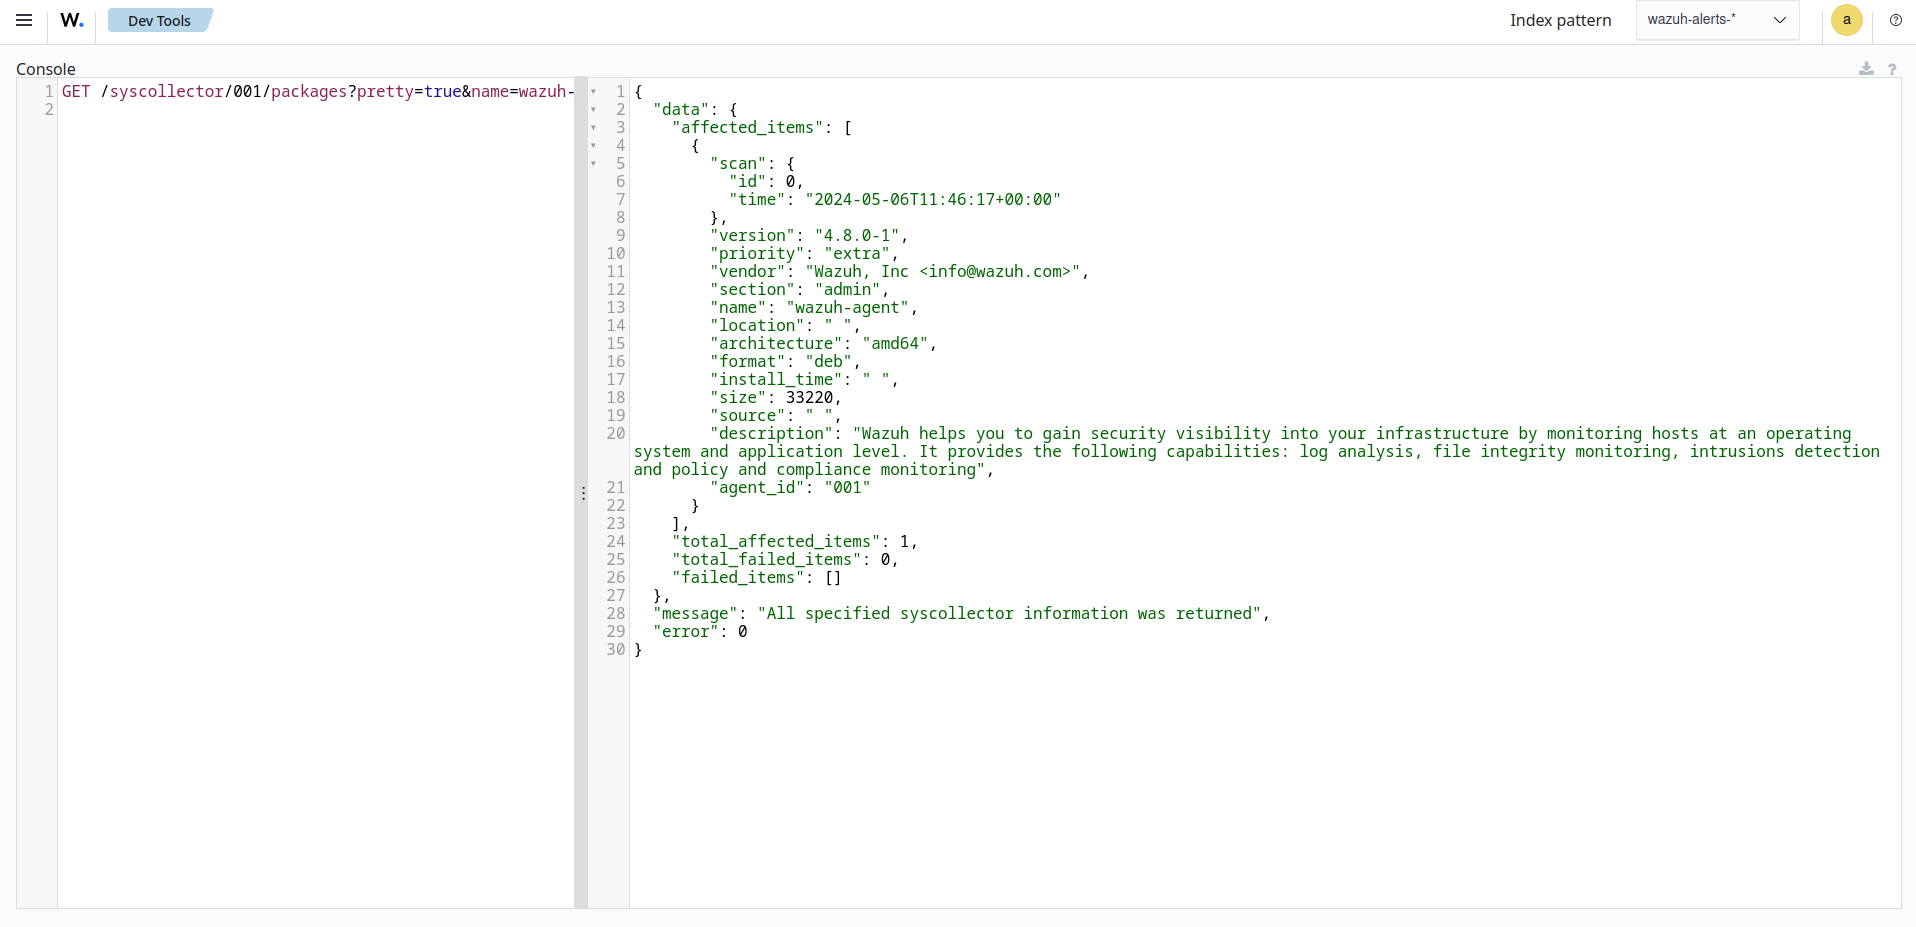
Furthermore, you can query the inventory data for specific information about any property. For example, the command below queries the package inventory to check for the wazuh-agent package:
GET /syscollector/<AGENT_ID>/packages?pretty=true&name=wazuh-agent
Where:
packagesreference the package table in the inventory database, which stores information about the currently installed software on an endpoint. You can reference the table of your interest.name=wazuh-agentspecifies thewazuh-agentpackage name. You can use different properties and values.pretty=trueensures the output is properly formatted and easy to read.
cURL
Follow the steps below to query the system inventory indices from the command line using cURL:
Generate a JSON Web Token (JWT) for authenticating to the Wazuh server by running the following command. Enter the Wazuh server API password when prompted:
TOKEN=$(curl -u <USER> -k -X GET "https://<WAZUH_SERVER_IP>:55000/security/user/authenticate?raw=true")Where:
<USER>is the Wazuh server API username. The default username iswazuh.<WAZUH_SERVER_IP>is the Wazuh server IP address.
Run the command
echo $TOKENto confirm that you successfully generated the token. The output should be like this:eyJhbGciOiJFUzUxMiIsInR5cCI6IkpXVCJ9.eyJpc3MiOiJ3YXp1aCIsImF1ZCI6IldhenVoIEFQSSBSRVNUIiwibmJmIjoxNjQzMDExMjQ0LCJleHAiOjE2NDMwMTIxNDQsInN1YiI6IndhenVoIiwicnVuX2FzIjpmYWxzZSwicmJhY19yb2xlcyI6WzFdLCJyYmFjX21vZGUiOiJ3aGl0ZSJ9.Ad6zOZvx0BEV7K0J6s3pIXAXTWB-zdVfxaX2fotLfZMQkiYPMkwDaQHUFiOInsWJ_7KZV3y2BbhEs9-kBqlJAMvMAD0NDBPhEQ2qBd_iutZ7QWZECd6eYfIP83xGqH9iqS7uMI6fXOKr3w4aFV13Q6qsHSUQ1A-1LgDnnDGGaqF5ITYoQuery the endpoint information of interest using a command which takes the following format:
curl -k -X GET "https://<WAZUH_SERVER_IP>:55000/syscollector/<AGENT_ID>/<SYSCOLLECTOR_PROPERTY>?pretty=true" -H "Authorization: Bearer $TOKEN"For example, to retrieve information about the applications installed on an endpoint with agent ID of
010, the command will be:curl -k -X GET "https://<WAZUH_SERVER_IP>:55000/syscollector/010/packages?pretty=true" -H "Authorization: Bearer $TOKEN"The other inventory properties are
hardware,hotfixes,netaddr,netiface,netproto,os,ports, andprocesses. These all correspond to the tables in the inventory database. You can learn more about these options in our API documentation.{ "data": { "affected_items": [ { "scan": { "id": 0, "time": "2022-09-27T09:16:45+00:00" }, "priority": "optional", "multiarch": "foreign", "format": "deb", "vendor": "Ubuntu Developers <ubuntu-devel-discuss@lists.ubuntu.com>", "size": 12219, "version": "0.4.9-2", "description": "encoding data for the poppler PDF rendering library", "section": "misc", "name": "poppler-data", "architecture": "all", "agent_id": "010" }, { "scan": { "id": 0, "time": "2022-09-27T09:16:45+00:00" }, "priority": "optional", "multiarch": "foreign", "format": "deb", "vendor": "Ubuntu Developers <ubuntu-devel-discuss@lists.ubuntu.com>", "size": 31, "version": "3.20-4", "description": "data tables pertaining to HTML", "section": "perl", "name": "libhtml-tagset-perl", "architecture": "all", "agent_id": "010" }, { "scan": { "id": 0, "time": "2022-09-27T09:16:45+00:00" }, "priority": "optional", "multiarch": "same", "format": "deb", "vendor": "Ubuntu Developers <ubuntu-devel-discuss@lists.ubuntu.com>", "size": 426, "version": "1.17-6ubuntu4.1", "description": "MIT Kerberos runtime libraries - krb5 GSS-API Mechanism", "section": "libs", "source": "krb5", "name": "libgssapi-krb5-2", "architecture": "amd64", "agent_id": "010" }, …
Furthermore, you can query the inventory data to find specific information about any property. For example, the command below queries the package inventory to check if the
wazuh-agentpackage is present.curl -k -X GET "https://<WAZUH_SERVER_IP>:55000/syscollector/001/packages?pretty=true&name=wazuh-agent" -H "Authorization: Bearer $TOKEN"{ "data": { "affected_items": [ { "scan": { "id": 0, "time": "2025-08-18T16:50:06+00:00" }, "name": "wazuh-agent", "section": "System Environment/Daemons", "architecture": "x86_64", "description": "Wazuh helps you to gain security visibility into your infrastructure by monitoring\nhosts at an operating system and application level. It provides the following capabilities:\nlog analysis, file integrity monitoring, intrusions detection and policy and compliance monitoring", "location": " ", "source": " ", "format": "rpm", "install_time": "1755535740", "version": "4.12.0-1", "size": 30461944, "priority": " ", "vendor": "Wazuh, Inc <info@wazuh.com>", "agent_id": "001" } ], "total_affected_items": 1, "total_failed_items": 0, "failed_items": [] }, "message": "All specified syscollector information was returned", "error": 0 }
Using SQLite
The location of the database for each monitored endpoint is on the Wazuh server at /var/ossec/queue/db/. You can query each database directly. To connect to the database of an endpoint, use the command below:
$ sqlite3 /var/ossec/queue/db/<AGENT_ID>.db
Where <AGENT_ID> corresponds to the agent ID of the monitored endpoint.
SQLite version 3.7.17 2013-05-20 00:56:22
Enter ".help" for instructions
Enter SQL statements terminated with a ";"
sqlite>
After connecting to the database, you can query the list of tables in it using the command below:
sqlite>.tables
ciscat_results        sca_scan_info         sys_osinfo
fim_entry             scan_info             sys_ports
metadata              sync_info             sys_processes
pm_event              sys_hotfixes          sys_programs
sca_check             sys_hwinfo
sca_check_compliance  sys_netaddr
sca_check_rules       sys_netiface
sca_policy            sys_netproto
You can further query the tables for any information you are interested in. For example, if you want to know if a particular software is present on an endpoint, you can query the sys_programs table using sqlite>select * from sys_programs where name="<SOFTWARE_NAME>";. The command below checks whether the wazuh-agent program is present on a monitored Linux endpoint and shows the captured details:
sqlite>select * from sys_programs where name="wazuh-agent";
0|2023/01/06 13:48:56|rpm|wazuh-agent||System Environment/Daemons|25988677|Wazuh, Inc <info@wazuh.com>|1673012221|4.3.10-1|x86_64|||Wazuh helps you to gain security visibility into your infrastructure by monitoring hosts at an operating system and application level. It provides the following capabilities: log analysis, file integrity monitoring, intrusions detection and policy and compliance monitoring||1|||1cf5a056a0ff5b6201939eba76ef68f6d860af36|5747279dac052d61c6d3ec87b475edddb84e9dd1