Troubleshooting
This section collects common installation or usage issues on the Wazuh Kibana plugin, and some basic steps to solve them.
"Incorrect Kibana version in plugin [wazuh]" when installing the Wazuh Kibana plugin
To install the Wazuh Kibana plugin successfully, it needs to be compatible with the Kibana and Wazuh versions.
Kibana version can be checked by executing the following command:
# cat /usr/share/kibana/package.json | grep version
An example output of the command looks as follows:
"version": "7.10.2",
The Wazuh version can be checked by executing the following command:
# cat /var/ossec/etc/ossec-init.conf | grep VERSION
An example output of the command looks as follows:
VERSION="v4.1.1"
Using the Kibana version and the Wazuh version, you can find the correct plugin in compatibility matrix.
No template found for the selected index pattern
Elasticsearch needs a specific template to store Wazuh alerts, otherwise visualizations won't load properly. You can insert the correct template using the following command:
# curl https://raw.githubusercontent.com/wazuh/wazuh/v4.1.5/extensions/elasticsearch/7.x/wazuh-template.json | curl -X PUT "https://localhost:9200/_template/wazuh" -H 'Content-Type: application/json' -d @- -u <elasticsearch_user>:<elasticsearch_password> -k
{"acknowledged":true}
If this error occurs after an upgrade from a 3.x version the solution is to remove the wazuh-alerts-3.x-* index pattern. Since Wazuh 4.x, the index pattern is wazuh-alerts-*, and you need to remove the old pattern for the new one to take its place.
# curl 'https://<kibana_ip>:<kibana_port>/api/saved_objects/index-pattern/wazuh-alerts-3.x-*' -X DELETE -H 'Content-Type: application/json' -H 'kbn-version: 7.10.2' -k -u <elasticsearch_user>:<elasticsearch_password>
If you have a custom index pattern, make sure to replace it accordingly.
Very important: Clean the browser’s cache and cookies.
Wazuh API seems to be down
This issue means that your Wazuh API might be unavailable. Check the status of the Wazuh manager to check if the service is active:
# systemctl status wazuh-manager
# service wazuh-manager status
If the Wazuh API is running, try to fetch data using the CLI from the Kibana server:
# curl -k -X GET "https://<api_url>:55000/" -H "Authorization: Bearer $(curl -u <api_user>:<api_password> -k -X GET 'https://<api_url>:55000/security/user/authenticate?raw=true')"
  % Total    % Received % Xferd  Average Speed   Time    Time     Time  Current
                               Dload  Upload   Total   Spent    Left  Speed
  100   271  100   271    0     0    879      0 --:--:-- --:--:-- --:--:--   882
  {"data": {"title": "Wazuh API REST", "api_version": "4.1.1", "revision": 40110, "license_name": "GPL 2.0", "license_url": "https://github.com/wazuh/wazuh/blob/4.1/LICENSE", "hostname": "localhost.localdomain", "timestamp": "2021-03-03T10:01:18+0000"}, "error": 0}
I do not see alerts in the Wazuh Kibana plugin
The first step is to check if there are alerts in Elasticsearch.
# curl https://<ELASTICSEARCH_IP>:9200/_cat/indices/wazuh-alerts-* -u <elasticsearch_user>:<elasticsearch_password> -k
green open wazuh-alerts-4.x-2021.03.03 xwFPX7nFQxGy-O5aBA3LFQ 3 0 340 0 672.6kb 672.6kb
If you do not see any Wazuh related index, it means you have no alerts stored in Elasticsearch.
To ensure that Filebeat is correctly configured, run the following command:
# filebeat test output
elasticsearch: https://127.0.0.1:9200...
  parse url... OK
  connection...
    parse host... OK
    dns lookup... OK
    addresses: 127.0.0.1
    dial up... OK
  TLS...
    security: server's certificate chain verification is enabled
    handshake... OK
    TLS version: TLSv1.3
    dial up... OK
  talk to server... OK
  version: 7.10.2
Could not connect to API with id: default: 3003 - Missing param: API USERNAME
Starting Wazuh 4.0 the Wazuh API username variable changed from user to username. It's necessary to change the credentials (foo:bar are no longer accepted) as well as the name of the variable in the /usr/share/kibana/data/wazuh/config/wazuh.yml configuration file. For example, the configuration can be:
hosts:
 - production:
     url: https://localhost
     port: 55000
     username: wazuh-wui
     password: wazuh-wui
     run_as: false
Wazuh Kibana plugin page goes blank
Sometimes, after an upgrade, the Wazuh Kibana plugin page goes blank. This is due to some issues with the cache memory of the browser.
To fix this you need to:
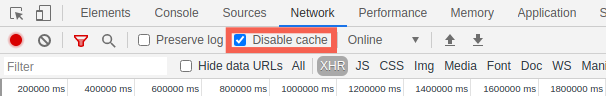
Open the web browser and press F12 to access the DevTools pane.
Click the Network tab and then check the Disable cache option.
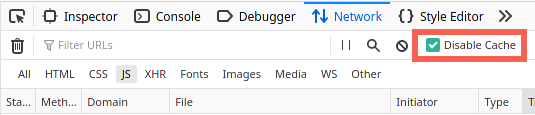
Open your browser and press F12 to access the DevTools pane.
Click the Network tab and then check the Disable cache option.
To enable the Develop tools, follow these steps:
Go to the Safari settings gear icon and click Preferences.
Click the Advanced tab to open the pane and check the Show Develop menu in menu bar option.
Close the Preferences window.
Check if the browser’s menu bar is enabled. If not, go to the Safari settings gear icon and click Show Menu Bar.
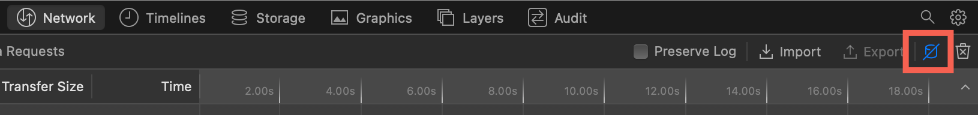
Click the Develop tab on the menu bar and click Show Web Inspector to open the web inspector pane.
Click the Network tab and then check the Ignore cache when loading resources option.
After following these steps, refresh the page and close the browser.
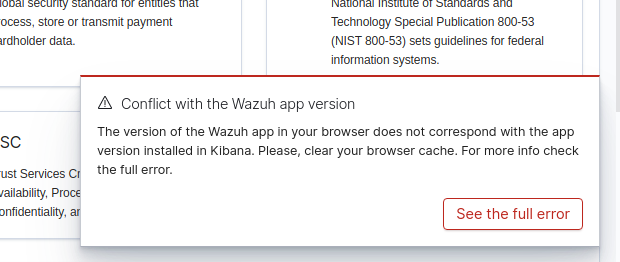
"Conflict with the Wazuh app version" error is displayed
Sometimes, after an upgrade, the Wazuh Kibana plugin displays the "Conflict with the Wazuh app version" error. This is due to some issues with the cache memory of the browser.
To fix this you need to:
Open the web browser and press F12 to access the DevTools pane.
Click the Network tab and then check the Disable cache option.
Open your browser and press F12 to access the DevTools pane.
Click the Network tab and then check the Disable cache option.
To enable the Develop tools, follow these steps:
Go to the Safari settings gear icon and click Preferences.
Click the Advanced tab to open the pane and check the Show Develop menu in menu bar option.
Close the Preferences window.
Check if the browser’s menu bar is enabled. If not, go to the Safari settings gear icon and click Show Menu Bar.
Click the Develop tab on the menu bar and click Show Web Inspector to open the web inspector pane.
Click the Network tab and then check the Ignore cache when loading resources option.
After following these steps, refresh the page and close the browser.
None of the above solutions are fixing my problem
All the components we use have their own log files, you can check them and look for error and warning messages.
Check the Elastic Stack log files:
# cat /var/log/elasticsearch/<elasticsearch-cluster-name>.log | grep -i -E "error|warn"
# cat /var/log/filebeat/filebeat | grep -i -E "error|warn"
Note
The Elastic Stack uses the
/var/logfolder to store logs by default. This setting can be customized following the documentation for Elasticsearch or Filebeat.Warning
By default, Kibana doesn't store logs on a file. You can change this by configuring
logging.destsetting in thekibana.ymlconfiguration file. Check the Kibana documentation for more details.Check the Wazuh Kibana plugin log file:
# cat /usr/share/kibana/data/wazuh/logs/wazuhapp.log | grep -i -E "error|warn"
Check the Wazuh manager log file:
# cat /var/ossec/logs/ossec.log | grep -i -E "error|warn"