Anti-flooding mechanism
This mechanism is designed to prevent disruptively large bursts of events on an agent from negatively impacting the network or the manager. It uses a leaky bucket queue that collects all generated events, and sends them to the manager at a rate not exceeding a configurable events per second threshold, helping to avoid the loss of events or unexpected behavior of Wazuh components.
Additionally, agent modules can be configured to limit the rate at which they produce events, reducing the risk of the leaky bucket's buffer being saturated.
Why it is an anti-flooding mechanism needed?
In the Wazuh architecture, Wazuh agents collect information from log files, command outputs, different kinds of scans, etc. They then send all the collected information, broken into individual events, to their manager. Without any congestion control, an agent could potentially send events at a rate as high as the system is physically capable of transmitting them (hundreds or thousands per second).
Due to this fact, a wrong configuration in an agent may generate enough events to saturate a network or its manager. Here are some misconfiguration scenarios that could lead to this problem:
Realtime FIM (Syscheck) of a directory with files that keep changing: Events are generated every time a file under a Syscheck-monitored directory changes. If Syscheck monitors a directory which changes constantly, it will generate a large amount of events. In addition, if the monitored directory contains any file to which Wazuh writes when it generates an event, like
/var/ossec/queue/, it will cause an infinite loop.Windows Filtering Platform: A Windows firewall event (ID 5156) is generated each time an outbound network connection is allowed. When this event is enabled in Windows, and Wazuh is configured to monitor all Windows Security Log events, then when the agent connects its manager, it will generate a Windows firewall event that in turn causes the agent to connect again to its manager, leading to an infinite loop. Thus a disruptively high high rate of events is transmitted by the agent to its manager, causing problems at the agent, network, and/or manager level.
Applications that retry on errors with no rate limiting: Some applications when encountering poorly anticipated error conditions like disk full, may generate an error log entry and retry over and over again hundreds of times per second, generative a massive event volume.
In order to better handle these kinds of situations, the following controls have been deployed:
Agent-to-manager anti-flooding mechanism: This provides event congestion control with an agent-side leaky bucket queue to guard against saturation of the network or of the manager by an agent.
Internal agent anti-flooding control: This mechanism uses internal limits in different components of the agent, making them limit the rate at which they generate events so as to avoid saturation.
How it works: Leaky bucket
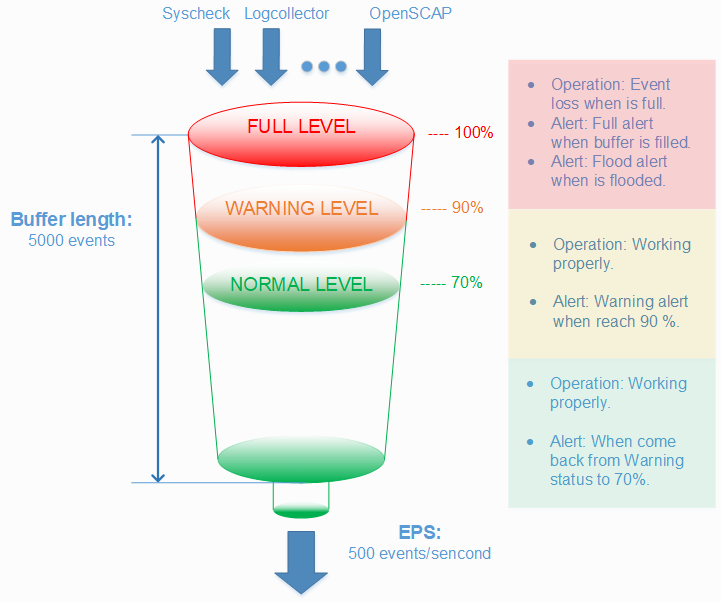
As already described, the leaky bucket is a congestion control located in agents and focused on agent-to-manager communication. It collects events generated on an agent in a buffer of a configurable size (default 5000 events), and sends them to the manager at a rate no higher than a configurable number of events per second (default 500 EPS). These values need to take into account the needs of your specific agents, manager, and network environment. The following graphic shows how the bucket works.

There are several levels of control for the bucket with the aim of being aware of the buffer status, and being able to foresee a flooding situation.
Warning alert: The first control will trigger an alert on the manager when the occupied capacity of the buffer has reached a certain threshold. By default it is set at 90 percent.
Full alert: After the first control, if the buffer gets filled, another alert will be triggered on the manager. This new alert is more serious than a warning alert because a full bucket will drop incoming events.
Flood alert: This alert is generated if more than a configurable amount of time passess between a full alert event and the buffer level dropping below the
warning level.Normal alert: This alert is generated to announce that the buffer level has returned to normal (by default <= 70%) after having previously triggered a warning alert or higher.
The leaky bucket is totally configurable to adapt to any environment, with the use of the following configuration options.
Measured configuration
In the <client_buffer> section of Local configuration it is possible to disable the buffer, configure the size of the buffer (in number of events), and configure its throughput limit measured in EPS.
Disable buffer: This parameter disables the use of the leaky bucket, resulting in no restriction on the rate of events transmitted by the agent to the manger. This is how previous versions of the agent worked.
Queue size: The queue size is the maximum number of events that can be held in the leaky bucket at one time. It should be configured according to the expected rate at which an agent may generate events. This value is set to 5000 events by default, which is a generous buffer size for most environments.
Events per second: This is the maximum rate at which events will be pulled from the agent's buffer and transmitted to its manager. The default is a generous 500 EPS, but this should be set taking into account the capacity of the network and the number of agents that a manager is serving.
This configuration is also available in Centralized configuration which means it can be set in agent.conf with the aim of configuring agents' bucket options from the manager side. When an agent is configured by agent.conf, that configuration overrides its own local configuration.
To allow the agent to have final say about a minimum number of EPS it will be allowed to transmit regardless of the EPS limit handed to it from the manager via agent.conf, another variable called agent.min_eps can be set in the agent's Internal configuration.
Threshold configuration
In Internal configuration, there are more advanced options related to buffer operation. Specifically, the warning and normal level thresholds, plus the tolerance time for triggering a flooding alert can be configured.
Use case: Leaky bucket
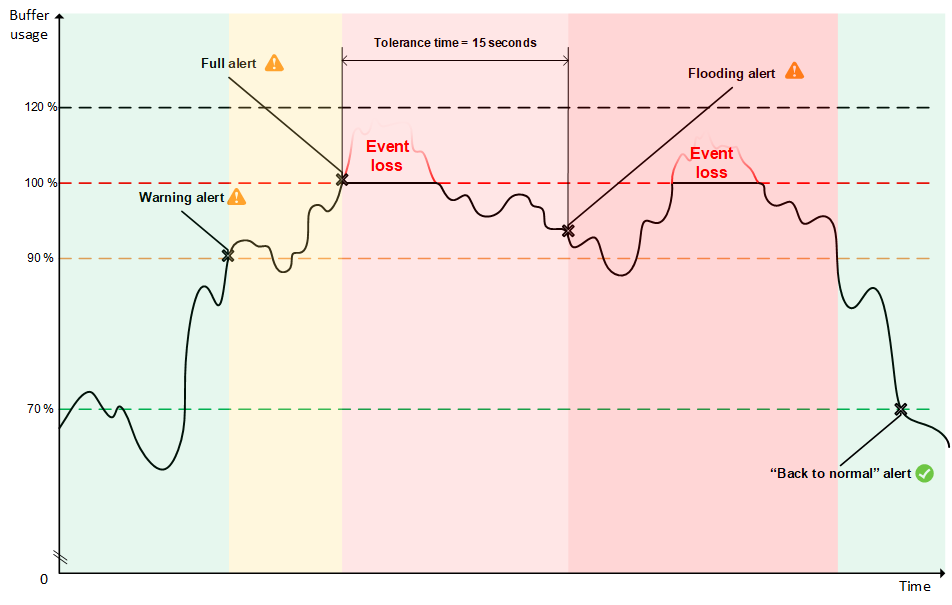
In this section, it will be shown how the leaky bucket acts facing an extreme situation. For this purpose, the following graphic shows different phases of the buffer's usage when it is receiving more events than expected, and how it acts step by step to manage the situation.

Normal status (green area)
As the graphic shows in the left area, the buffer is working normally, receiving and sending events. In this situation no buffer alerts are triggered on the manager. However, a large amount of events can provoke an increase in the buffer usage, causing it to reach the warning level, here set at 90 percent.
Warning status (orange area)
Once it has reached the warning level, an alert like this one is triggered on the manager side:
** Alert 1501604235.59814: - wazuh,agent_flooding,
2017 Aug 01 18:17:15 (fedora) any->ossec-agent
Rule: 202 (level 7) -> 'Agent buffer queue is 90% full.'
wazuh: Agent buffer: '90%'.
level: 90%
Despite this alert, no events have been dropped because there is still free space in the buffer.
Reached 100% (light red area)
When the buffer continues receiving events faster than they are removed, it will eventually reach 100% of its capacity, triggering another alert on the manager:
** Alert 1501604236.60027: - wazuh,agent_flooding,
2017 Aug 01 18:17:16 (fedora) any->ossec-agent
Rule: 203 (level 9) -> 'Agent event queue is full. Events may be lost.'
wazuh: Agent buffer: 'full'.
level: full
It is important to understand that when the buffer is full, all newly arriving events will be dropped until free space opens up in the buffer again. For example, if in one second, 1000 events arrive to a full buffer with a throughput limit of 500 EPS, 500 of these events will be stored and the other 500 will be dropped.
When the buffer reaches 100% full, a timer is started, which is compared to the tolerance time set in internal_options.conf.
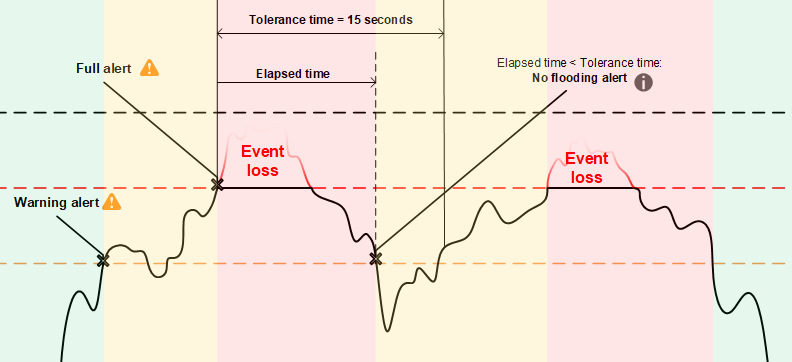
At this point, two possible things could happen:
Usage of the buffer decreases to below the
warning levelbefore the timer reaches thetolerance timeConsequently, no alert about flooding appears on the manager. The graphic illustrates this situation.

Buffer usage stays above the
warning leveluntil the tolerance time has elapsed. Now it appears that the buffer may not come back to a normal status by itself. For that reason, a more severe alert is triggered on the manager.
Flooding status (red area)
As already mentioned, a severe alert is triggered when tolerance time has elapsed. This alert has the following appearance:
** Alert 1501604250.60248: mail  - wazuh,agent_flooding,
2017 Aug 01 18:17:30 (fedora) any->ossec-agent
Rule: 204 (level 12) -> 'Agent event queue is flooded. Check the agent configuration.'
wazuh: Agent buffer: 'flooded'.
level: flooded
Warning
Note the alert description warns the user to check the agent since it is probable that it will not recover to a normal status by itself. Remember that a flooded agent is surely dropping events.
Returning to normal status
The right area of the graphic shows how the buffer returns to a normal status after it hits 100% full. This could happen because a module ceases generating excessive events, either because something has completed or because the offending module was shut down manually.
In order to let the manager know when an agent is working properly again, another alert is triggered when a maxed-out buffer's usage decreases back down to less than the normal level (70% by default). The alert looks like this:
** Alert 1501604257.60486: - wazuh,agent_flooding,
2017 Aug 01 18:17:37 (fedora) any->ossec-agent
Rule: 205 (level 3) -> 'Agent event queue is back to normal load.'
wazuh: Agent buffer: 'normal'.
level: normal
When the bucket is in this status no events are dropped.
Anti-flooding in agent modules
In order to avoid agent buffer saturation followed by event loss, the event production rates of Wazuh agent daemons that could cause this saturation have been limited.
Logcollector: If a log file is written faster that logcollector can read it, this can cause the agent trouble. For this reason, the agent will restrict itself to reading no more than a configurable maximum number of lines from the same file per read cycle.
OpenSCAP Wodle: This module previously sent the entire set of scan results as soon as a scan would complete. Now it sends the scan information to the manager at a regulated speed so as to reduce the likelihood of maxing out the buffer.
These are advanced configurations located at Internal configuration. The variables defined for this purpose are called logcollector.max_lines and
wazuh_modules.max_eps. Be careful when changing these values.