Upgrading Elastic Stack server
Although Wazuh v2.x is compatible both with Elastic Stack 2.x and 5.x, it is recommended to run it with version 5.x, our Wazuh Kibana App it is not compatible with Elastic Stack 2.X. In any case, here is a brief description of the upgrade process, no matter which version of the cluster you decide to keep.
Keep using Elastic Stack 2.x
In this scenario you will only need to configure Logstash to receive data from Filebeat (or directly read alerts generated by Wazuh server for a single-host architecture) and feed the Elasticsearch using the Wazuh alerts template:
Configure Logstash
Download the new logstash configuration:
$ curl -so /etc/logstash/conf.d/01-wazuh.conf https://raw.githubusercontent.com/wazuh/wazuh/2.1/extensions/logstash/01-wazuh.conf
$ curl -so /etc/logstash/wazuh-elastic2-template.json https://raw.githubusercontent.com/wazuh/wazuh/2.1/extensions/elasticsearch/wazuh-elastic2-template.json
In the output section of
/etc/logstash/conf.d/01-wazuh.conf, comment the line forelastic5-templateand uncomment the line forelastic2-template:
output {
  elasticsearch {
  hosts => ["localhost:9200"]
  index => "wazuh-alerts-%{+YYYY.MM.dd}"
  document_type => "wazuh"
        #      template => "/etc/logstash/wazuh-elastic5-template.json"
              template => "/etc/logstash/wazuh-elastic2-template.json"
              template_name => "wazuh"
              template_overwrite => true
        }
}
Only if you are using a single-host architecture (where Wazuh server is running with Elastic Stack in the same host), edit
/etc/logstash/conf.d/01-wazuh.confcommenting out the entire input section titledRemote Wazuh Manager - Filebeat inputand uncommenting the entire input section titledLocal Wazuh Manager - JSON file input:
 # Wazuh - Logstash configuration file
 ## Remote Wazuh Manager - Filebeat input
 #input {
 #beats {
 #      port => 5000
 #      codec => "json_lines"
 #      ssl => true
 #      ssl_certificate => "/etc/logstash/logstash.crt"
 #      ssl_key => "/etc/logstash/logstash.key"
 #  }
 #}
 # Local Wazuh Manager - JSON file input
 input {
    file {
        type => "wazuh-alerts"
        path => "/var/ossec/logs/alerts/alerts.json"
        codec => "json"
    }
 }
 ...

The above will setup Logstash to read the Wazuh ``alerts.json`` file directly from the local filesystem rather than receive forwarded data from Filebeat.
Configure Kibana
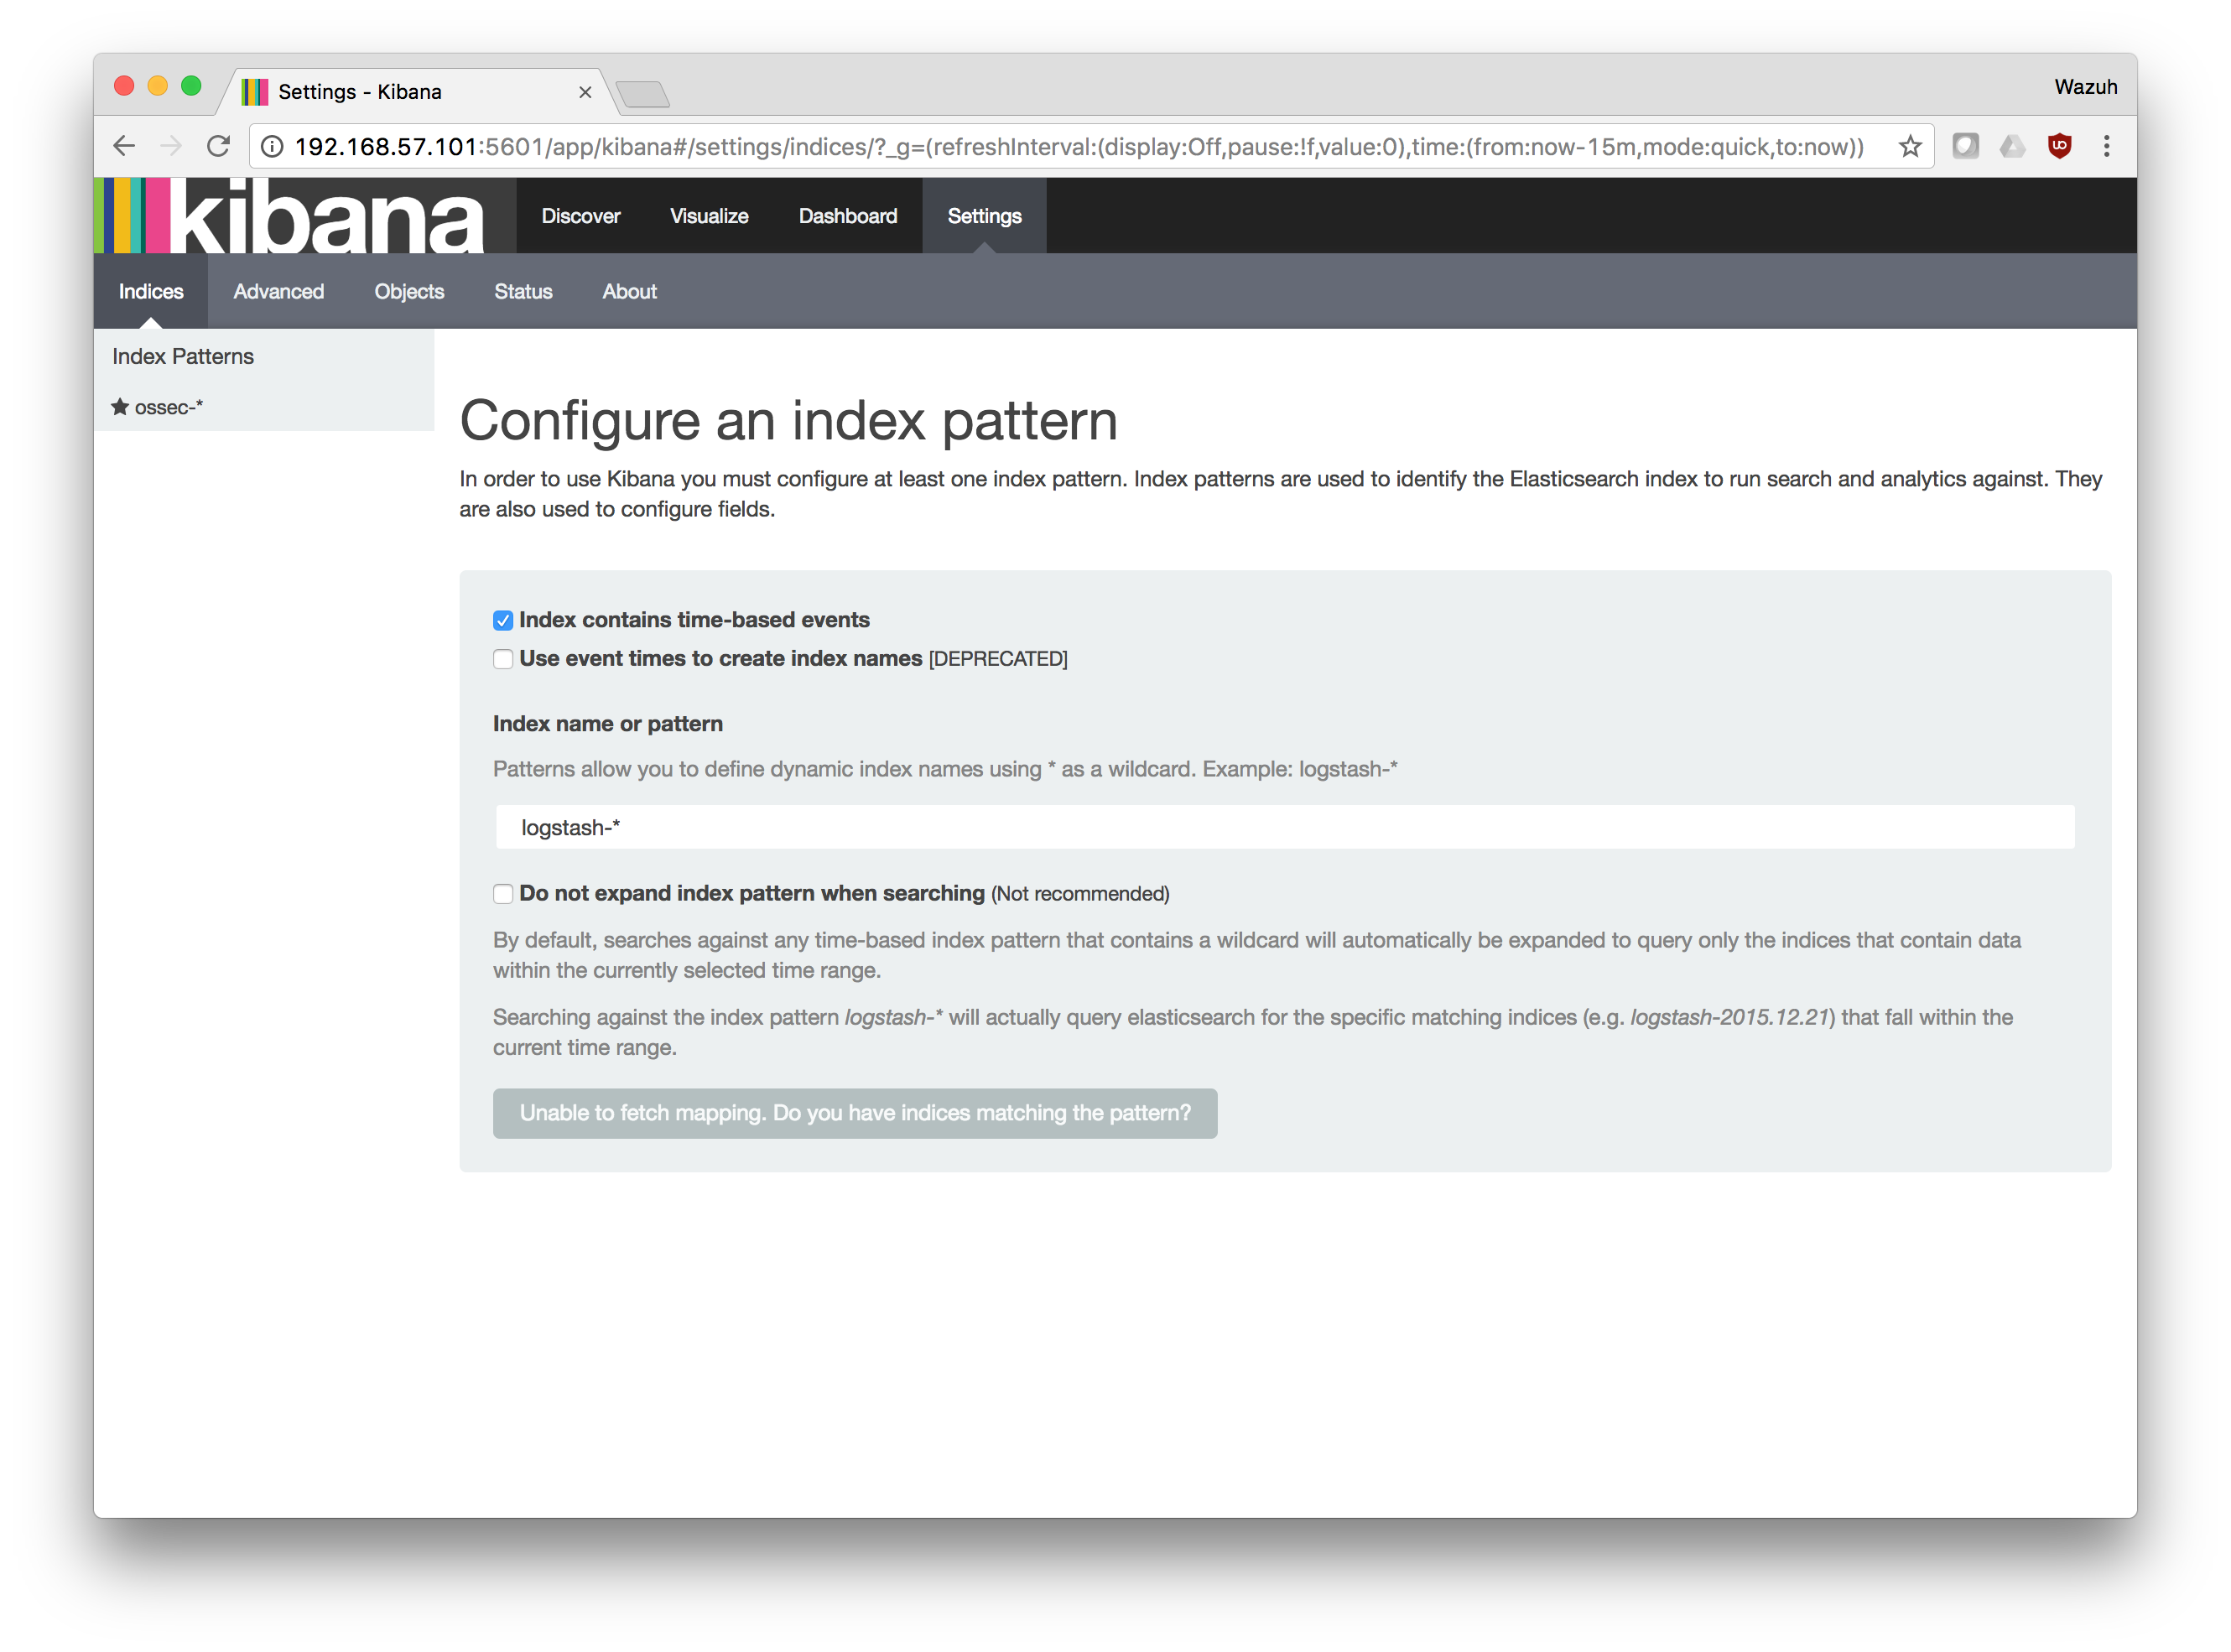
Next, in order to display Wazuh alerts data, we will configure Kibana index pattern.
Go to Settings and configure a new wildcard:
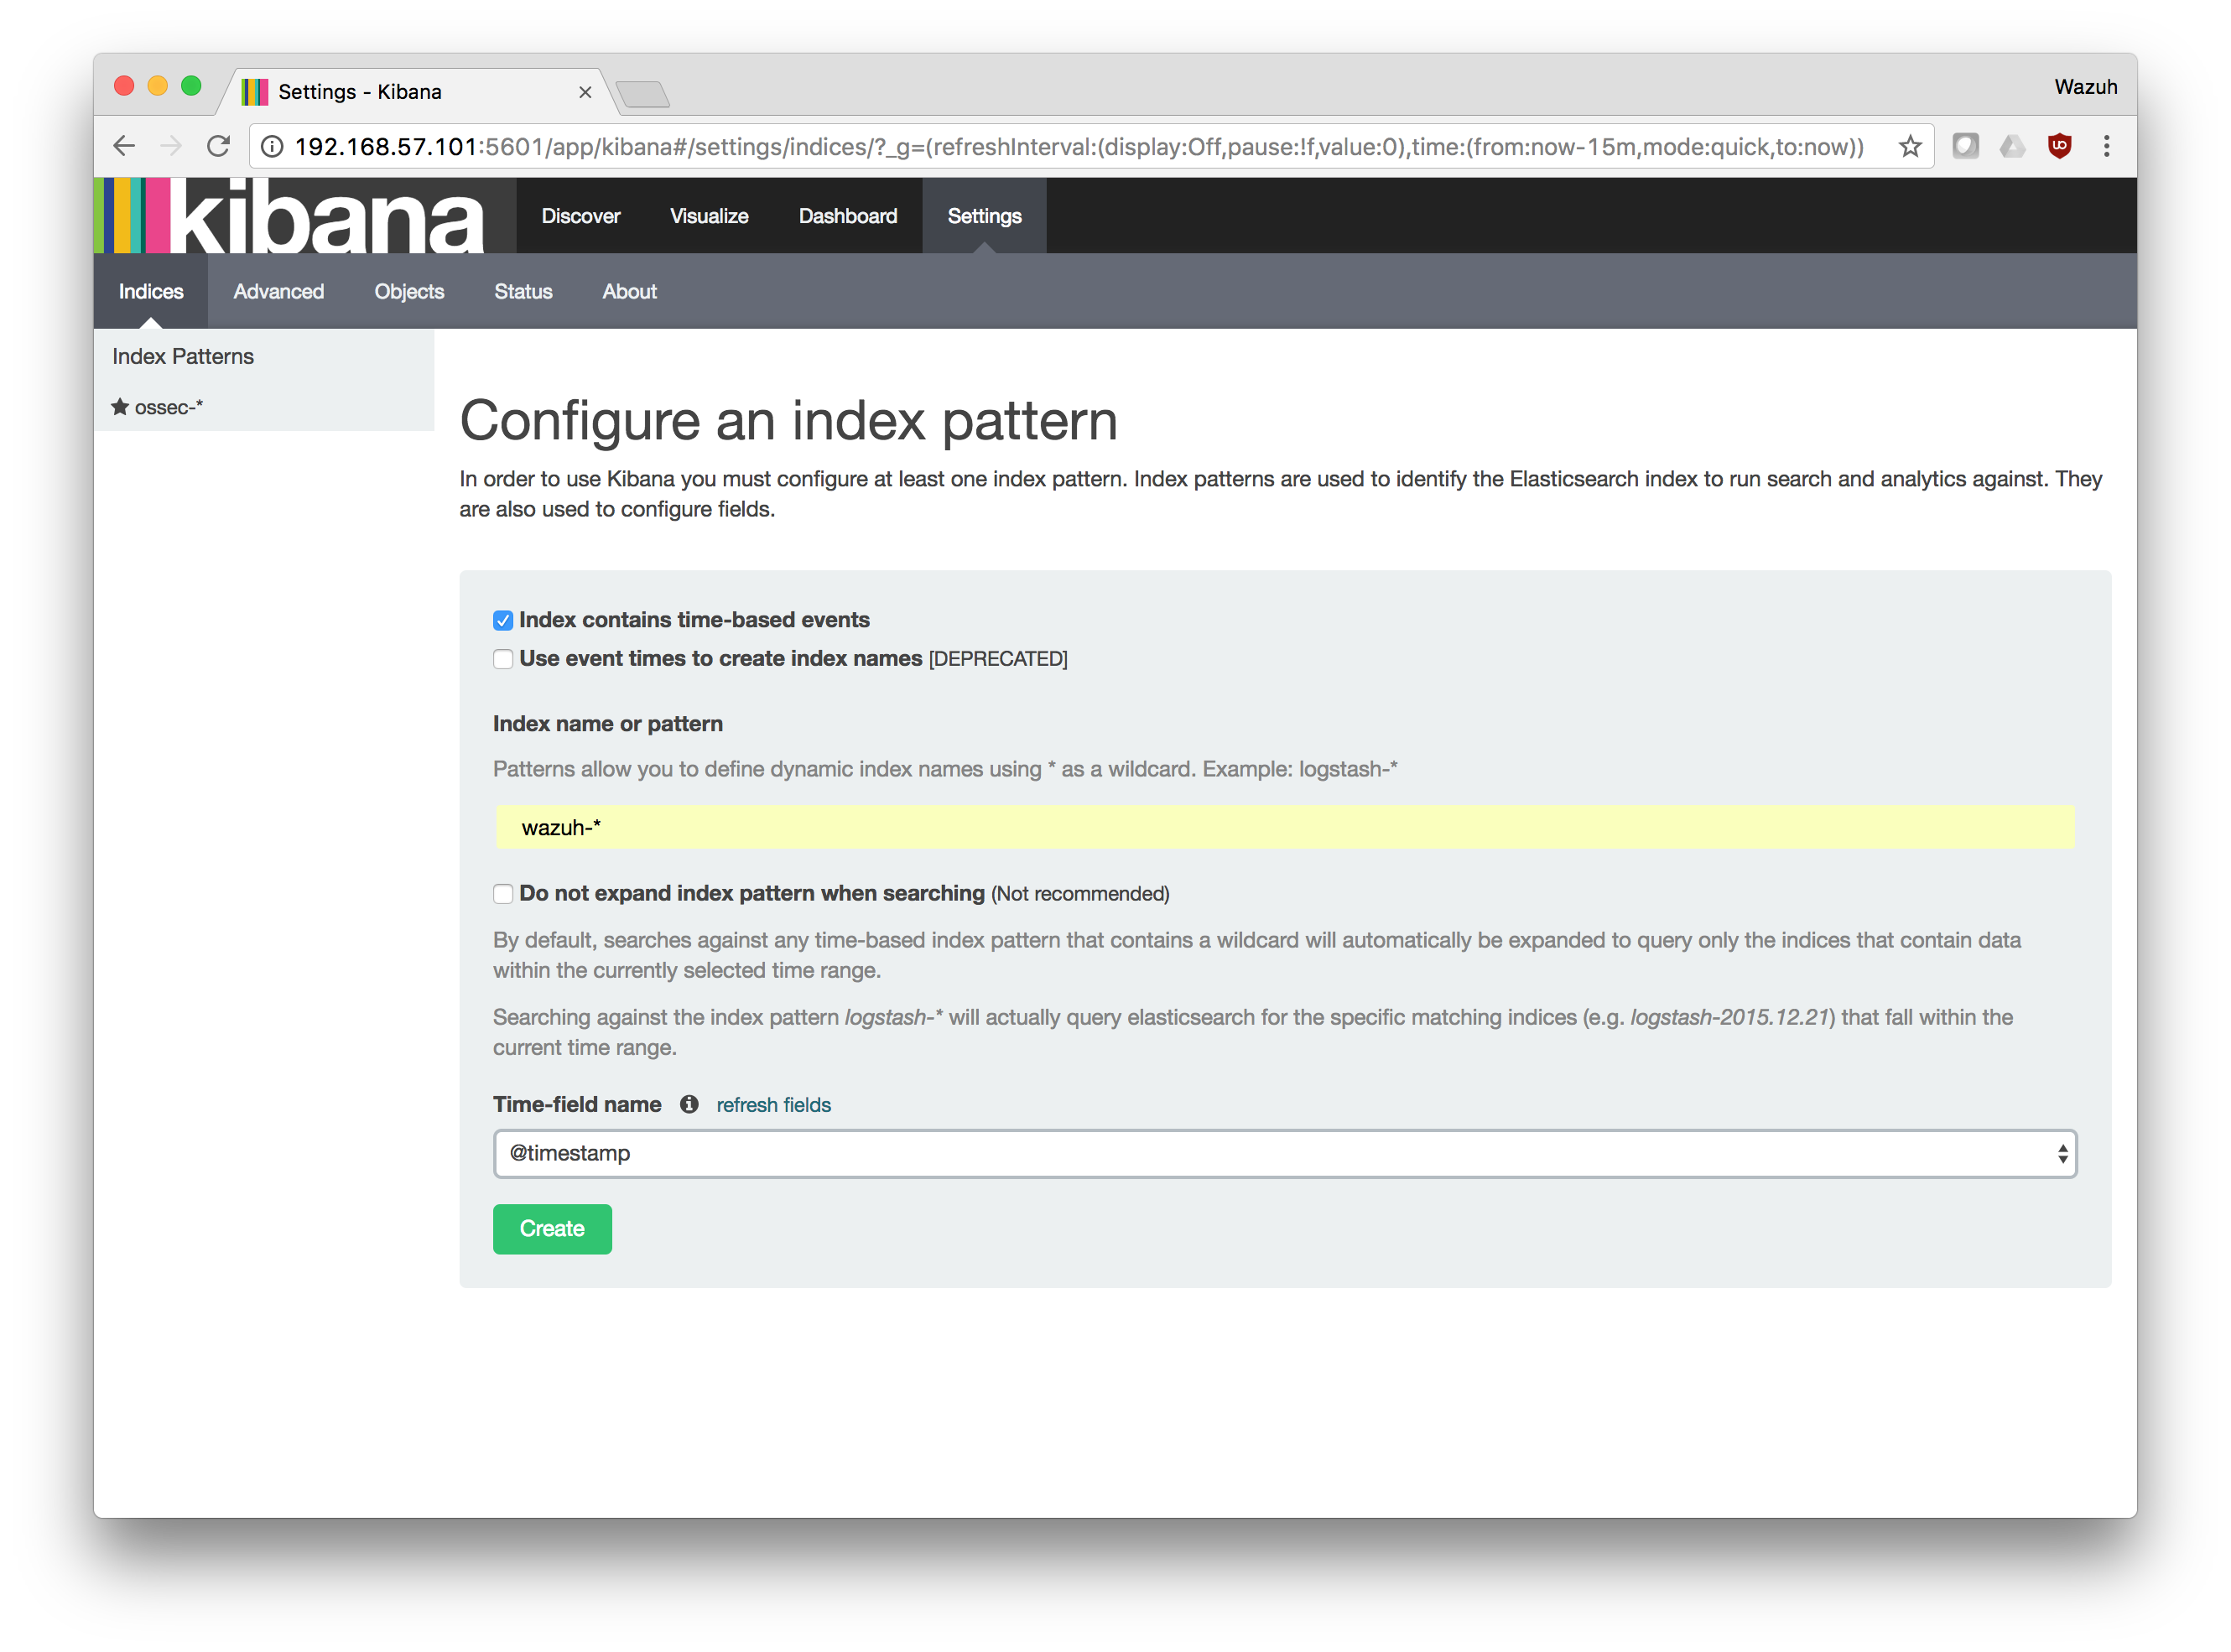
Set
wazuh-*as index pattern and choosetimestampas time field, then click on create:
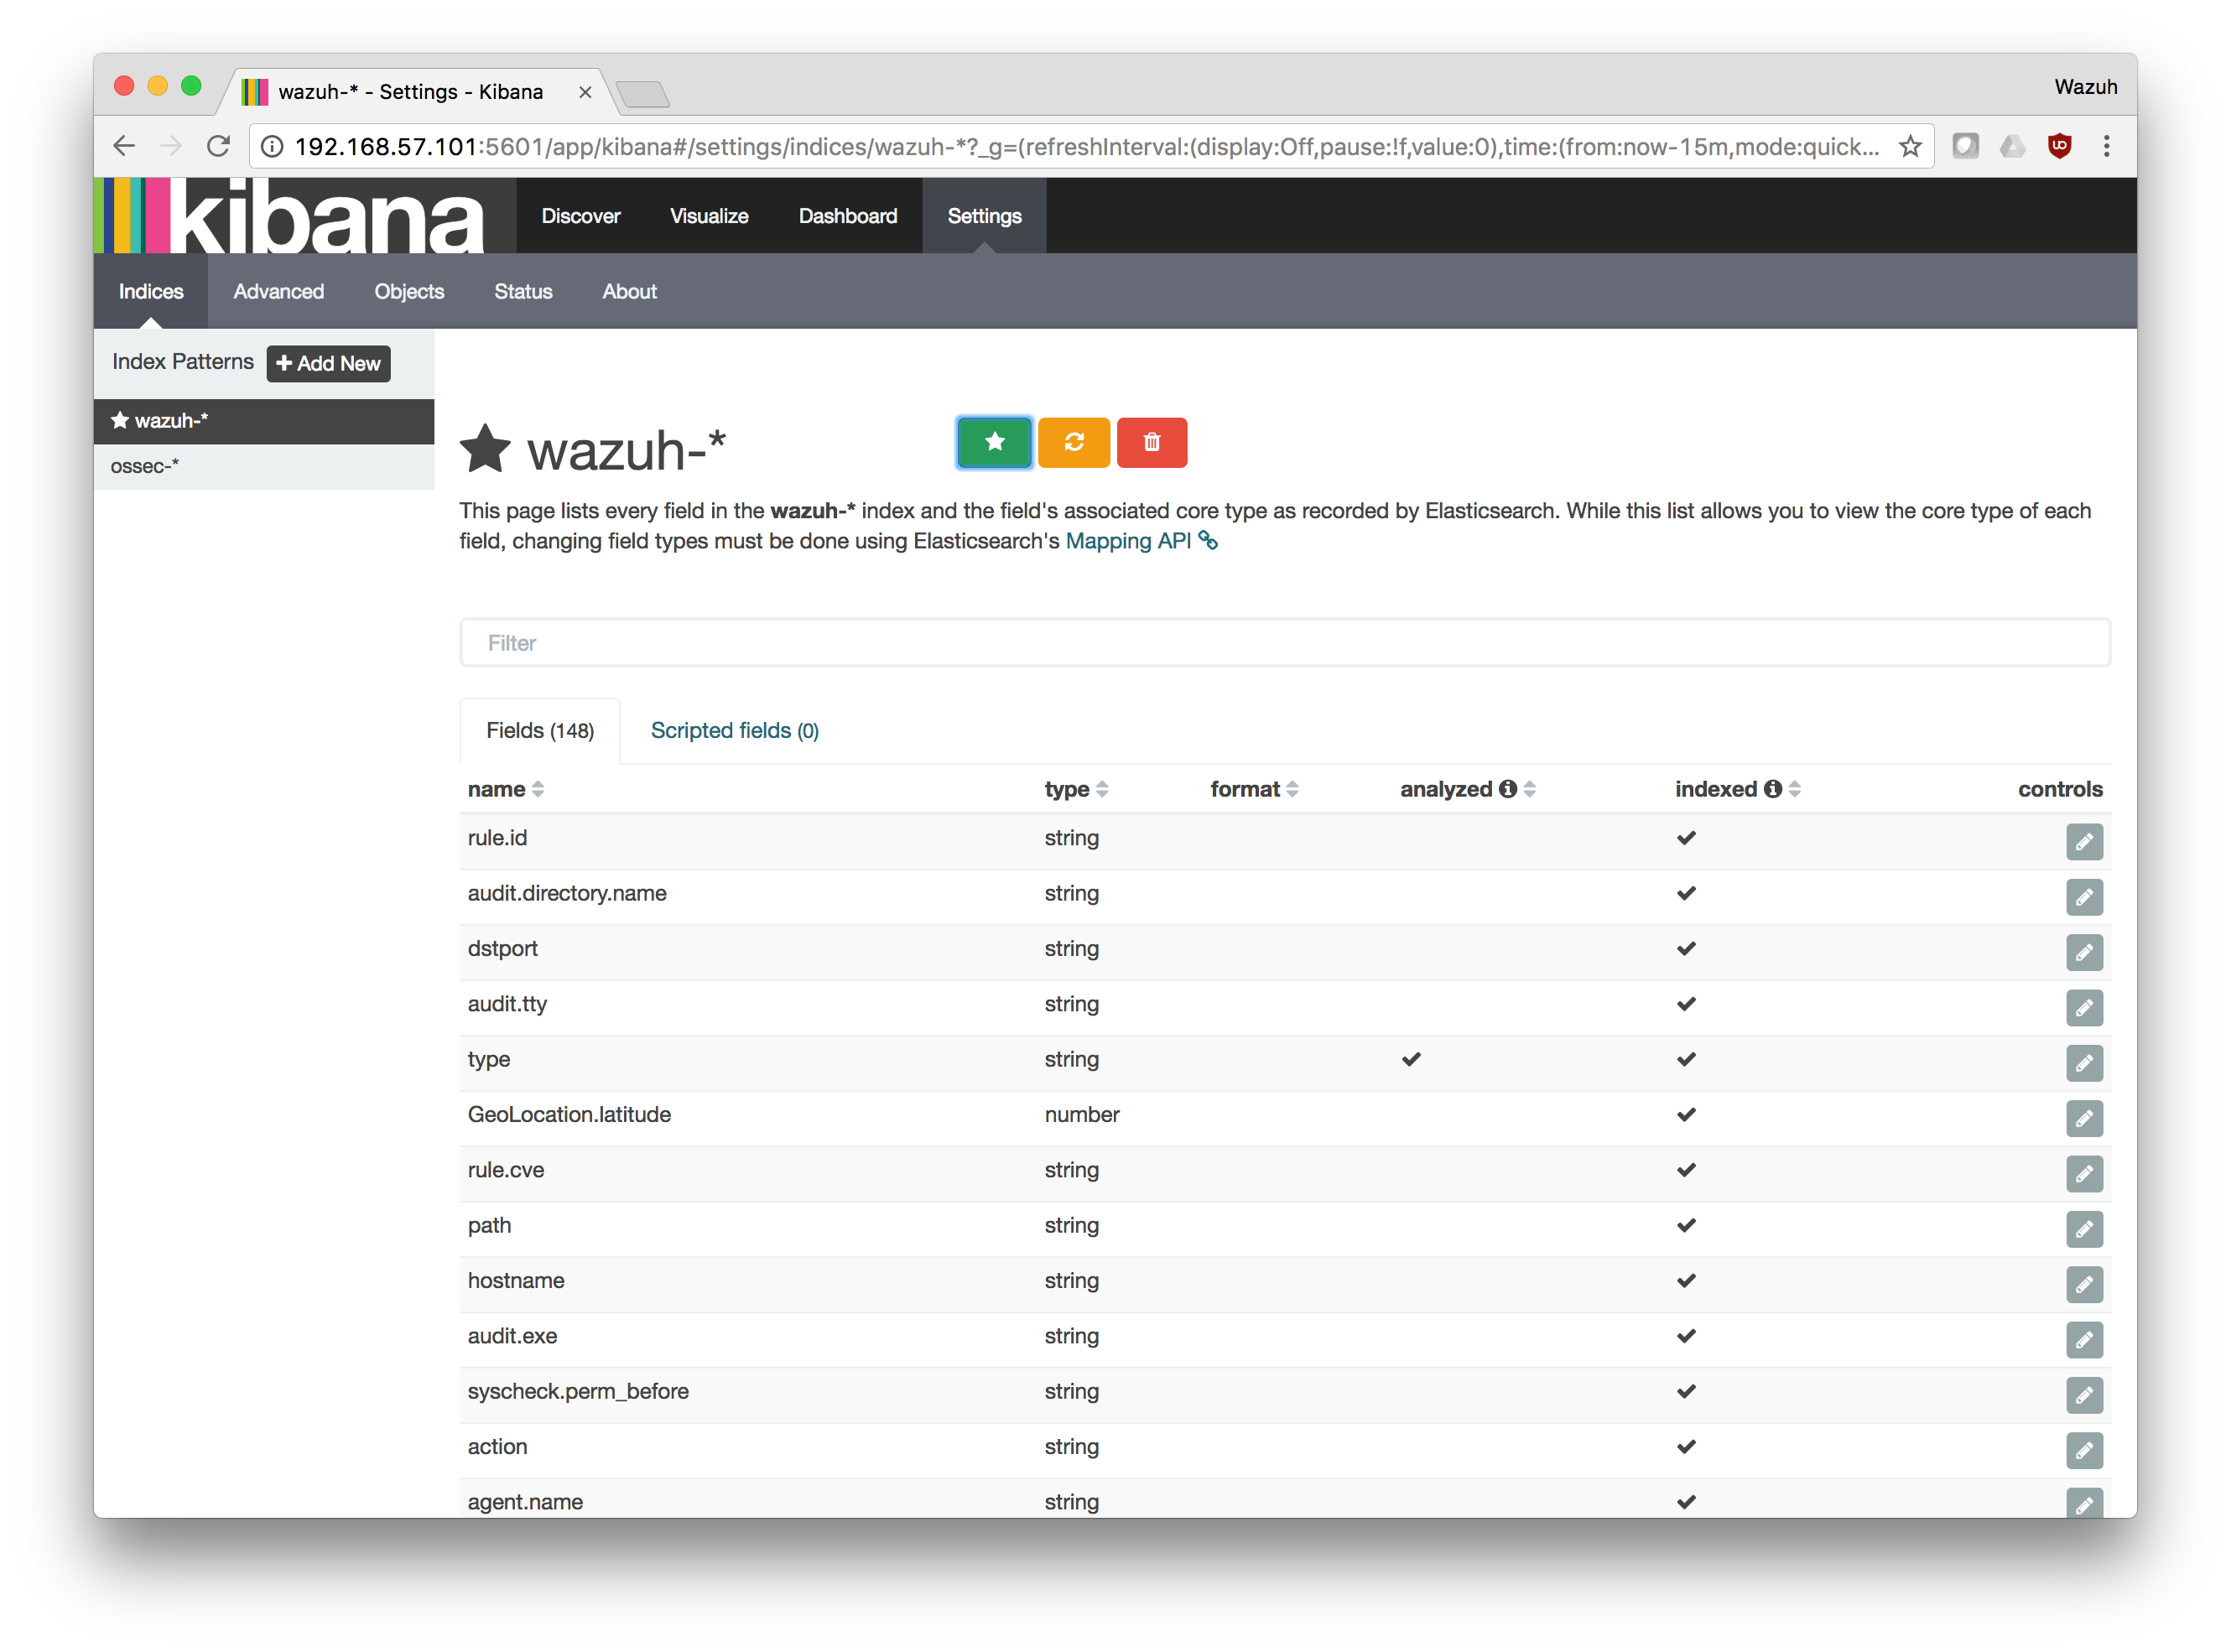
Set as default wildcard by clicking on the Star:
Go to the
Discovertab in order to visualize the alerts data.
Upgrade from Elastic Stack 2.x to 5.x
Follow next steps to upgrade your Elastic Stack cluster to version 5.X:
Stop the running Logstash, Elasticsearch and Kibana instances:
For Systemd:
$ systemctl stop logstash.service
$ systemctl stop elasticsearch.service
$ systemctl stop kibana.service
For SysV Init:
$ service logstash stop
$ service elasticsearch stop
$ service kibana stop
Remove Logstash old configuration and template files:
For single-host architectures (Wazuh server and Elastic Stack running in the same system):
$ rm /etc/logstash/conf.d/01-ossec-singlehost.conf
$ rm /etc/logstash/elastic-ossec-template.json
For distributed architectures (Elastic Stack standalone server):
$ rm /etc/logstash/conf.d/01-ossec.conf
$ rm /etc/logstash/elastic-ossec-template.json
Remove deprecated settings from configuration file:
Removing deprecated settings on Elasticsearch will avoid errors & conflicts after the upgrade, To do that, comment the following lines on your
/etc/elasticsearch/elasticsearch.ymlfile:index.number_of_shards: 1 index.number_of_replicas: 0
ES_HEAP_SIZEoption is now deprecated. You should remove or comment out this option in your/etc/sysconfig/elasticsearchfile:# ES_HEAP_SIZE - Set it to half your system RAM memory ES_HEAP_SIZE=8gNow you can go ahead and configure it following the Elastic jvm.options guide
At this point, you could install the new version of Elastic Stack. Depending on your operating system you can follow one of these installation instructions:
Let's check the software version of the different components to verify everything worked as expected:
For Logstash:
$ /usr/share/logstash/bin/logstash -V
logstash 5.2.2
For Elasticsearch:
$ /usr/share/elasticsearch/bin/elasticsearch -V
Version: 5.2.2, Build: f9d9b74/2017-02-24T17:26:45.835Z, JVM: 1.8.0_60
For Kibana:
$ /usr/share/kibana/bin/kibana -V
5.2.
Note
Wazuh v2.x uses different indices and templates than Wazuh v1.x For that reason, you will not be able to see the previous alerts using Kibana. If you need to access them, you will have to reindex the previous indices.


