Track down vulnerable applications
Of the many software packages installed on your environment's computers,
which ones have known vulnerabilities that might impact your security posture?
Wazuh helps you answer this question with the syscollector and
vulnerability-detector modules.
On each agent, syscollector can scan the system for the presence and
version of all software packages. This information is submitted to the Wazuh
manager where it is stored in an agent-specific database for later assessment.
On the Wazuh manager, vulnerability-detector maintains a fresh copy of the
desired CVE sources of vulnerability data, and periodically compares agent
packages with the relevant CVE database and generates alerts on matches.
In this lab, we will see how syscollector is configured by default to run on
the Wazuh Manager and on the agents. We will also configure vulnerability-detector
on the Wazuh Manager to periodically scan the collected inventory data for known
vulnerable packages.
We will observe relevant log messages and vulnerability alerts in Kibana including
a dashboard dedicated to this. We will also interact with the Wazuh API to more
deeply mine the inventory data, and even take a look at the databases where it is
stored.
Configure syscollector for all the agents
In the /var/ossec/etc/ossec.conf file of the Wazuh manager and agents
see the default configuration and find the syscollector section.
For Linux systems:
<!-- System inventory -->
<wodle name="syscollector">
  <disabled>no</disabled>
  <interval>1h</interval>
  <scan_on_start>yes</scan_on_start>
  <hardware>yes</hardware>
  <os>yes</os>
  <network>yes</network>
  <packages>yes</packages>
  <ports all="no">yes</ports>
  <processes>yes</processes>
</wodle>
For Windows, you should enable the hotfixes option, to report the Windows updates installed:
<!-- System inventory -->
<wodle name="syscollector">
  <disabled>no</disabled>
  <interval>1h</interval>
  <scan_on_start>yes</scan_on_start>
  <hardware>yes</hardware>
  <os>yes</os>
  <network>yes</network>
  <packages>yes</packages>
  <ports all="no">yes</ports>
  <processes>yes</processes>
  <hotfixes>yes</hotfixes>
</wodle>
By default, it will collect inventory information for hardware, operating system, network interfaces, installed packages, open ports and running processes every hour.
Configure vulnerability-detector on the Wazuh Manager
Note
This configuration will only work for Wazuh v3.11 or above.
In the /var/ossec/etc/ossec.conf file of the Wazuh manager, scroll down to the vulnerability-detector wodle (Wazuh module) and enable both the service and feeds you may want to use.
<vulnerability-detector>
  <enabled>yes</enabled>
  <interval>5m</interval>
  <ignore_time>6h</ignore_time>
  <run_on_start>yes</run_on_start>
  <provider name="canonical">
    <enabled>no</enabled>
    <os>trusty</os>
    <os>xenial</os>
    <os>bionic</os>
    <os>focal</os>
    <update_interval>1h</update_interval>
  </provider>
  <provider name="debian">
    <enabled>no</enabled>
    <os>wheezy</os>
    <os>stretch</os>
    <os>jessie</os>
    <update_interval>1h</update_interval>
  </provider>
  <provider name="redhat">
    <enabled>yes</enabled>
    <update_from_year>2010</update_from_year>
    <update_interval>1h</update_interval>
  </provider>
  <provider name="nvd">
    <enabled>yes</enabled>
    <update_from_year>2010</update_from_year>
    <update_interval>1h</update_interval>
  </provider>
</vulnerability-detector>
In the example above we have enabled the feeds for RedHat, which will allow us to monitor CentOS systems, and NVD, the National Vulnerability Database, which will allow us to monitor Windows systems. More information on this module and how to configure it can be found in the Vulnerability Detection Section of the documentation.
Restart the Wazuh manager.
For Systemd:
# systemctl restart wazuh-manager
For SysV Init:
# service wazuh-manager restart
Note
The first time the Vulnerability database is updated can take longer to finish.
Look at the logs
The vulnerability-detector module generates logs on the manager, and syscollector does as well on the manager and agents.
Try grep syscollector: /var/ossec/logs/ossec.log on the manager and on an agent:
2019/11/14 19:21:21 wazuh-modulesd:syscollector: INFO: Module started.
2019/11/14 19:21:22 wazuh-modulesd:syscollector: INFO: Starting evaluation.
2019/11/14 19:21:29 wazuh-modulesd:syscollector: INFO: Evaluation finished.
and try grep vulnerability-detector: /var/ossec/logs/ossec.log on the manager
[root@wazuh-manager ~]# grep vulnerability-detector: /var/ossec/logs/ossec.log2020/01/31 17:26:27 wazuh-modulesd:vulnerability-detector: INFO: (5461): Starting Red Hat Enterprise Linux database update. 2020/01/31 17:26:46 wazuh-modulesd:vulnerability-detector: INFO: (5494): The update of the Red Hat Enterprise Linux feed finished successfully. 2020/01/31 17:26:48 wazuh-modulesd:vulnerability-detector: INFO: (5461): Starting National Vulnerability Database database update. 2020/01/31 17:46:06 wazuh-modulesd:vulnerability-detector: INFO: (5494): The update of the National Vulnerability Database feed finished successfully. 2020/01/31 17:46:06 wazuh-modulesd:vulnerability-detector: INFO: (5452): Starting vulnerability scanning. 2020/01/31 17:46:19 wazuh-modulesd:vulnerability-detector: INFO: (5453): Vulnerability scanning finished.
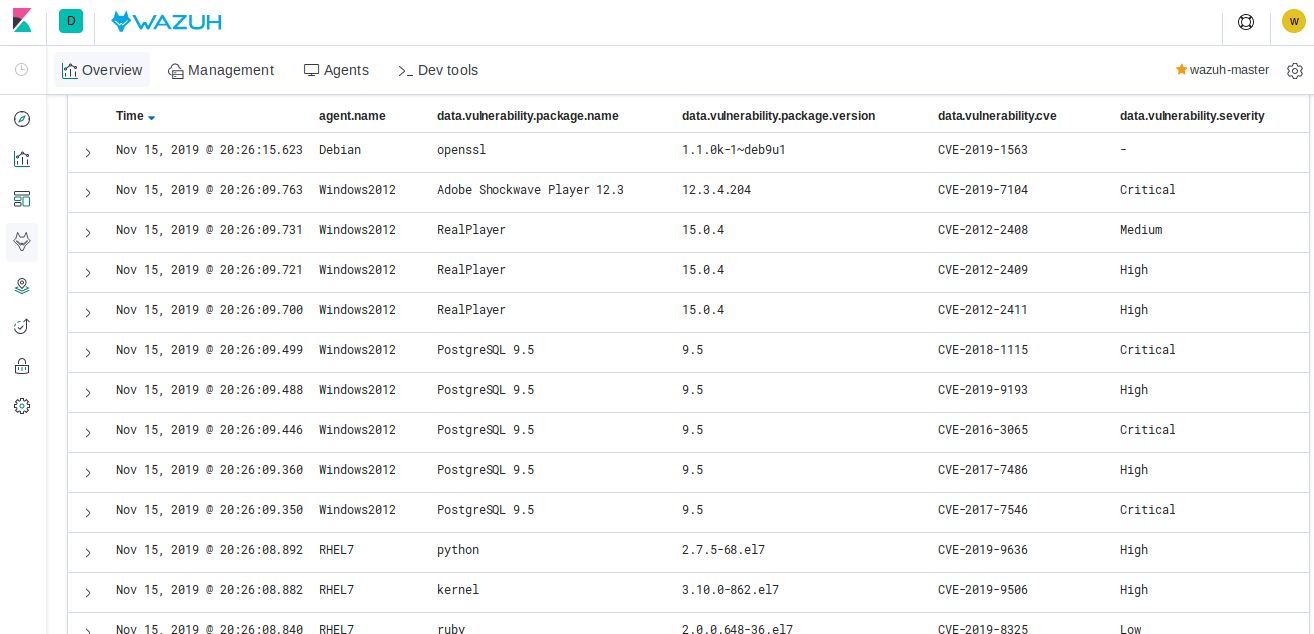
See the alerts in Kibana
Search Kibana for vulnerability-detector, selecting some of the more helpful
fields for viewing like below:
Expand one of the records to see all the information available:
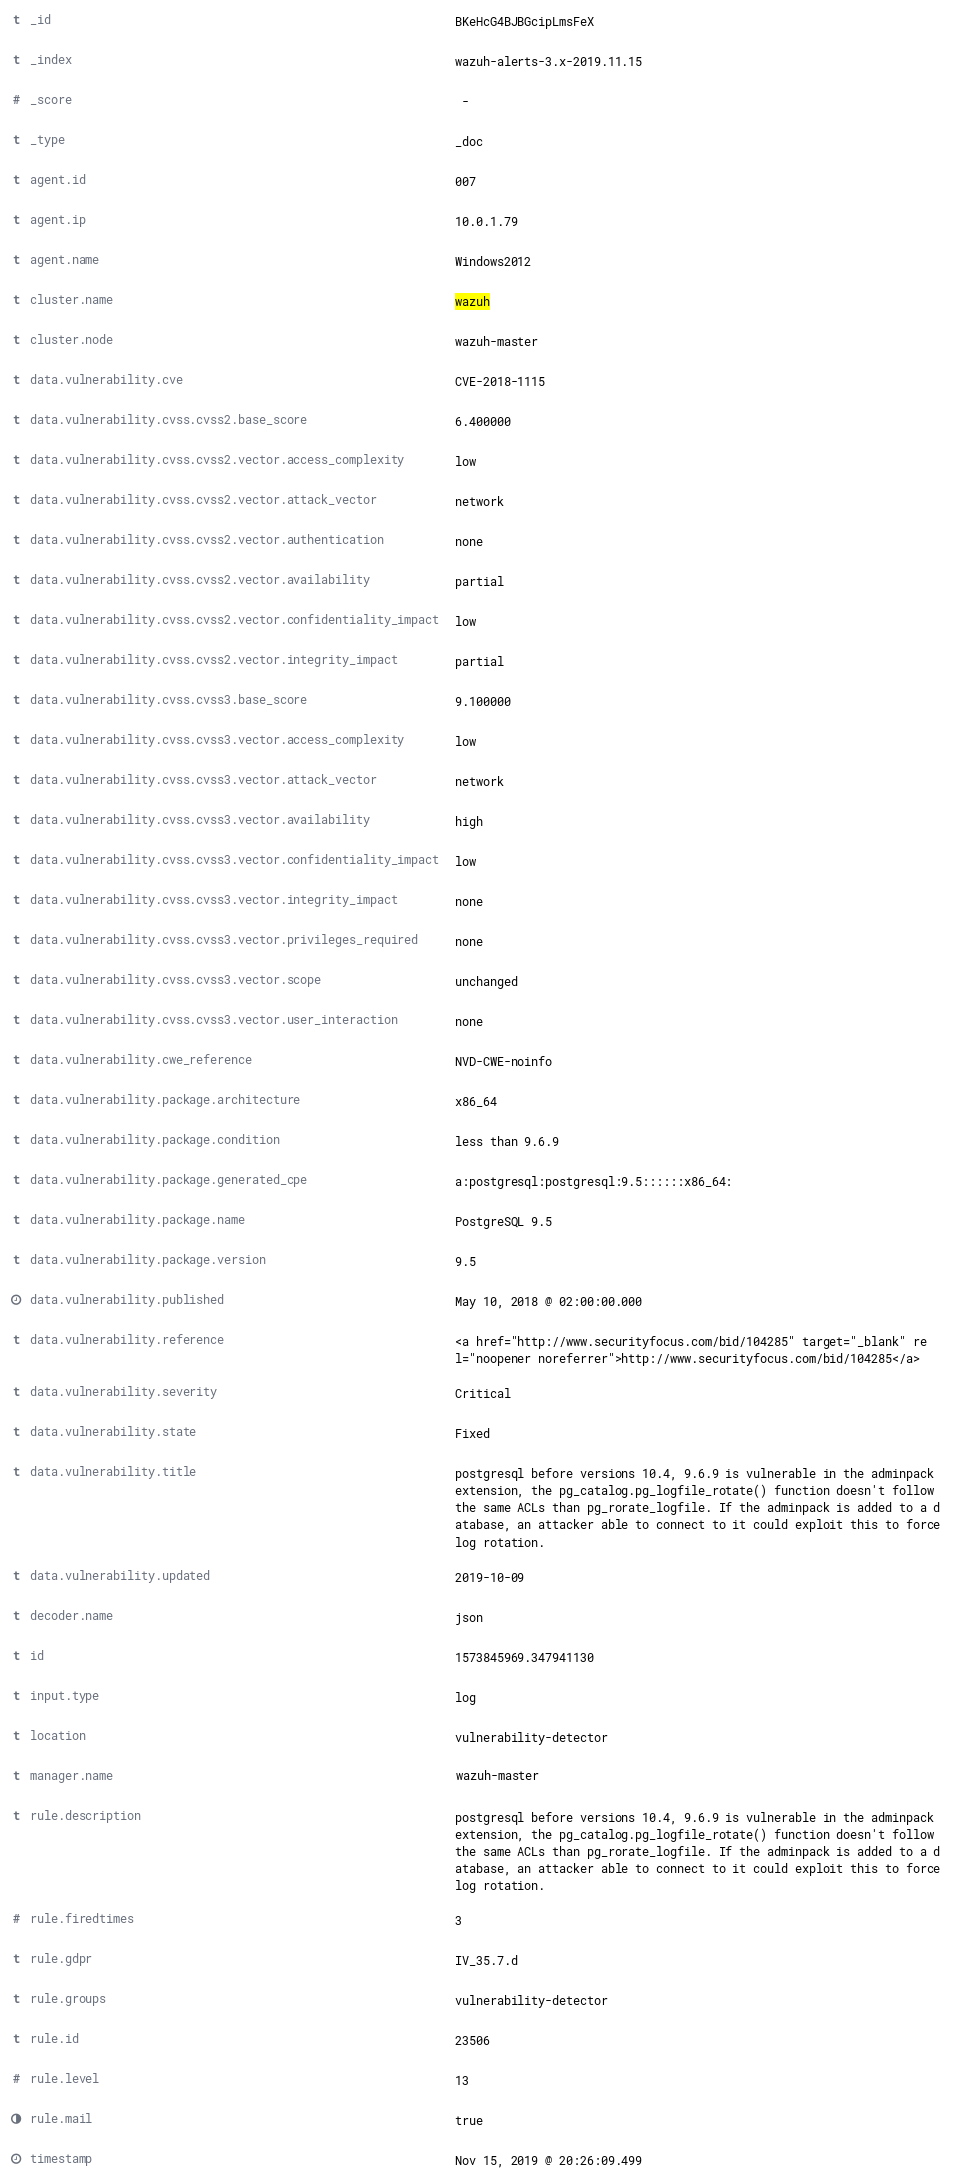
Note all the available fields and remember that the different components of Wazuh may be configured to act differently depending on the fields of each alert, as well as the ability to create visualizations and filtering search results in Kibana.
Note
When the field data.vulnerability.state has the value "Fixed", this
indicates that the vulnerability has been corrected in future versions of
the software. However the vulnerability is still present in the version
installed in your system.
Look deeper with the Wazuh API:
Up to now we have only seen the Wazuh API enable the Wazuh Kibana plugin to
interface directly with the Wazuh manager. However, you can also access the
API directly from your own scripts or from the command line with curl. This is
especially helpful here to obtain environment-wide package information.
The actual inventory data is kept in agent-specific databases on the Wazuh manager.
To see that, as well as other information collected by syscollector, you can
query the Wazuh API. Not only are software packages inventoried, but basic
hardware and operating system data is also tracked.
Run
agent_control -lon the Wazuh Manager to list your agents as you will need to query the API by agent id number:
[root@wazuh-manager centos]# agent_control -lWazuh agent_control. List of available agents: ID: 000, Name: wazuh-manager (server), IP: 127.0.0.1, Active/Local ID: 001, Name: elastic-server, IP: 172.30.0.20, Active ID: 002, Name: linux-agent, IP: 172.30.0.30, Active ID: 003, Name: windows-agent, IP: 172.30.0.40, Active
From the Wazuh Manager, query the Wazuh API for scanned hardware data about agent 003.
# curl -u wazuhapiuser:wazuhlab -k -X GET "https://localhost:55000/syscollector/003/hardware?pretty"
Where wazuhapiuser:wazuhlab are the credentials for the API.
The results should look like this:
[root@linux-agent centos]# curl -u wazuhapiuser:wazuhlab -k -XGET "https://172.30.0.10:55000/syscollector/003/hardware?pretty"{ "error": 0, "data": { "cpu": { "cores": 1, "mhz": 2400, "name": "Intel(R) Xeon(R) CPU E5-2676 v3 @ 2.40GHz" }, "ram": { "free": 1121708, "total": 2096752, "usage": 46 }, "scan": { "id": 1265621549, "time": "2019/12/24 13:43:33" }, "board_serial": "unknown" } }
Next, query the Wazuh API for scanned OS data about agent 003. You can also use localhost instead of the IP if you do it in wazuh-manager
curl -u wazuhapiuser:wazuhlab -k -XGET "https://localhost:55000/syscollector/003/os?pretty"
The results should look like this:
[root@wazuh-manager centos]# curl -u wazuhapiuser:wazuhlab -k -XGET "https://localhost:55000/syscollector/003/os?pretty"{ "error": 0, "data": { "os": { "build": "14393", "major": "10", "minor": "0", "name": "Microsoft Windows Server 2016 Datacenter", "version": "10.0.14393" }, "scan": { "id": 1230696232, "time": "2019/12/24 14:43:33" }, "architecture": "x86_64", "version": "6.2", "hostname": "EC2AMAZ-KMLTB1V" } }
You can also use the experimental capabilities of the API to list information of all agents in the environment. In order to do so it is necessary to enable this capability by editing the API's configuration file:
[root@wazuh-manager centos]# sed -i 's/config.experimental_features = false/config.experimental_features = true/g' /var/ossec/api/configuration/config.js
Restart the Wazuh API service:
For Systemd:
# systemctl restart wazuh-api
For SysV Init:
# service wazuh-api restart
Let's list the versions of curl on all of our Linux systems:
# curl -u wazuhapiuser:wazuhlab -k -X GET "https://localhost:55000/experimental/syscollector/packages?name=curl&pretty"
The results should look like this:
[root@wazuh-manager centos]# curl -u wazuhapiuser:wazuhlab -k -X GET "https://172.30.0.10:55000/experimental/syscollector/packages?name=curl&pretty"{ "error": 0, "data": { "items": [ { "scan": { "id": 4551322, "time": "2019/12/24 14:37:55" }, "vendor": "CentOS", "size": 527, "section": "Applications/Internet", "install_time": "2019/01/28 20:53:16", "format": "rpm", "version": "7.29.0-51.el7", "name": "curl", "architecture": "x86_64", "description": "A utility for getting files from remote servers (FTP, HTTP, and others)", "agent_id": "000" }, { "scan": { "id": 833988275, "time": "2019/12/24 14:43:40" }, "vendor": "CentOS", "size": 527, "section": "Applications/Internet", "install_time": "2019/01/28 20:53:16", "format": "rpm", "version": "7.29.0-51.el7", "name": "curl", "architecture": "x86_64", "description": "A utility for getting files from remote servers (FTP, HTTP, and others)", "agent_id": "001" }, { "scan": { "id": 1281439567, "time": "2019/12/24 14:43:41" }, "vendor": "CentOS", "size": 527, "section": "Applications/Internet", "install_time": "2019/12/18 16:08:20", "format": "rpm", "version": "7.29.0-54.el7_7.1", "name": "curl", "architecture": "x86_64", "description": "A utility for getting files from remote servers (FTP, HTTP, and others)", "agent_id": "002" } ], "totalItems": 3 } }
Note
Take time to read the online documentation about the Wazuh API. It is a powerful utility that puts all sorts of data, configuration details, and state information at your fingertips once you know how to ask for it.
A quick peek at the actual agent databases
Agent-specific databases on the Wazuh manager store, among other things,
the syscollector scan results for each agent.
On the Wazuh Manager, list the tables in an agent's SQLite database:
[root@wazuh-manager centos]# sqlite3 /var/ossec/queue/db/002.db .tablesciscat_results sca_policy sys_netproto fim_entry sca_scan_info sys_osinfo metadata scan_info sys_ports pm_event sys_hotfixes sys_processes sca_check sys_hwinfo sys_programs sca_check_compliance sys_netaddr vuln_metadata sca_check_rules sys_netiface
The sys_ table are populated by syscollector.
Query the OS information table
[root@wazuh-manager centos]# sqlite3 /var/ossec/queue/db/002.db 'select * from sys_osinfo;' -headerscan_id|scan_time|hostname|architecture|os_name|os_version|os_codename|os_major|os_minor|os_build|os_platform|sysname|release|version|os_release 1059274052|2019/12/24 14:43:41|linux-agent|x86_64|CentOS Linux|7.7||7|7||centos|Linux|3.10.0-1062.9.1.el7.x86_64|#1 SMP Fri Dec 6 15:49:49 UTC 2019|
Do a quick dump of the software packages.
[root@wazuh-manager centos]# sqlite3 /var/ossec/queue/db/002.db "select name,version,description from sys_programs;" -headername|version|description kbd-legacy|1.15.5-15.el7|Legacy data for kbd package fontconfig|2.13.0-4.3.el7|Font configuration and customization library centos-indexhtml|7-9.el7.centos|Browser default start page for CentOS pth|2.0.7-23.el7|The GNU Portable Threads library ncurses|5.9-14.20130511.el7_4|Ncurses support utilities libX11|1.6.7-2.el7|Core X11 protocol client library gpgme|1.3.2-5.el7|GnuPG Made Easy - high level crypto API filesystem|3.2-25.el7|The basic directory layout for a Linux system nginx-filesystem|1:1.16.1-1.el7|The basic directory layout for the Nginx server libestr|0.1.9-2.el7|String handling essentials library nginx-mod-http-xslt-filter|1:1.16.1-1.el7|Nginx XSLT module kbd-misc|1.15.5-15.el7|Data for kbd package tcpdump|14:4.9.2-4.el7_7.1|A network traffic monitoring tool libsepol|2.5-10.el7|SELinux binary policy manipulation library epel-release|7-12|Extra Packages for Enterprise Linux repository configuration ...
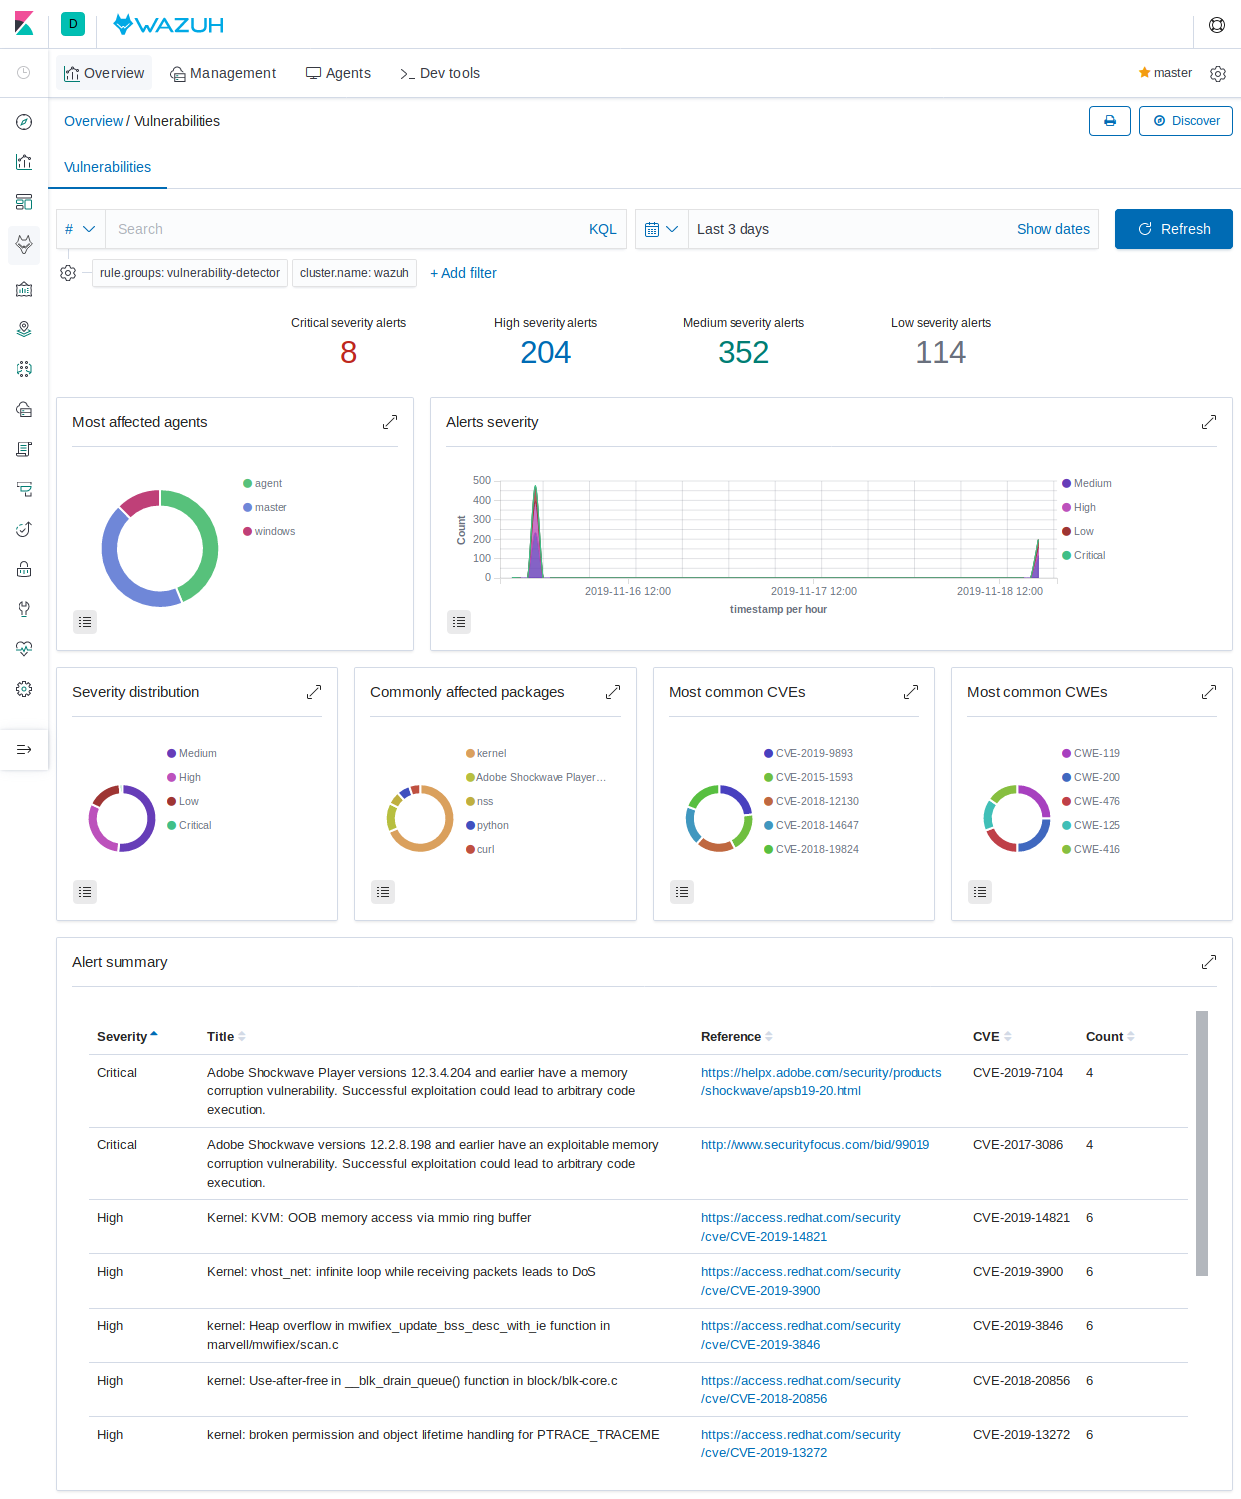
Wazuh Kibana Plugin
While the Wazuh API and SQLite databases let you get at the nitty-gritty data, usually the most beautiful place to see your vulnerability detection results is in the Wazuh Kibana plugin itself. Both in the Overview section as well as when you have drilled down into a specific agent, you can open the Vulnerabilities tab to see a nice dashboard of this information:
Optional exercise
You could create a CDB for escalating alerts about your own custom set of high priority CVEs. Write a child rule of Wazuh rule 23501 that looks for a match in this CDB and generates alerts of a high severity like 12. Consider how you might use a key/value CDB listing pairs of agent names and software package names that you want to especially keep an eye on. For example, you might want an escalated alert about high-level CVE matches on the "apache" software package on your Internet-facing web servers but not for other internal servers. The possibilities are endless...