Amazon GuardDuty
Amazon GuardDuty is a threat detection service that continuously monitors for malicious or unauthorized behavior to help you protect your AWS accounts and workloads. It monitors for activity such as unusual API calls or potentially unauthorized deployments that indicate a possible account compromise. GuardDuty also detects potentially compromised instances or reconnaissance by attackers.
Amazon configuration
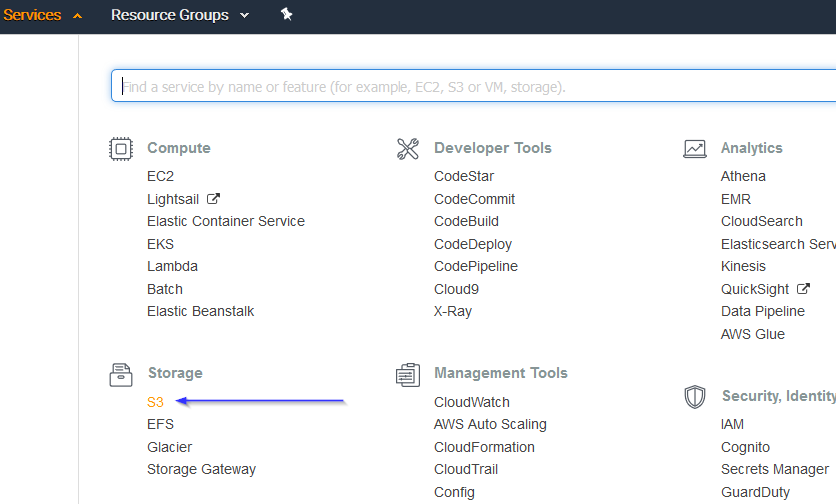
Go to Services > Storage > S3:
Click on the Create bucket:
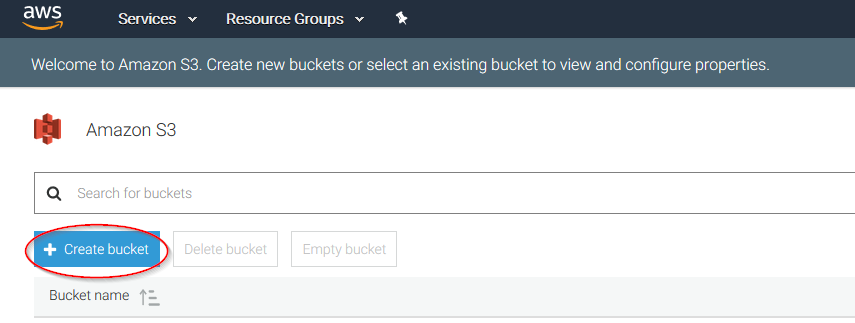
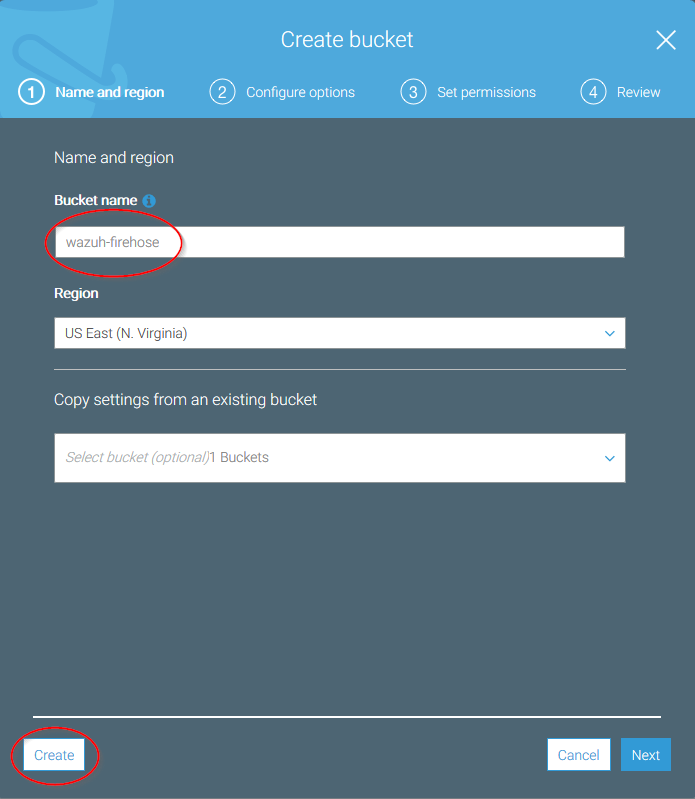
Create a new bucket, giving it a name and clicking on the Create button:
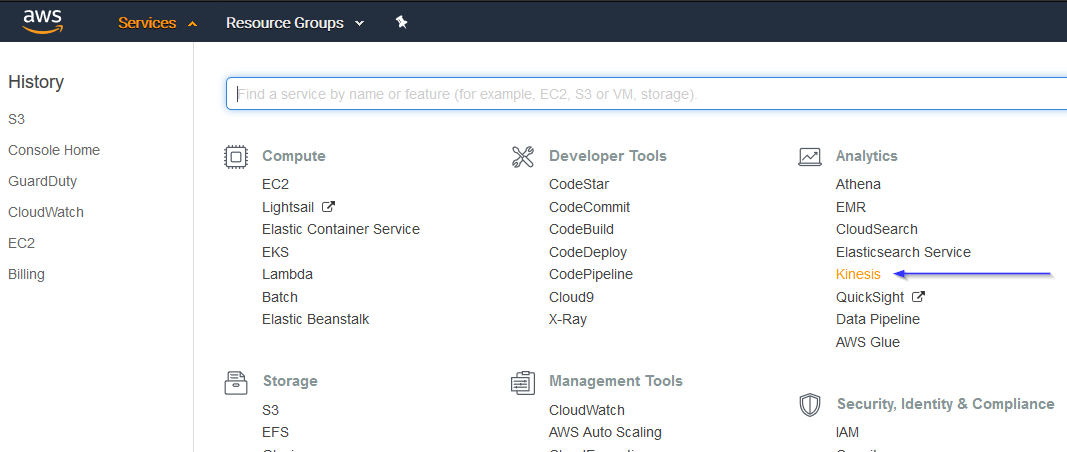
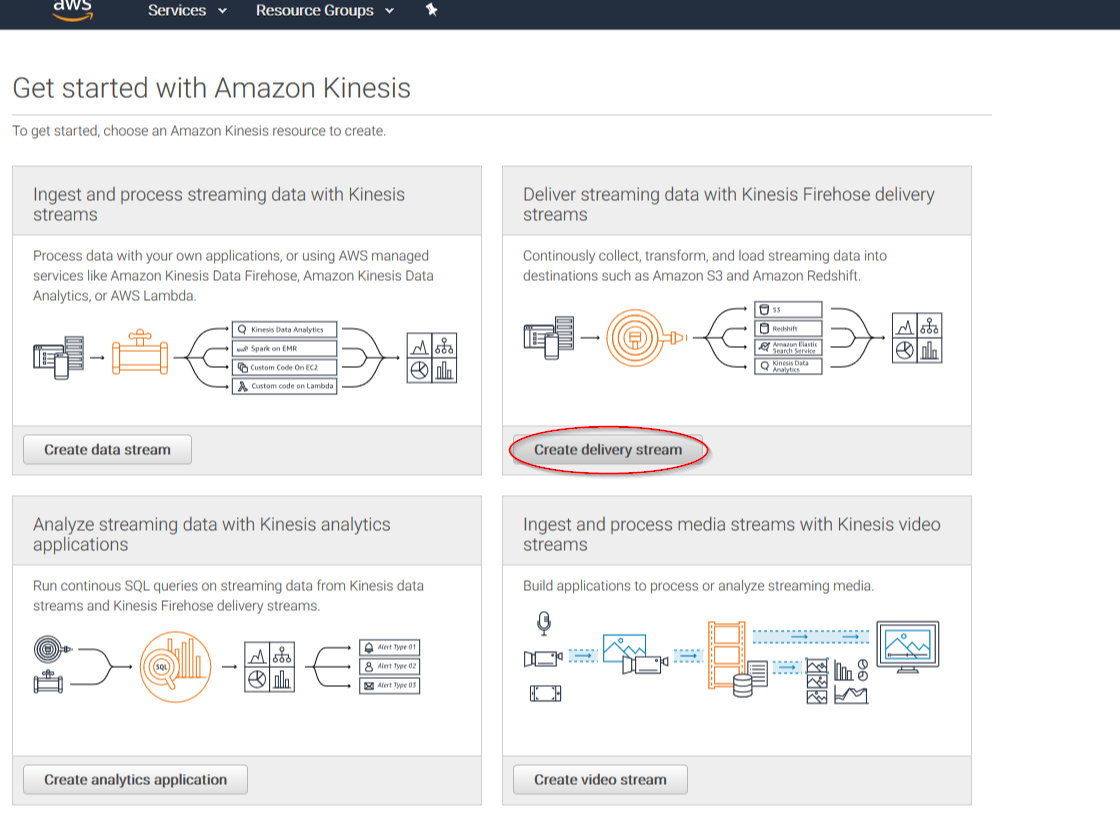
Go to Services > Analytics > Kinesis:
4.1. If it's the first time you're using this service, you'll see the following screen. Just click on Get started:
Click on Create delivery stream button:
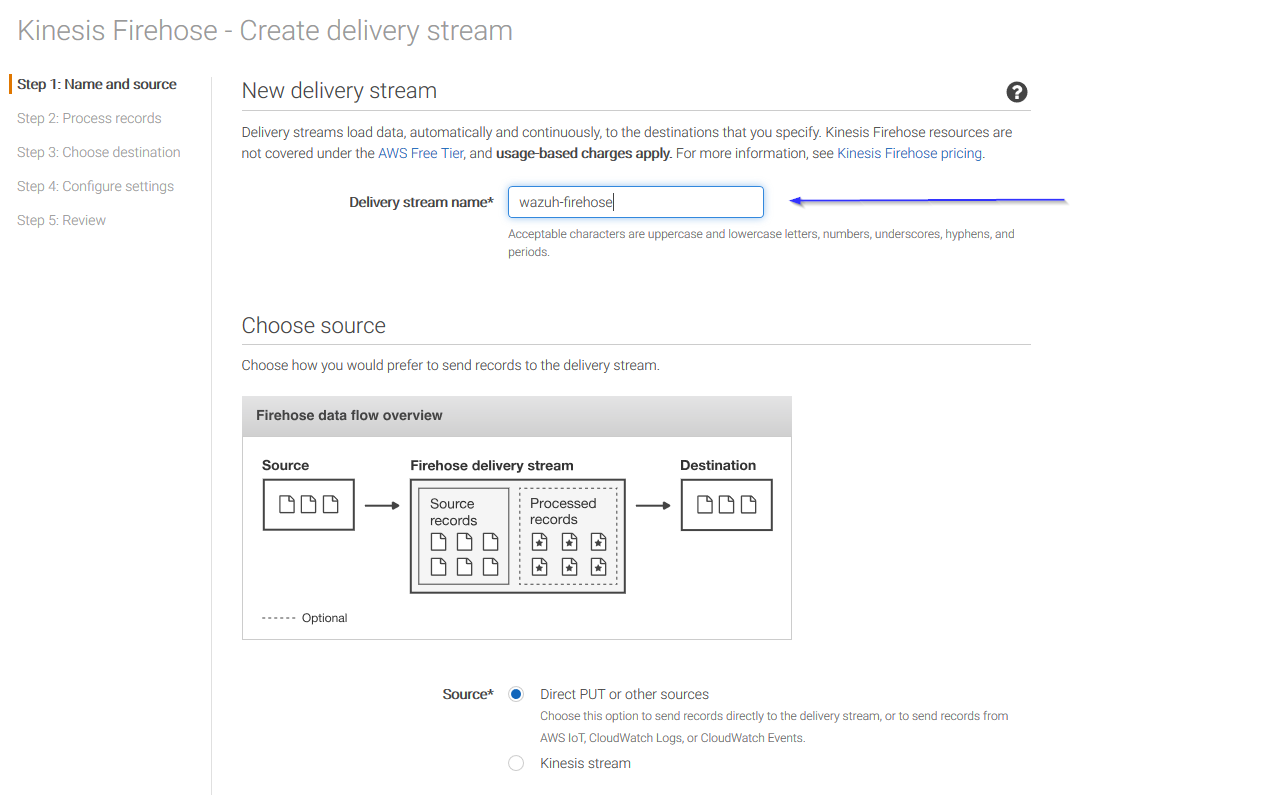
Put a name to your delivery stream and click on the Next button at the bottom of the page:
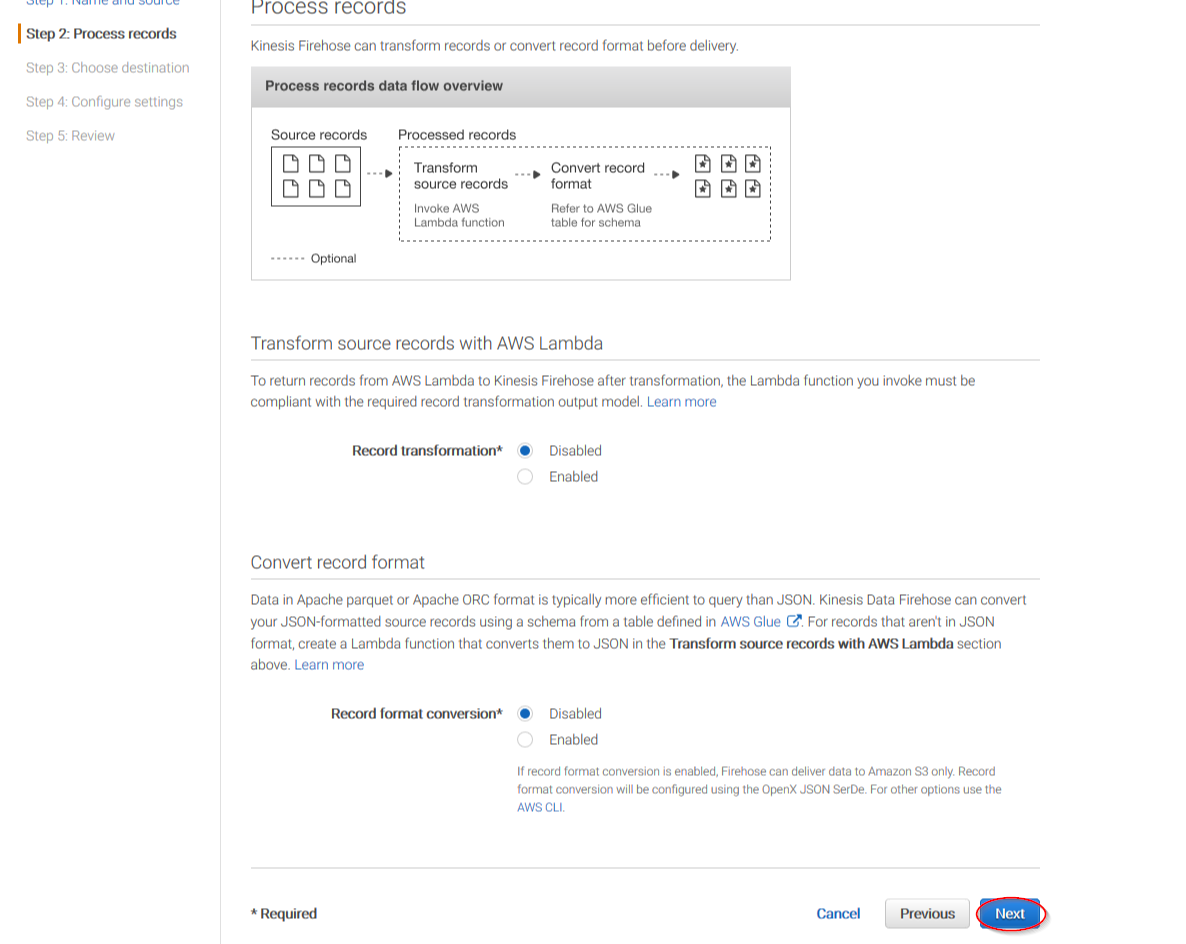
On the next page, leave both options as Disabled and click on Next:
Select Amazon S3 as destination, then select the previously created S3 bucket and add a prefix where logs will be stored. AWS Firehose creates a file structure YYYY/MM/DD/HH, if a prefix is used the created file structure would be firehose/YYYY/MM/DD/HH. If a prefix is used it must be specified under the Wazuh Bucket configuration:
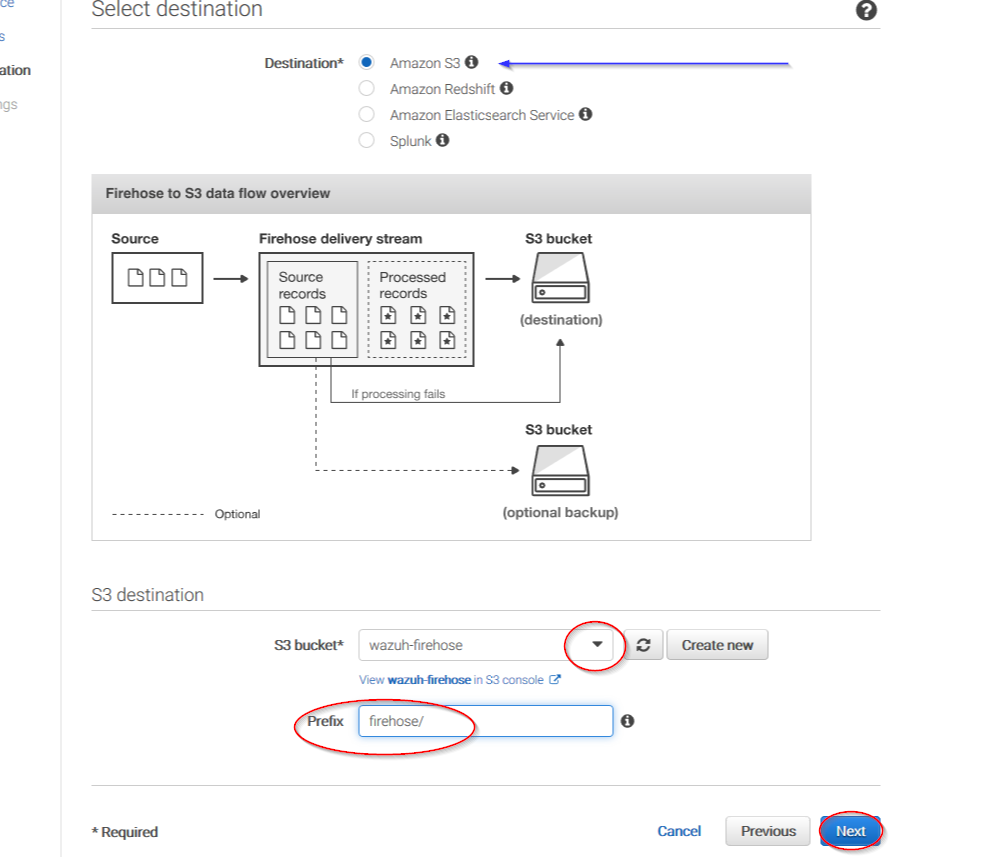
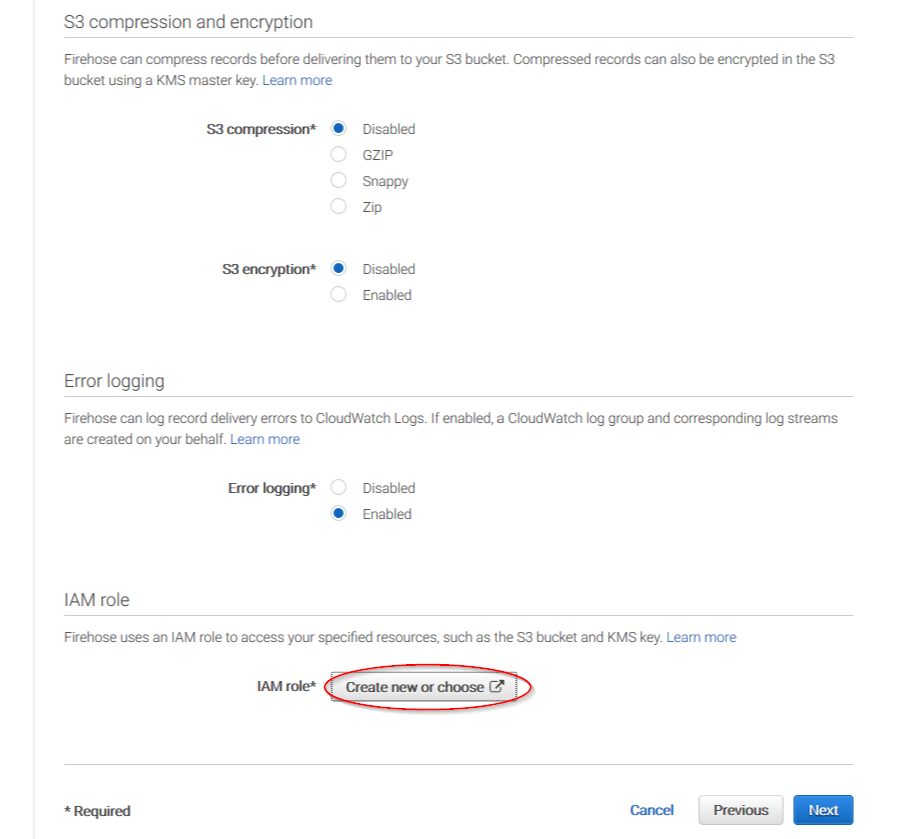
You can select which compression do your prefer. Wazuh supports any kind of compression but Snappy. After that, click on Create new or choose:
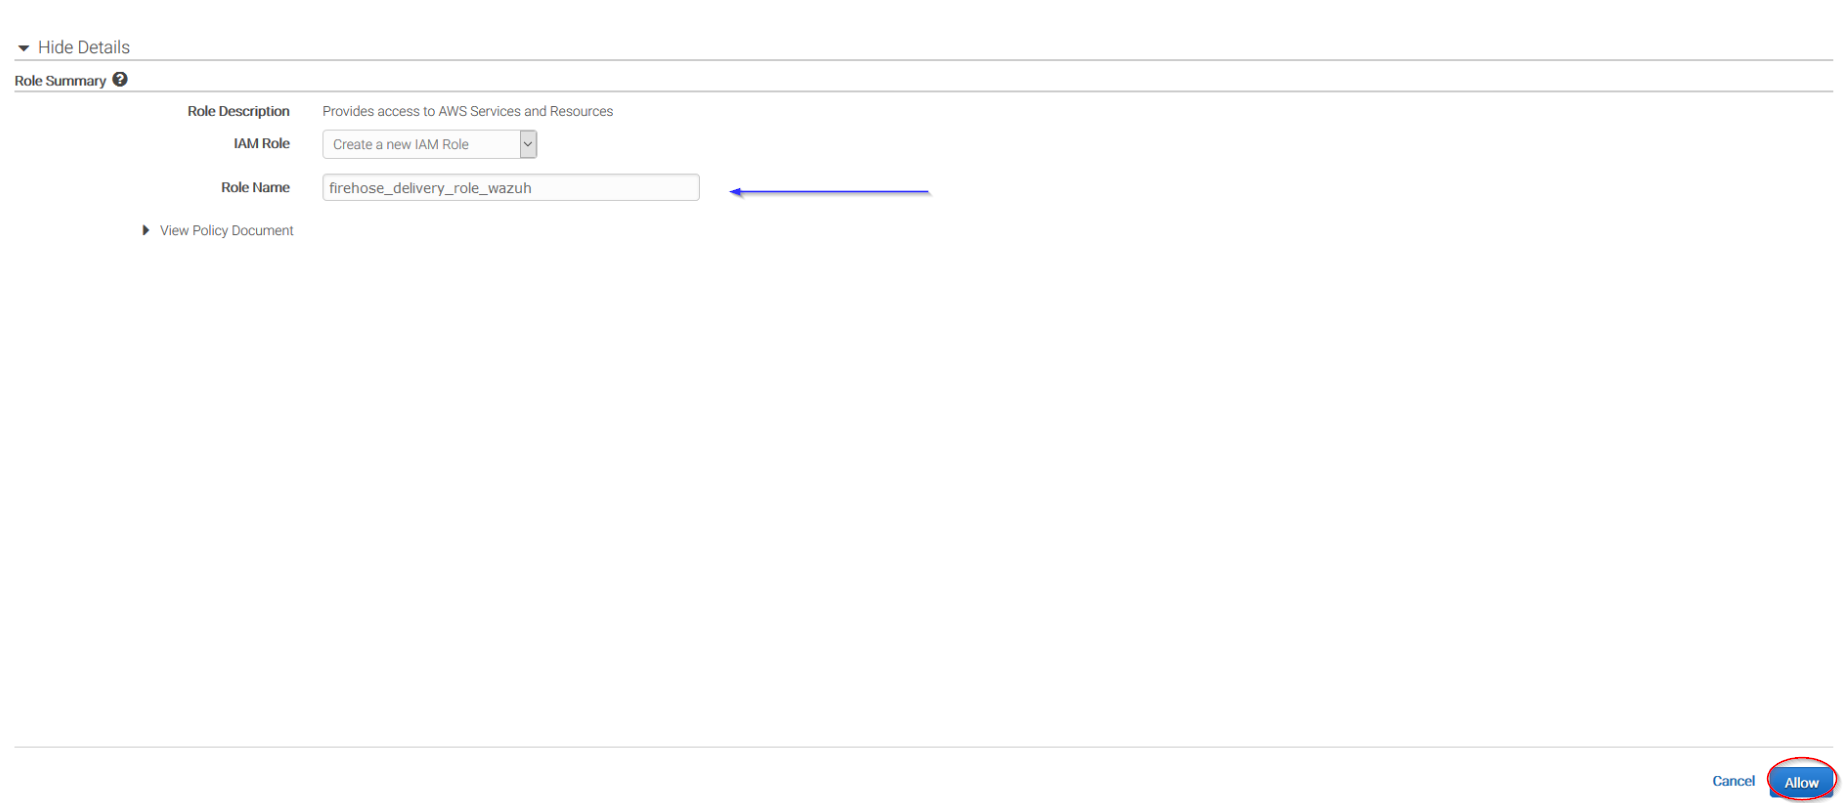
Give a proper name to the role and click on the Allow button:
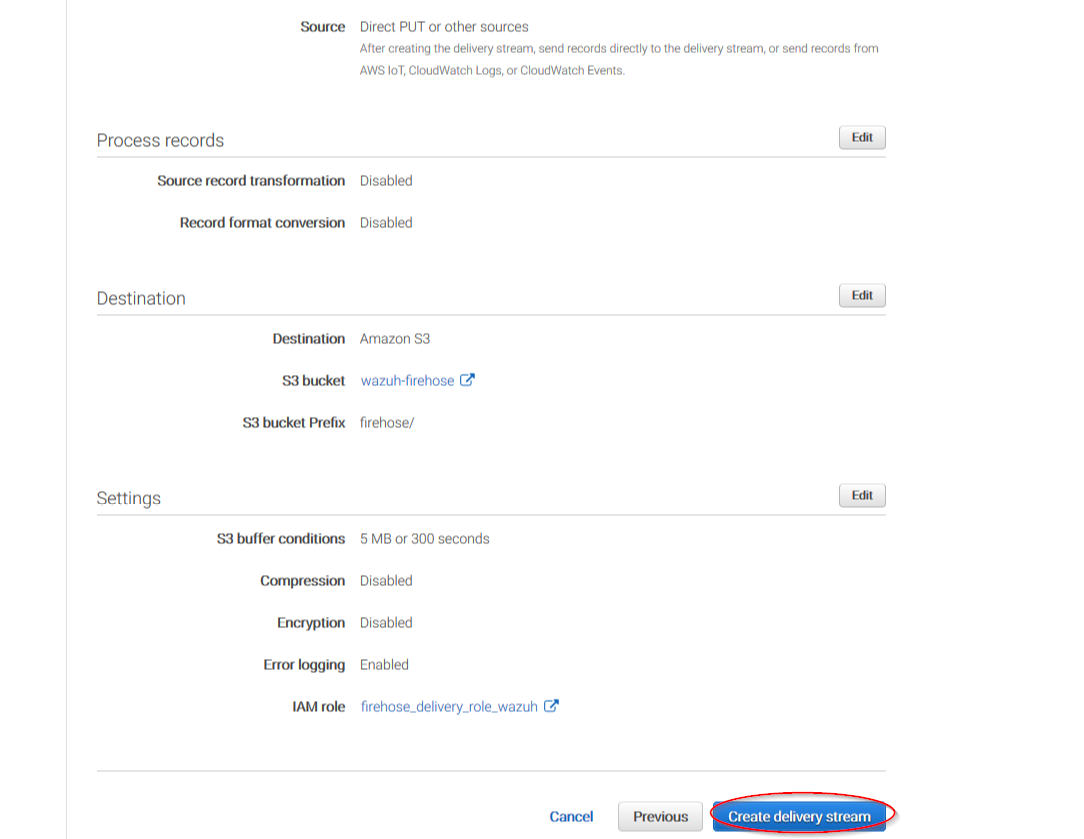
The following page is just a summary about the Firehose stream created, go to the bottom of the page and click on the Create delivery stream button:
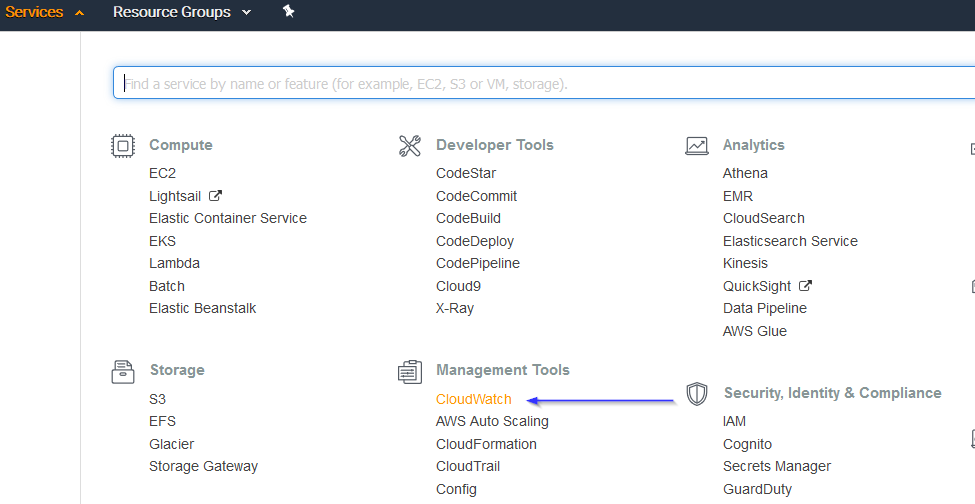
Go to Services > Management Tools > CloudWatch:
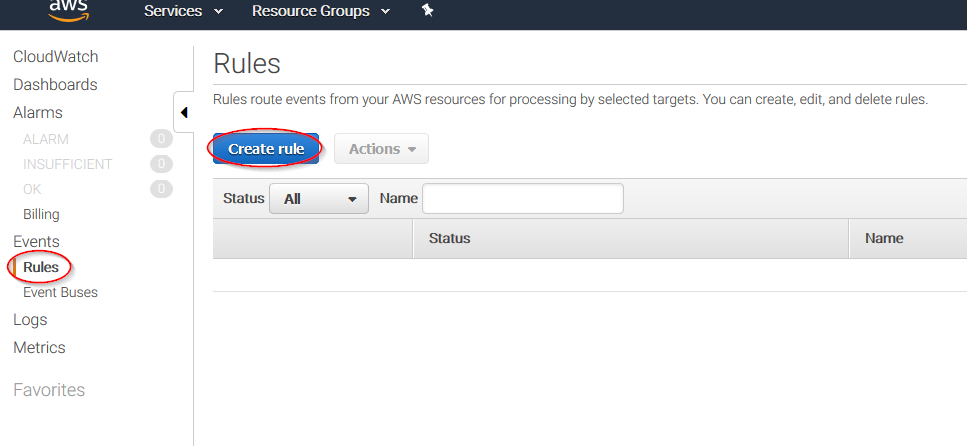
Select Rules on the left menu and click on the Create rule button:
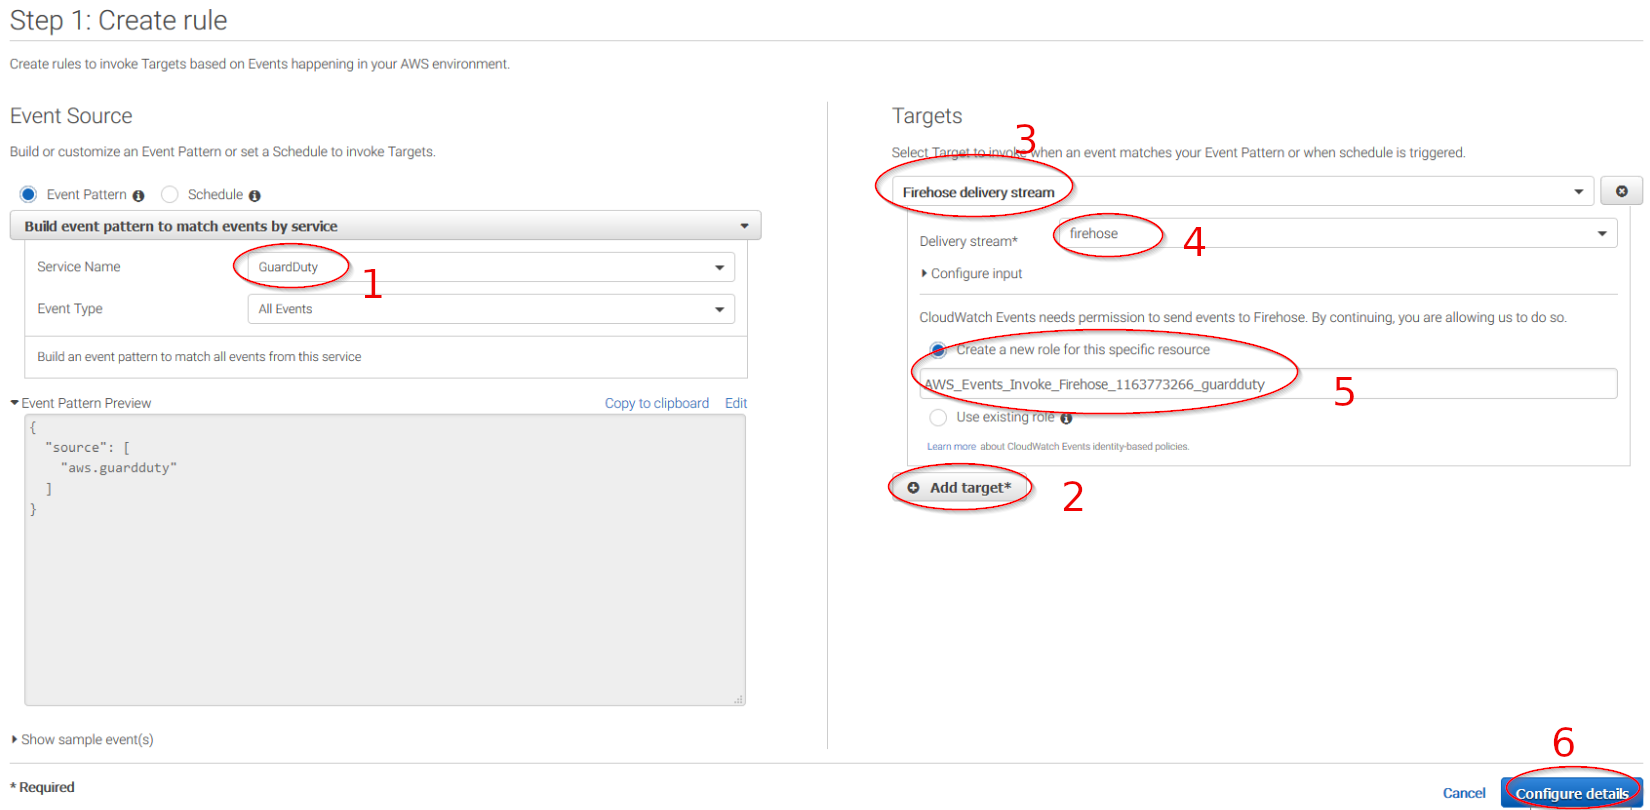
Select which service do you want to get logs from using the Service name slider, then, click on the Add target button and add the previously created Firehose delivery stream there. Also, create a new role to access the delivery stream:
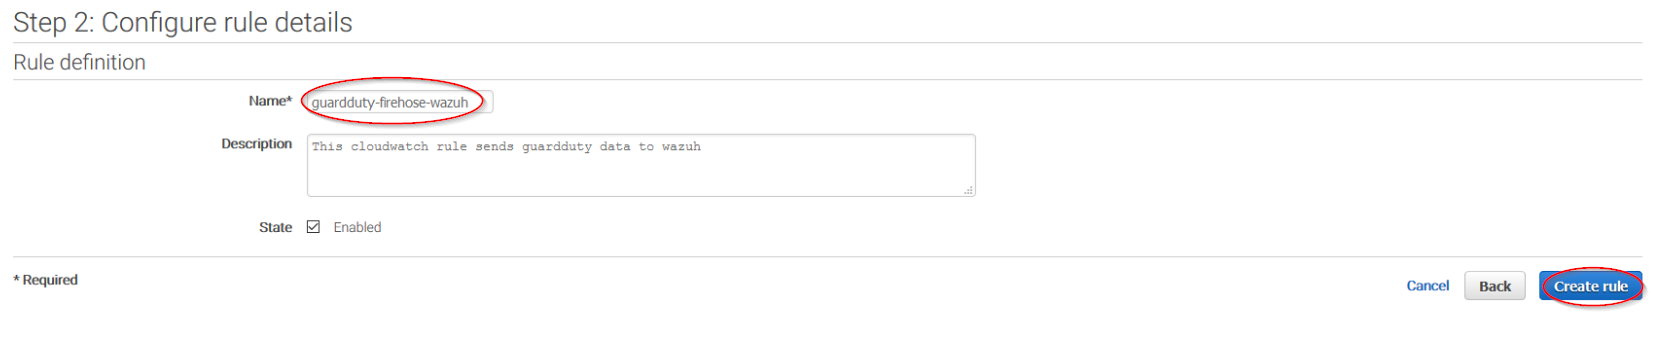
Give the rule some name and click on the Create rule button:
Once the rule is created, data will start to be sent to the previously created S3 bucket. Remember to first enable the service you want to monitor, otherwise you won't get any data.
Wazuh configuration
Open the Wazuh configuration file (
/var/ossec/etc/ossec.conf) and add the following block:
<wodle name="aws-s3">
  <disabled>no</disabled>
  <interval>10m</interval>
  <run_on_start>yes</run_on_start>
  <skip_on_error>yes</skip_on_error>
  <bucket type="guardduty">
    <name>wazuh-aws-wodle</name>
    <path>guardduty</path>
    <aws_profile>default</aws_profile>
  </bucket>
</wodle>
Note
Check the AWS S3 module reference manual to learn more about each setting.
Restart Wazuh in order to apply the changes:
If you're configuring a Wazuh manager:
For Systemd:
# systemctl restart wazuh-manager
For SysV Init:
# service wazuh-manager restart
If you're configuring a Wazuh agent:
For Systemd:
# systemctl restart wazuh-agent
For SysV Init:
# service wazuh-agent restart
Use cases
Amazon EC2 (Elastic Compute Cloud) provides scalable computing capacity in the cloud. When using this service, it is highly recommended to monitor it for intrusion attempts or other unauthorized actions performed against your cloud infrastructure.
Below are some use cases for Wazuh rules built for EC2.
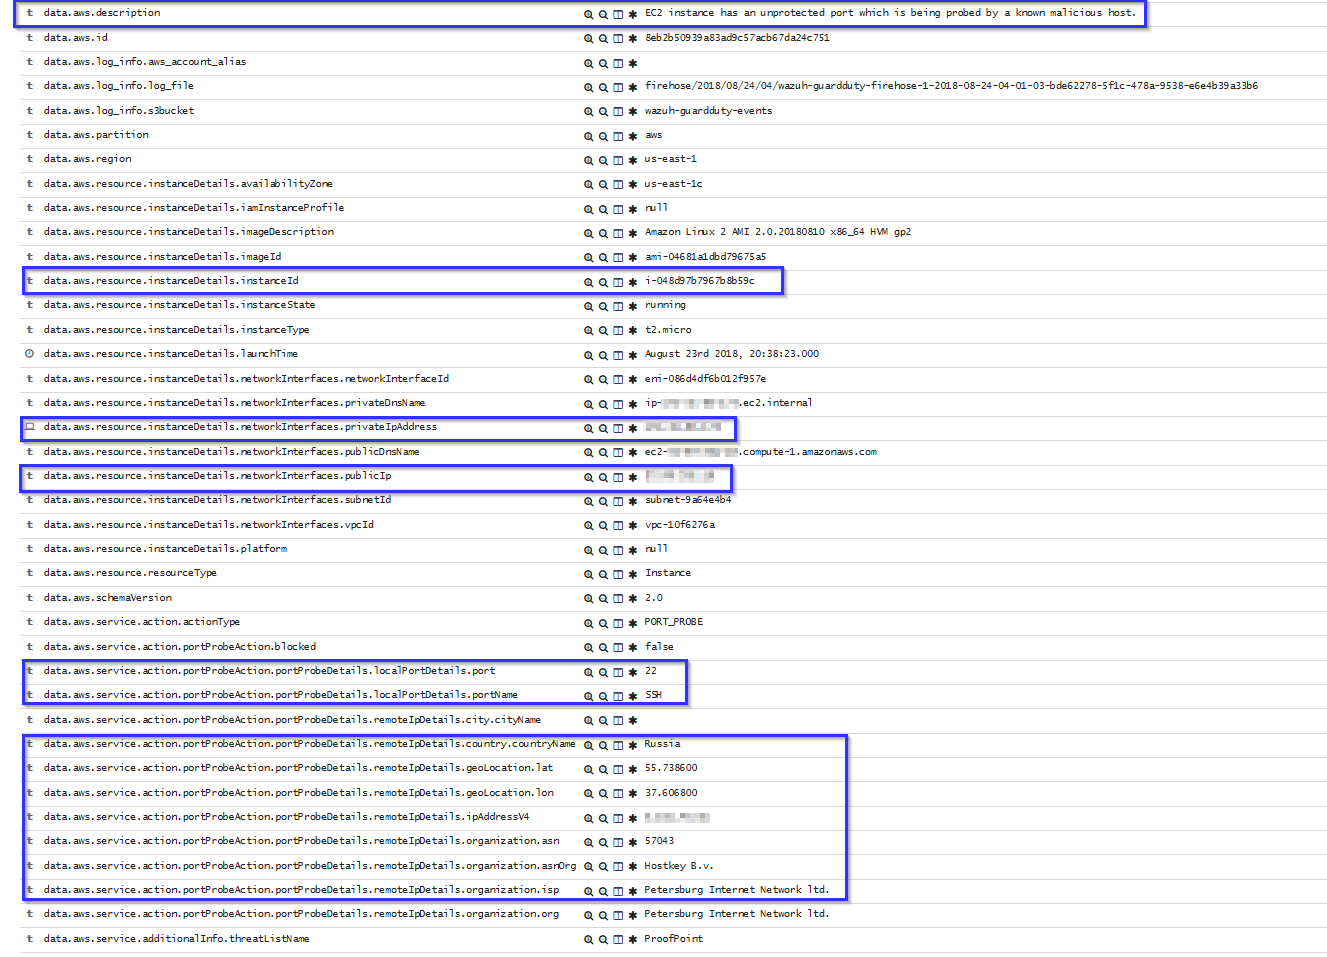
Brute force attacks
If an instance has any open port which is receiving a brute force attack, the following alert will be shown on Kibana. It shows information about the attacked host, about the attacker and which port is being attacked:
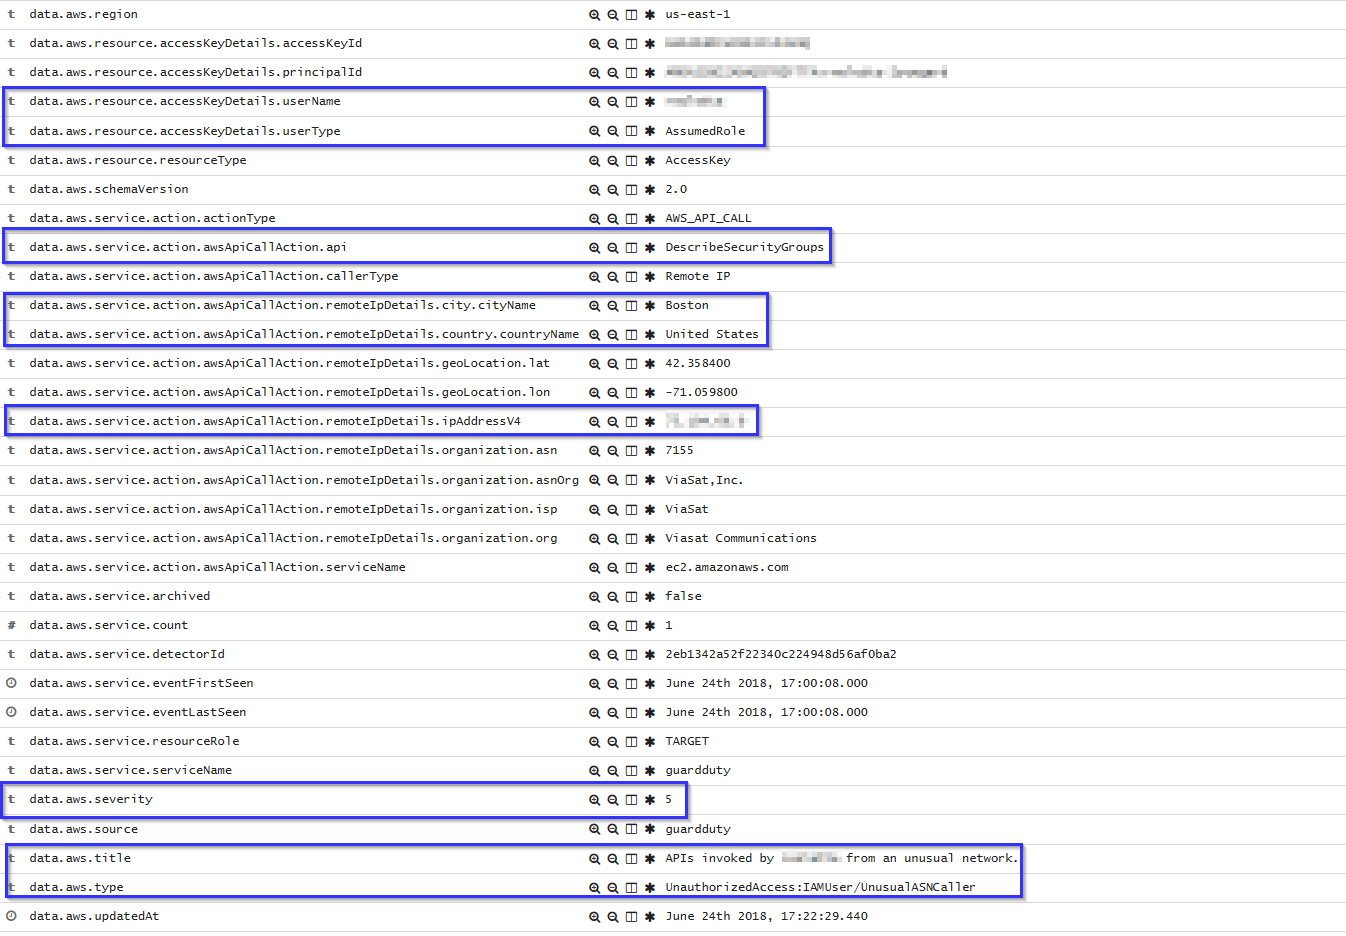
EC2 API Calls made from unsual network
If an API call is made from an unsual network, the following alert will be shown on Kibana. It shows the location of the unusual network, the user who did the API calls and which API calls it did:
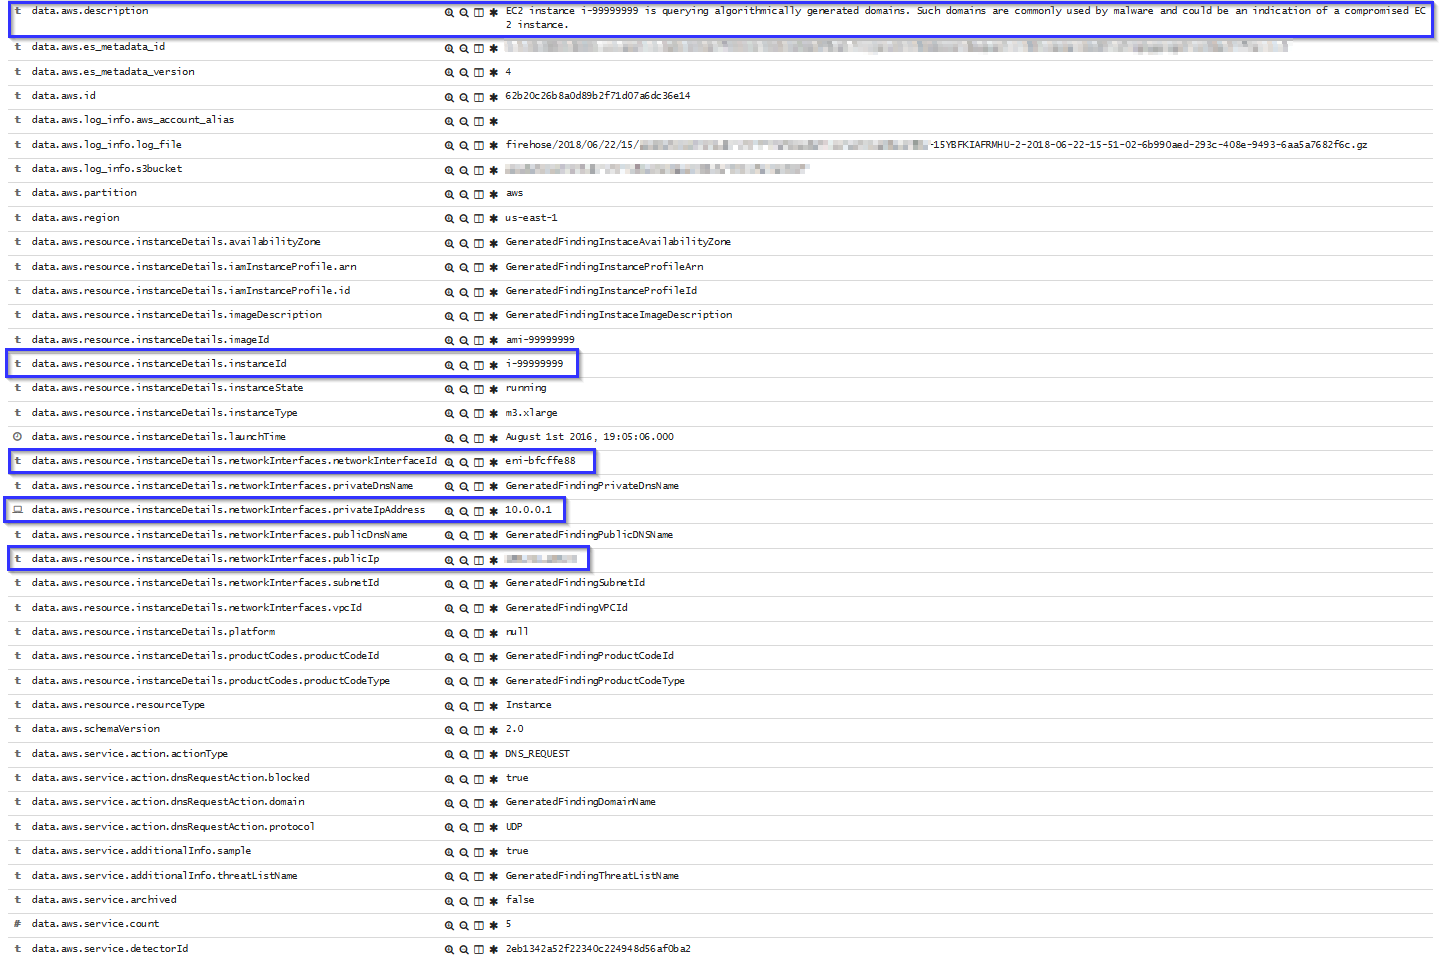
Compromised EC2 instance
If there is any indicator of a compromised EC2 instance, an alert will be shown on Kibana explaining what's happening. Some example of alerts are shown below:
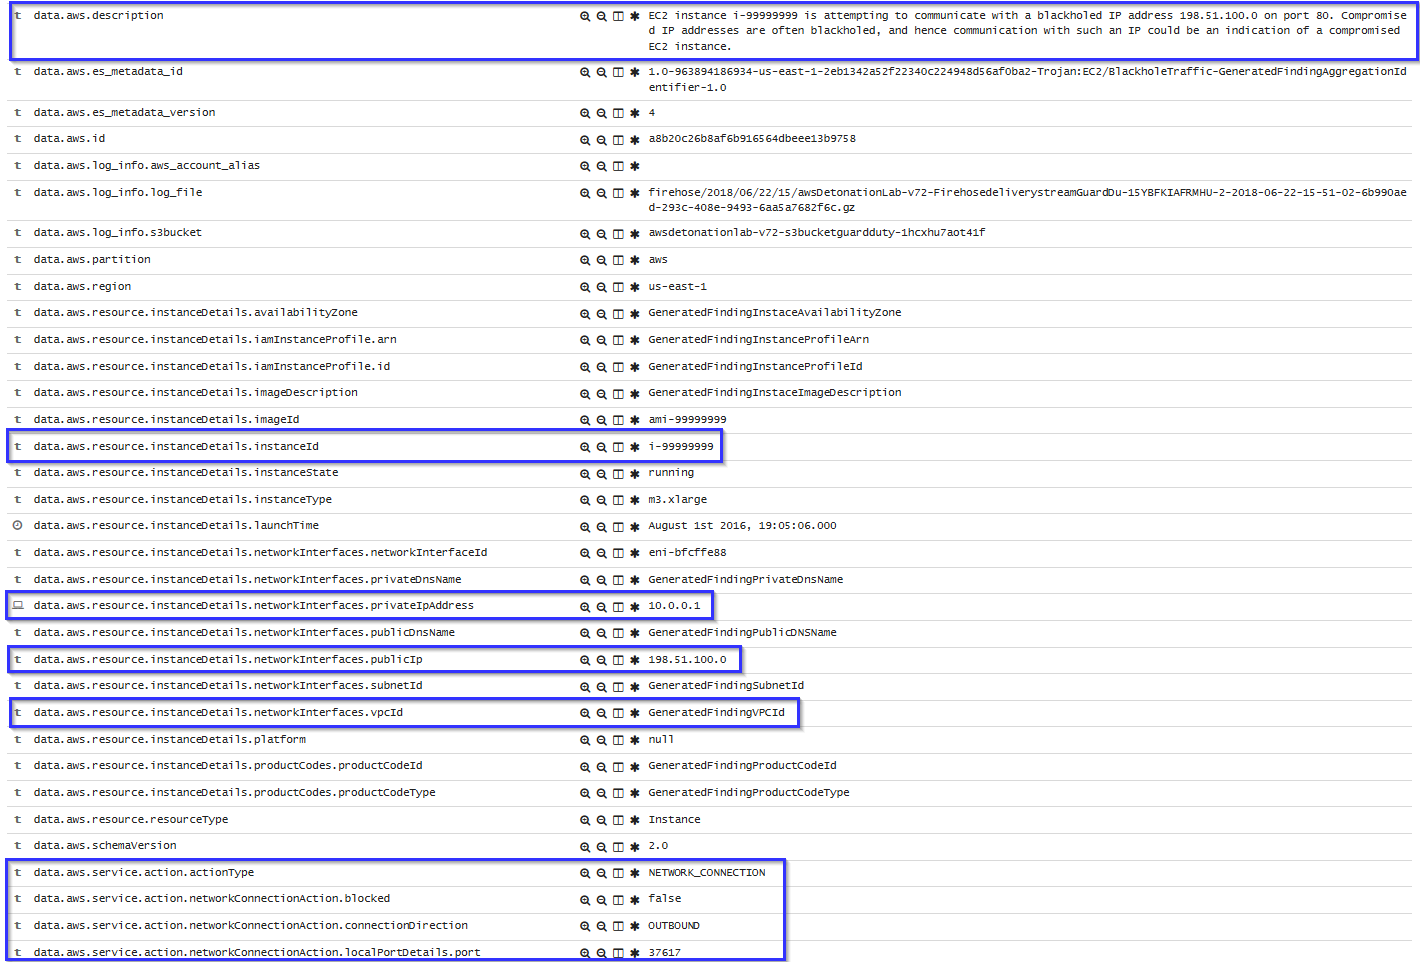
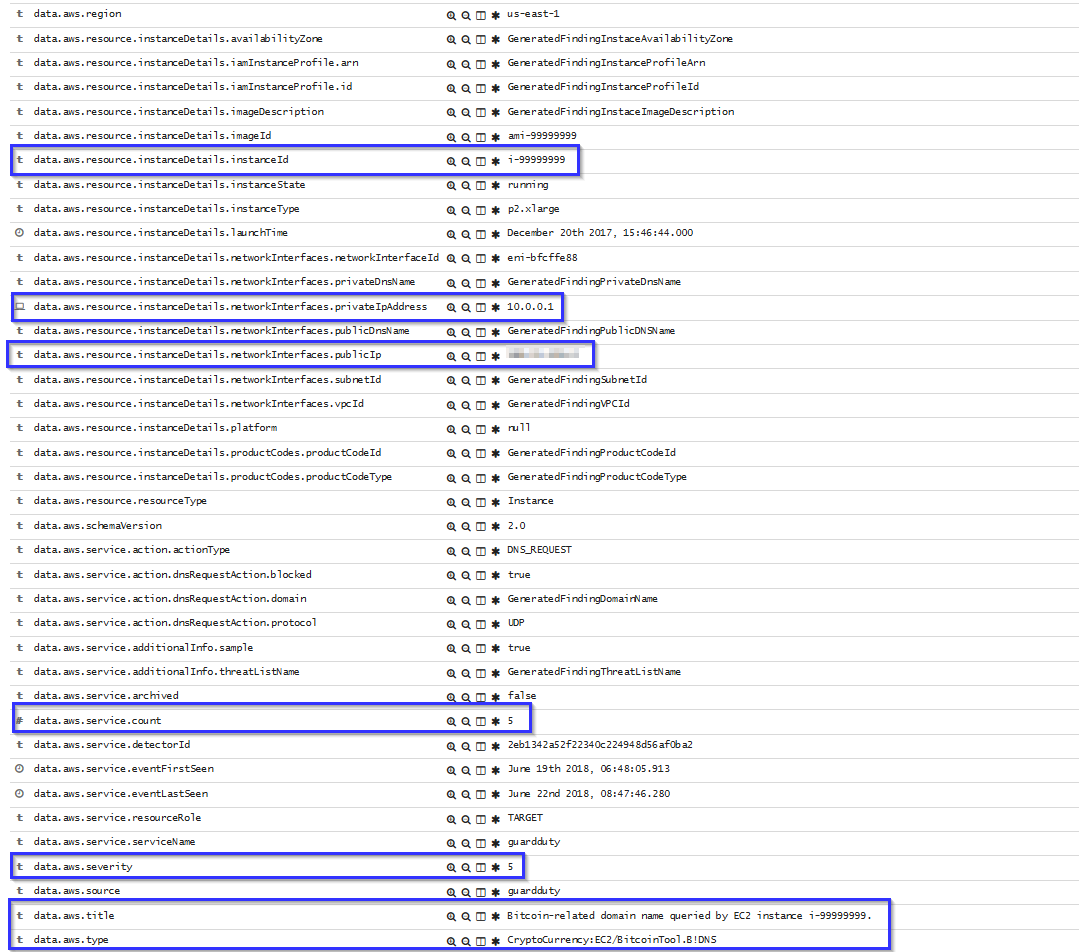
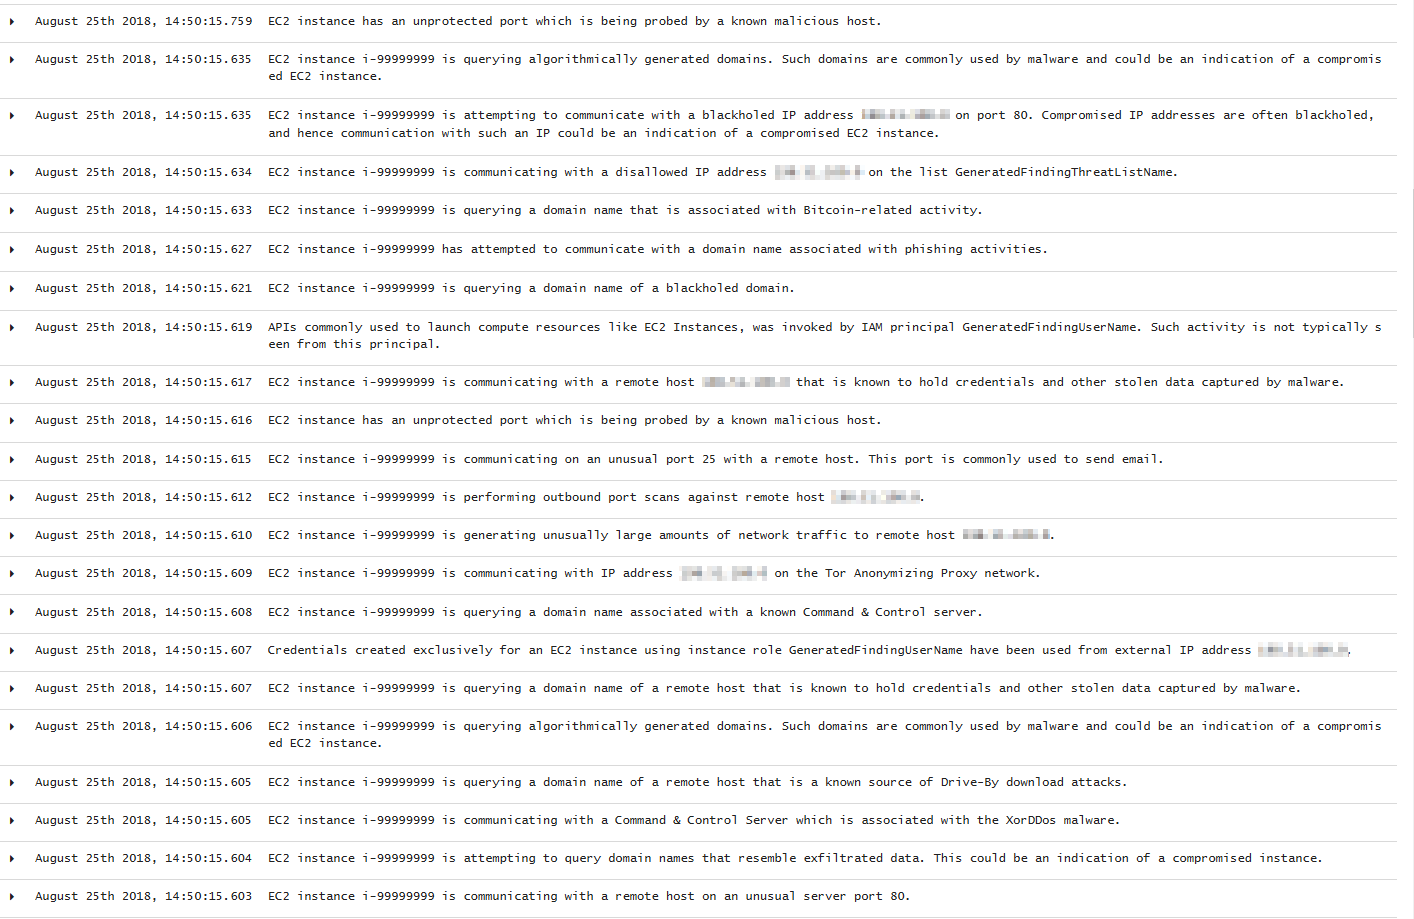
To sum up, the following screenshot shows some alerts generated for a compromised EC2 instance:
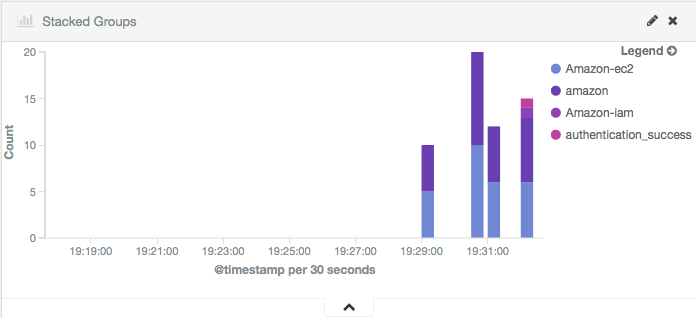
And here are the Kibana dashboards for EC2 events:
Pie Chart |
Stacked Groups |
|---|---|

|
|