3.7.0 Release notes
This section shows the most relevant improvements and fixes in version 3.7.0. More details about these changes are provided in each component changelog:
Adding agents to multiple groups
One of the major enhancements of this new version consists of adding agents to more than one group simultaneously.
With this improvement, now the agents can be set up using multiple configuration files, and this makes possible to share specific configuration blocks between agents, making this process more powerful to configure the environment. The new feature allows consulting all the agent's group information with the agent_groups tool and on the app using the Wazuh API.
In this example, an agent is added to two new groups.
# curl -u foo:bar -X PUT "http://localhost:55000/agents/001/group/webserver?pretty"
{
  "error": 0,
  "data": "Group 'webserver' added to agent '001'."
}
# curl -u foo:bar -X PUT "http://localhost:55000/agents/001/group/apache?pretty"
{
  "error": 0,
  "data": "Group 'apache' added to agent '001'."
}
And on the API, it's possible to check all the groups the agent is added:
# curl -u foo:bar -X GET "http://localhost:55000/agents/001?pretty"
{
  "error": 0,
  "data": {
    "status": "Active",
    "configSum": "f993610d3e6d7bfd7c008b4fb6deb8a5",
    "group": [
      "default",
      "webserver",
      "apache"
    ],
    "name": "ag-windows-12",
    ...
  }
}
The agent will receive the configuration of all the groups where it has been added.
Learn more about this feature in the multiple groups' documentation.
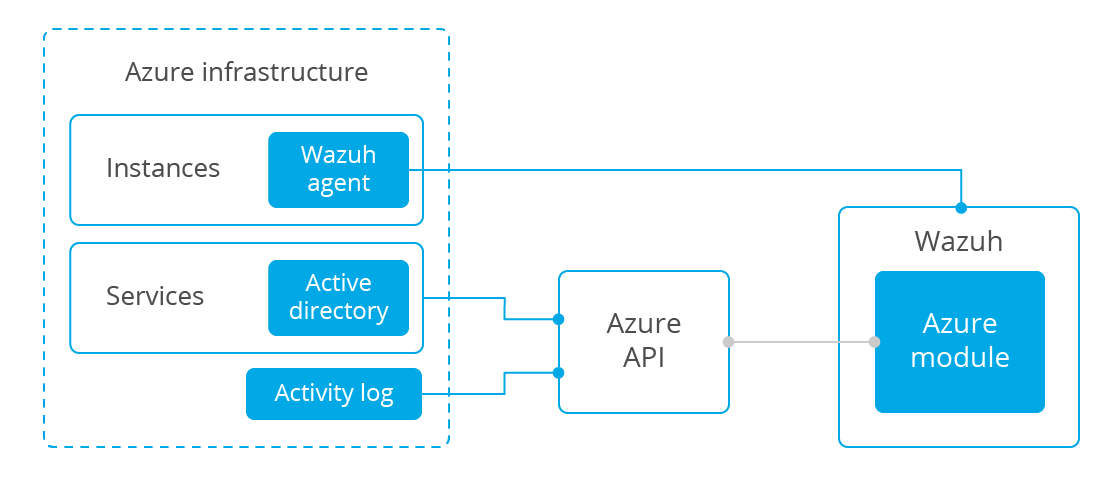
New module to monitor Microsoft Azure
The new azure-logs module for Wazuh has the ability to obtain and read Azure logs through several service APIs. This helps to monitor all the activity happening in the infrastructure, just by setting up the module to monitor the virtual machines that form the infrastructure, sending events to the Wazuh manager for analysis.
There are several ways to monitor the Azure instances:
Installing the Wazuh agent on the instances.
Monitoring the instances activity through Azure APIs. This includes data about all resource operations (creation, update, and deletion), Azure notifications about the instances, suspicious file executions, health checks, autoscaling events, and so on.
Monitoring the Azure Active Directory service. Monitoring management actions such as creation, update or deletion of users. It's possible to receive alerts on the Wazuh manager when some of these events occur on the Azure infrastructure.
To learn more about this new module and how to configure it, check out the section Using Wazuh to Monitor Microsoft Azure.
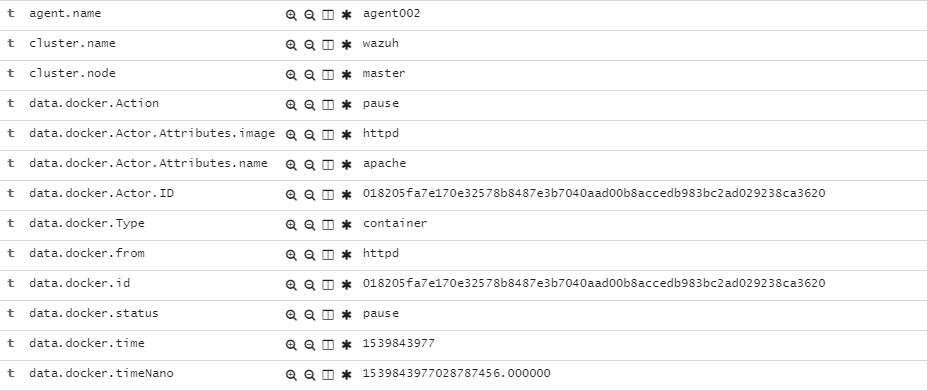
New module to monitor Docker
The new docker module for Wazuh makes easier to monitor and collect the activity from Docker containers such as creation, running, starting, stopping or pausing events.
In addition to this, and as always, the Wazuh agent can be used to monitor more services and events from the Docker servers, like File integrity or Log data collection.
In this example, the Docker command docker pause apache will stop the container apache and will trigger an alert, as seen on the screenshot below from the Wazuh app for Kibana:
To learn more about this new module and how to configure it, check out the section Using Wazuh to Monitor Docker.
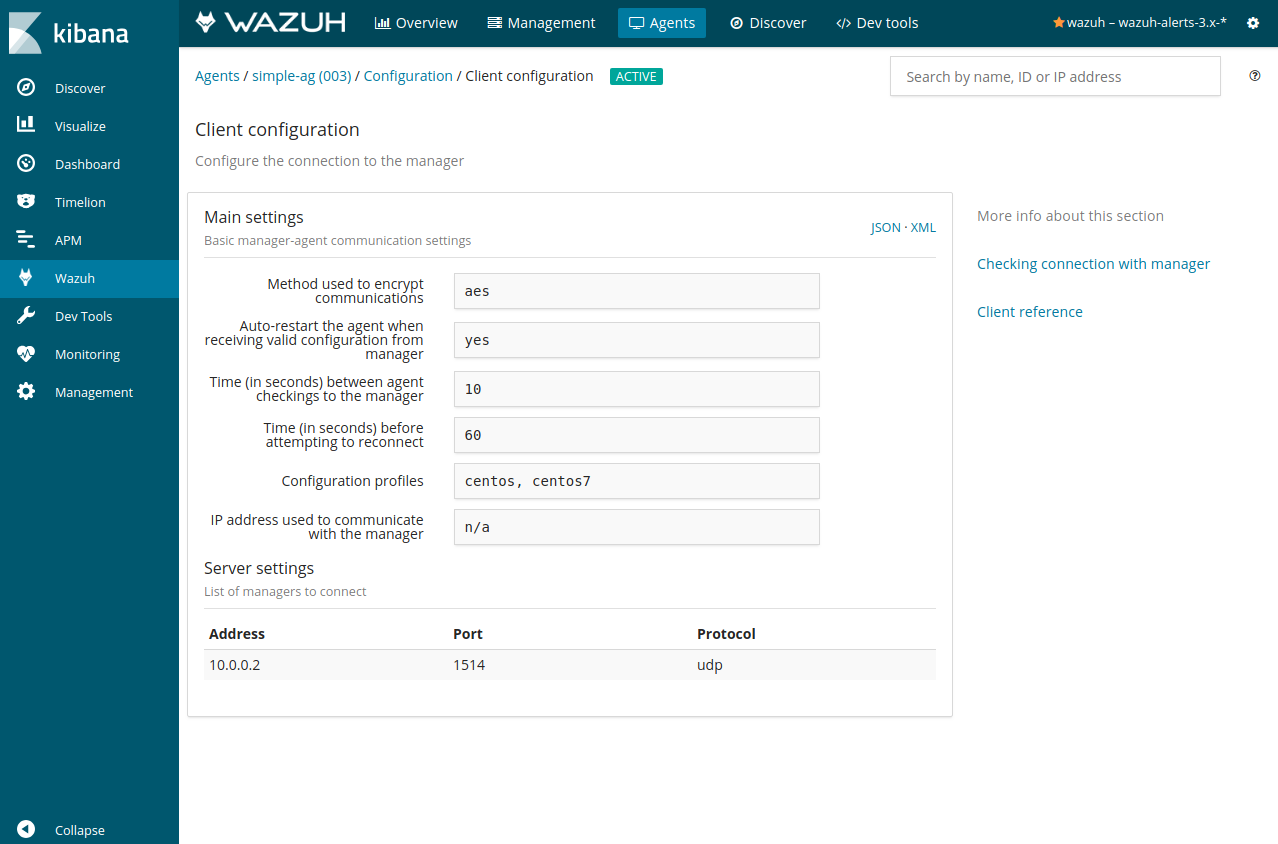
Query remote configuration
It's now possible to query for the agent configuration in real time.
These on-demand queries allow searching for the currently applied configuration on the manager and each agent in every moment. As seen on the screenshot below with some basic agent information, this query lets to check the current settings about every enabled module.
Improved performance of FIM and Analysis engines
The Analysis and Integrity Monitoring engines have been enhanced with multithreaded processing. It takes advantage of all manager host's resources by processing events in parallel, getting more performance at lower cost.
The registries generated by the File Integrity Monitoring system are now stored on a new SQLite database. Besides, the required storage resources have been reduced, making it faster and more efficient.
Breaking changes
The old File Integrity Monitoring plain text databases are no longer in use. After the upgrading process, it's necessary to execute the migration script in order to preserve the previous FIM entries.
Distributed API requests in cluster mode
The cluster capabilities were improved to allow distributed API requests. Now the nodes communicate between them to collect information, such as agents status or logs, providing data related to the global architecture, instead of a single instance.
In addition to this, the last keep alive checks on the cluster nodes have been improved, disconnecting them if they don't have internet connection during a certain amount of time.
Advanced API filtering using queries
In this version, the Wazuh API includes a new filtering system. The q parameter allows requesting information using advanced queries with logical operators and separators. Find a more detailed explanation of this feature in the API queries section.
New features for Kibana plugin
The Wazuh app for Kibana includes new features and interface redesigns to make use of the new features included in this version:
Get the current manager/agent configuration on the redesigned tabs.
Added support for multiple groups feature.
The Amazon AWS tab has been redesigned to include better visualizations and the module configuration.
The new Osquery extension shows scans results from this Wazuh module.
Added a new selector to check the cluster nodes’ status and logs on the Management > Status/Logs tabs.
Several bugfixes, performance improvements, and compatibility with the latest Elastic Stack version.
Breaking changes
Wazuh 3.7.0 introduces an update to the Elasticsearch template. This will cause a breaking change in existing installations, although new installations won't be affected by this error.
To learn more about how to fix this, check out the Kibana app's toubleshooting guide.
New features for Splunk plugin
The Wazuh app for Splunk also receives lots of new features and improvements on this new version. The Configuration tab is also improved as on the Kibana plugin to get the current manager/agent configuration, multiple groups support, and also:
A documentation article to set up a reverse proxy configuration for Nginx and the Splunk plugin is now available.
Added Dev tools, Amazon AWS, Osquery, Inventory data and Monitoring tabs to the app.
Added app logs to monitor to check and troubleshoot problems while using the app.
Added a new selector to check the cluster nodes’ status and logs on the Management > Status/Logs tabs.
Several bugfixes, performance improvements, and compatibility with the latest Splunk version.