Monitoring Activity
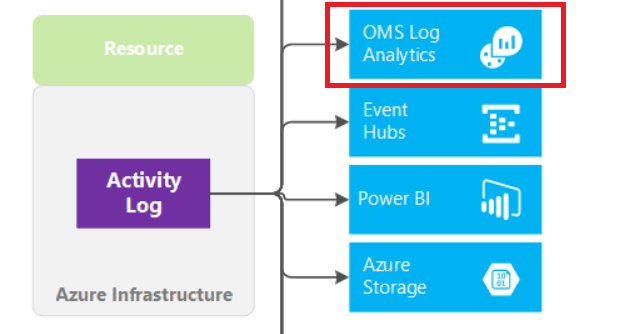
The Activity Log provides information on subscription level events that have occurred in Azure, with the following relevant information:
Administrative Data: Covers the logging of all creation, update, deletion and action operations performed through the Resource Manager. All actions performed by an user or application using the Resource Manager are interpreted as an operation on a specific resource type. Operations such as write, delete, or action involve logging both the start and the success or failure of that operation in the Administrative category. The Administrative category also includes any changes to the role-based access control of a subscription.
Alert Data: Contains the log of all activations of Azure alerts. For example we will be able to obtain an alert when the percentage of CPU usage of one of the virtual machines of the infrastructure exceeds a certain threshold. Azure provides the option to elaborate customized rules to receive notifications when an event coincides with the rule. When an alert is activated it is logged in the Activity Log.
Security Data: Here we contemplate the log of alerts generated by the Azure Security Center. For example, a log could be related to the execution of suspicious files.
Service HealthData: Covers the log of any service health incident that has occurred in Azure. There are five different types of health events: Action Required, Assisted Recovery, Incident, Maintenance, Information or Security, logged when a subscription resource is affected by the event.
Autoscale Data: Contains the logging of any event related to the autoscale engine based on the autoscale settings in your subscription. Autoscale start events and successful or failed events are logged in this category.
Recomendation Data: Includes Azure Advisor recommendation events.
To monitor the activities of our infrastructure we can use the Azure Log Analytics REST API or we can directly access the content of Azure Storage accounts. This section explains the two ways to proceed, looking at the steps to follow in the Microsoft Azure portal and using the azure-logs module on the Wazuh manager.
Using Azure Log Analytics
Azure Log Analytics is a service that monitors your infrastructure offering query capabilities that allow you to perform advanced searches specific to your data.
The Log Analytics solution helps you to analyze and search the Azure activity log in all your Azure subscriptions, providing information about the operations performed with the resources of your subscriptions.
We can consult all the data collected by Log Analytics through the Azure Log Analytics REST API. The Azure Log Analytics API uses the Azure Active Directory authentication scheme. Part of the installation guide is based on this tutorial.
In order to use Azure Log Analytics, we need to perform additional configuration on the Microsoft Azure portal. The goal is to have an application or client qualified to use the Azure Log Analytics REST API.
Register the application
Note
The process explained below details the creation of an application that will use the of Azure Log Analytics REST API. You can also configure an existing application, the process is similar from the creation of the application, in this case, start directly at step 1.2.
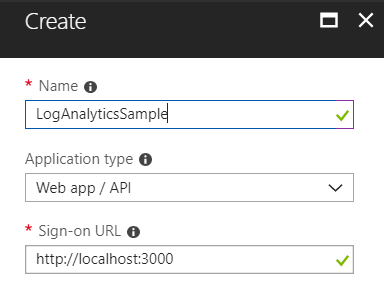
1. Creation of the application
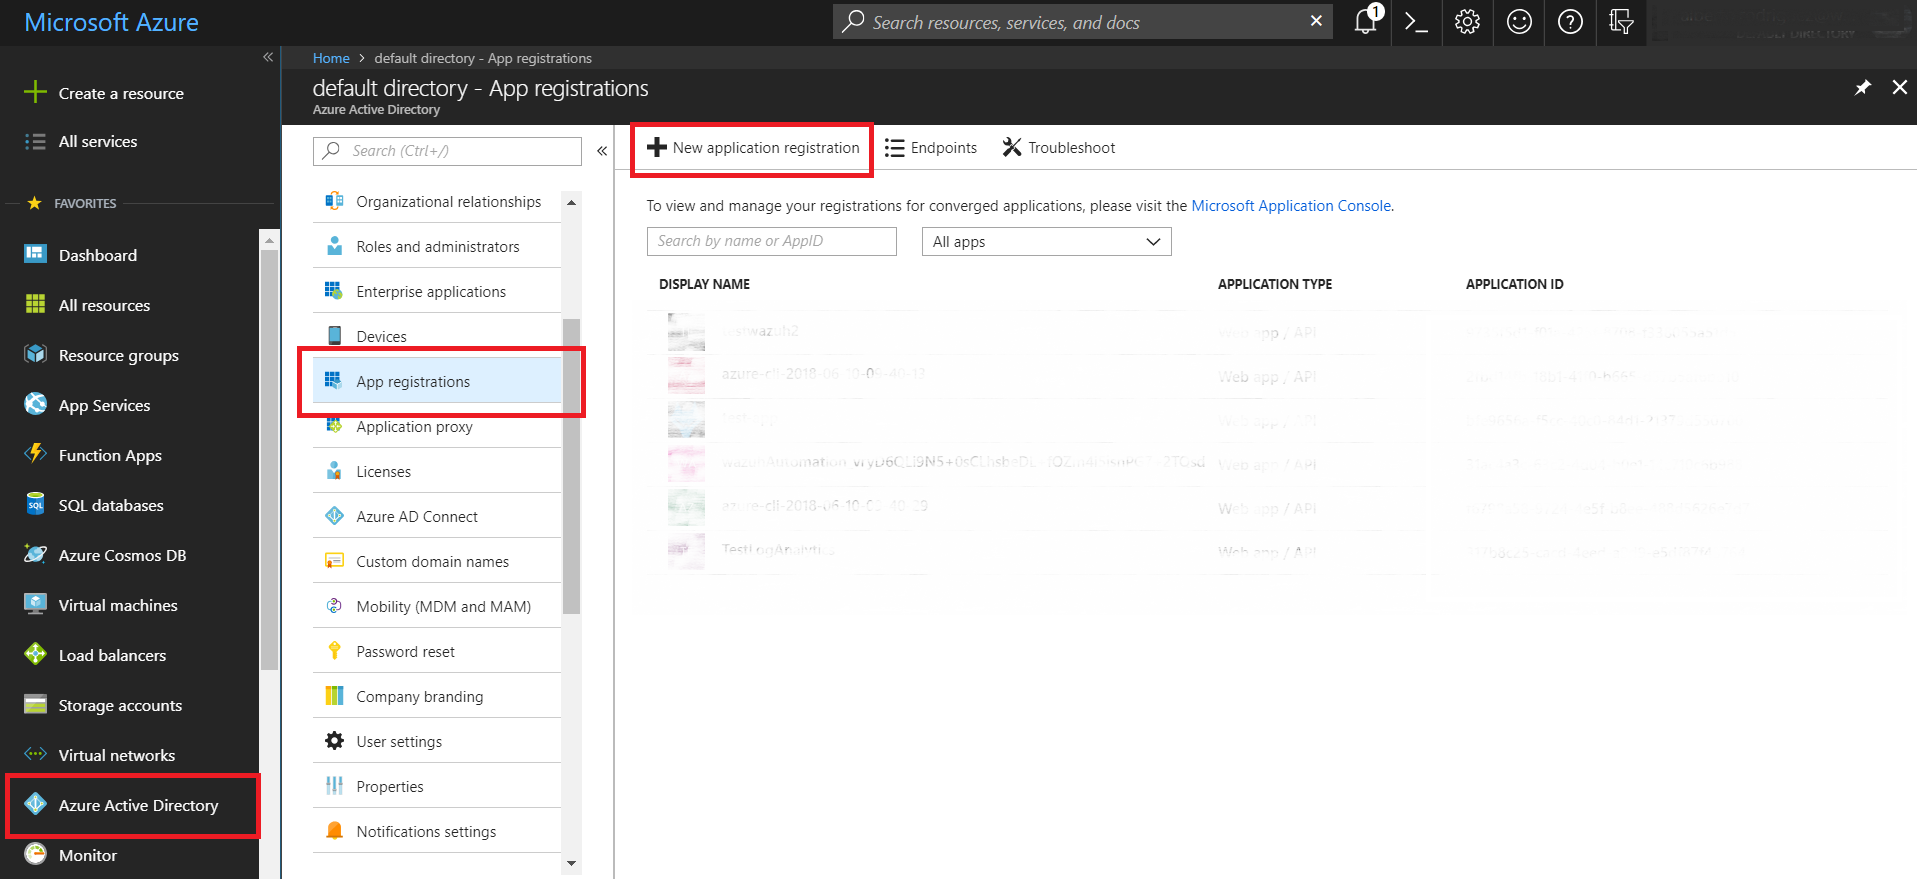
1.1 - In the Azure Active Directory section select the option App registrations and once inside, select New application registration.
1.2 - Proceed to create our application
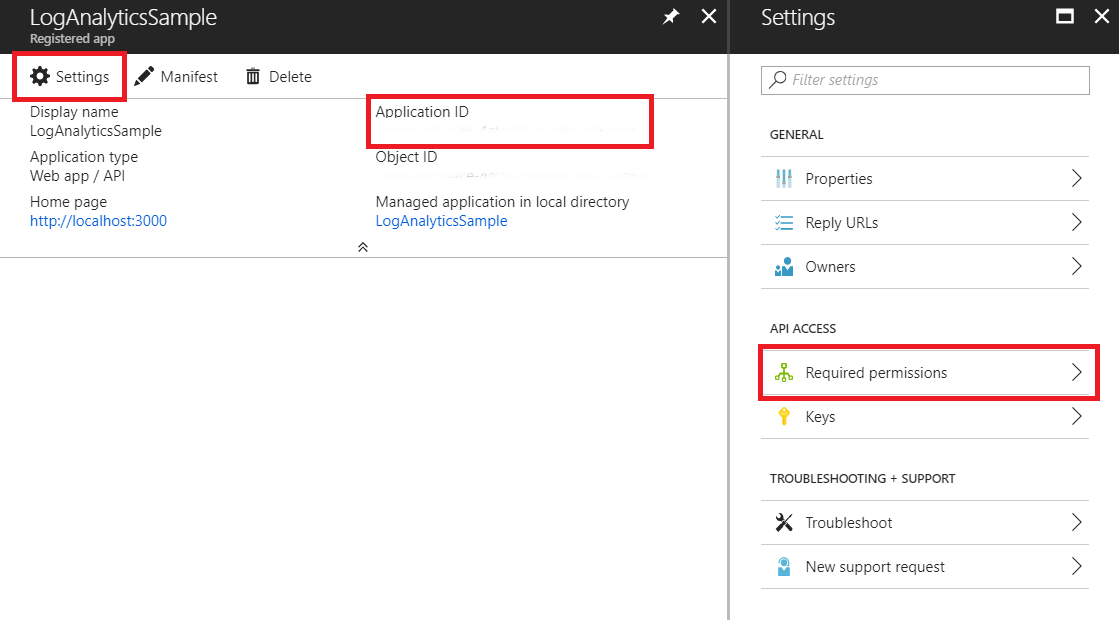
2. Giving permissions to the application
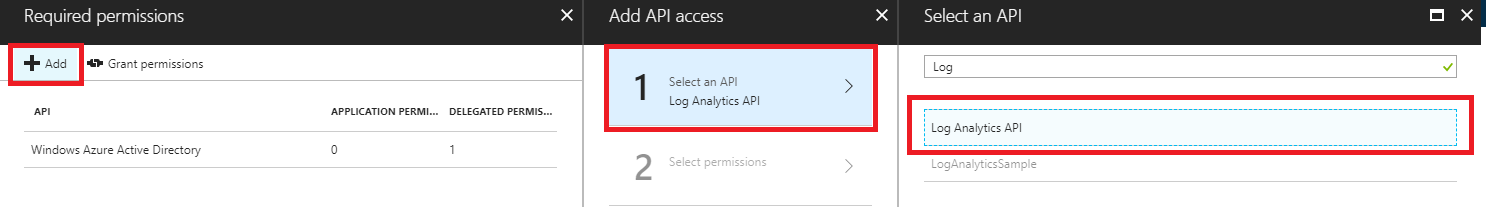
2.1 - Whether we have created a new application or are using an existing one, we need to access the application Settings and select Required permissions. Note that we can also see the Application ID, a necessary field to authenticate the application later.
2.2 - We choose the API we want to access.
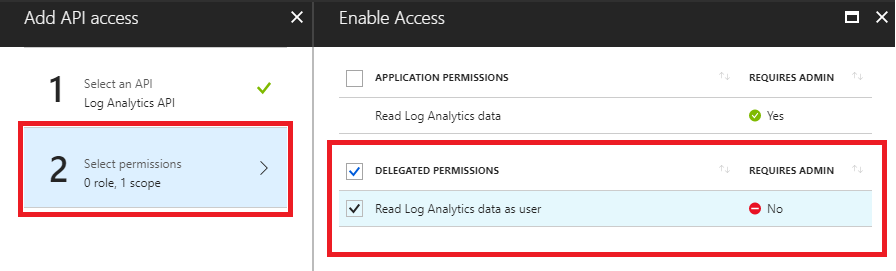
2.3 - Select the permissions. Choose the permissions you want to provide to the application.
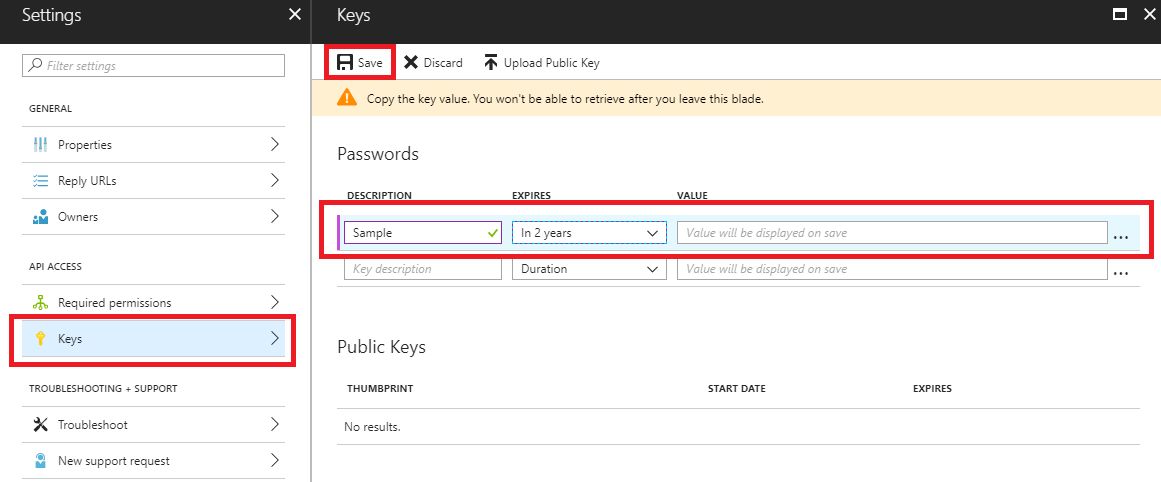
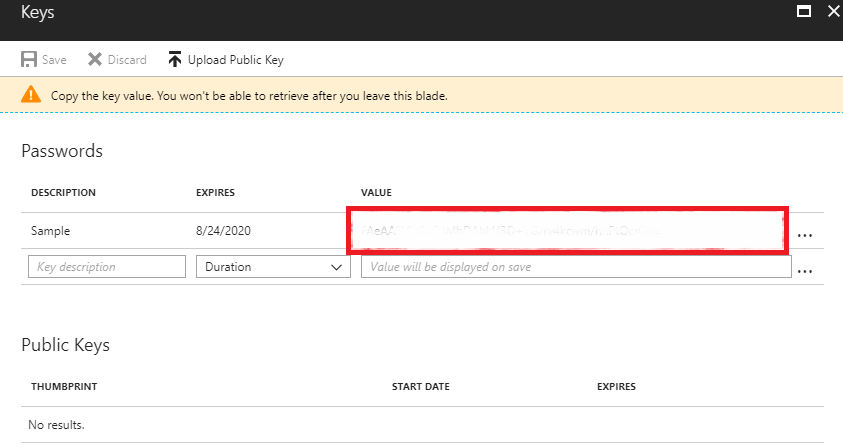
3. Obtaining the application key for authentication
3.1 - Select Keys and fill in the DESCRIPTION and EXPIRES fields. Once we save the key we will get its value. This will be the key with which we will authenticate our application in order to use the API.
4. Giving access to our application to the Log Analytics API
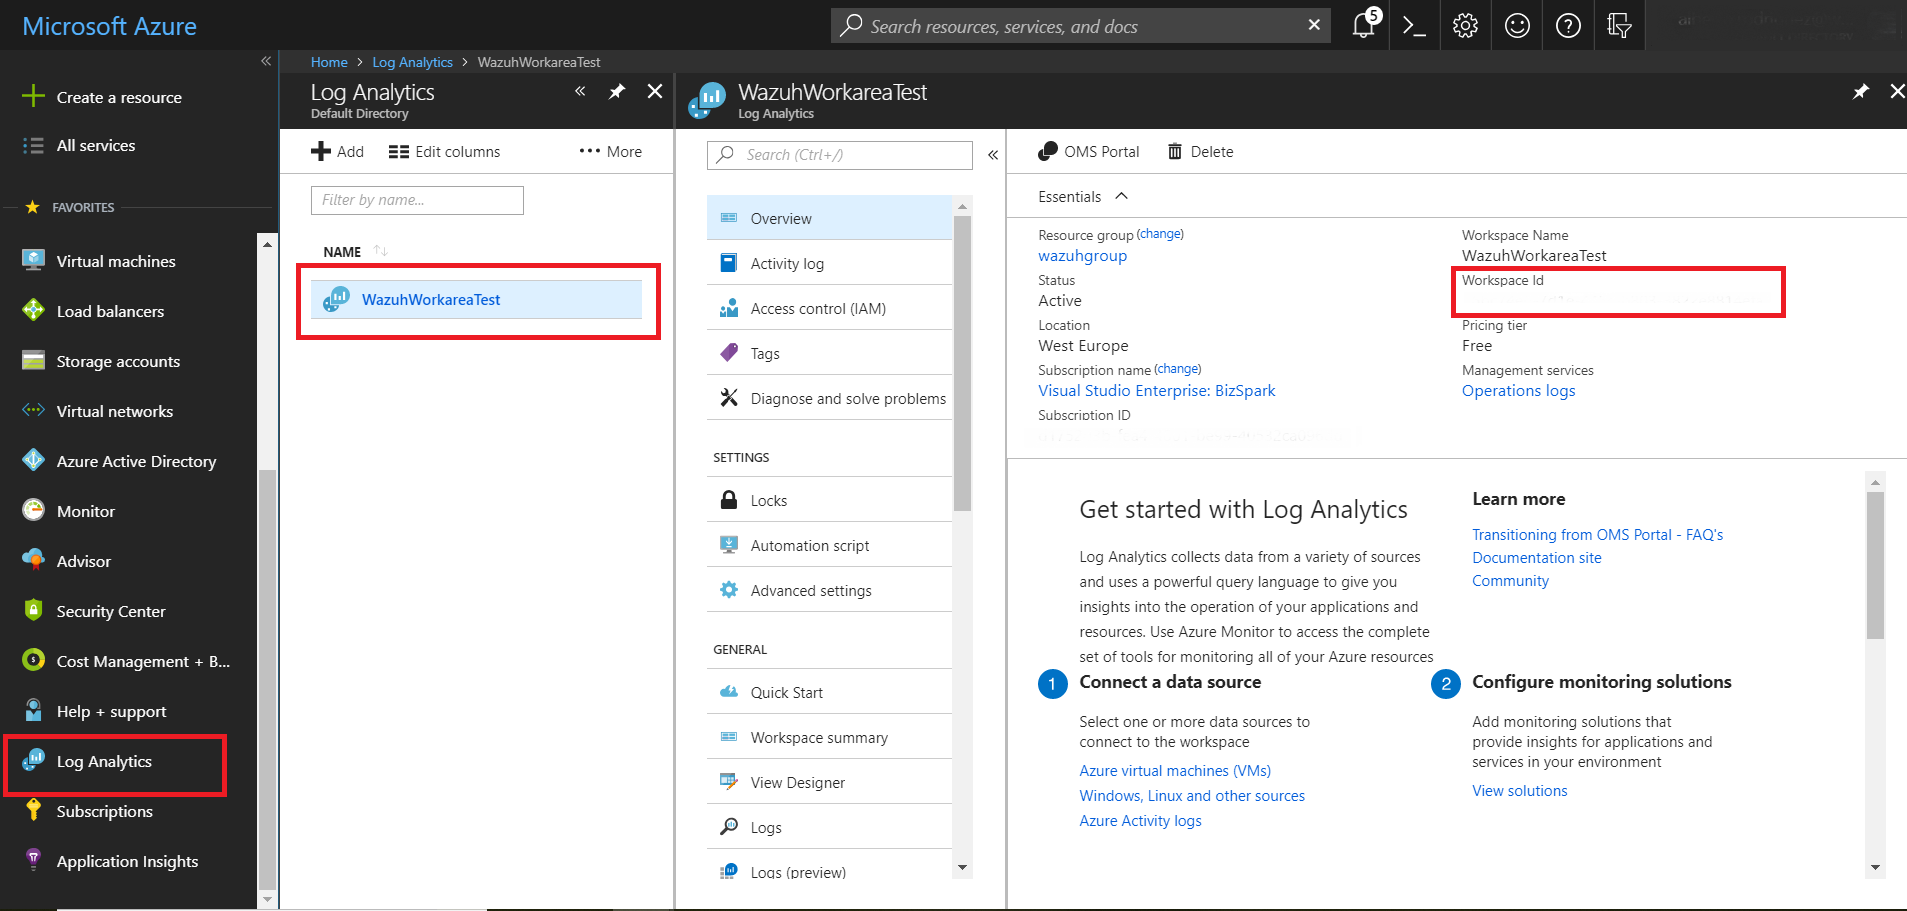
4.1 - Finally, we must configure Log Analytics to ensure our access once we have authenticated ourselves in our application. First select the Log Analytics entry. Next we will choose the workspace. Here we can see the Workspace Id field, which we will use to make requests to the API.
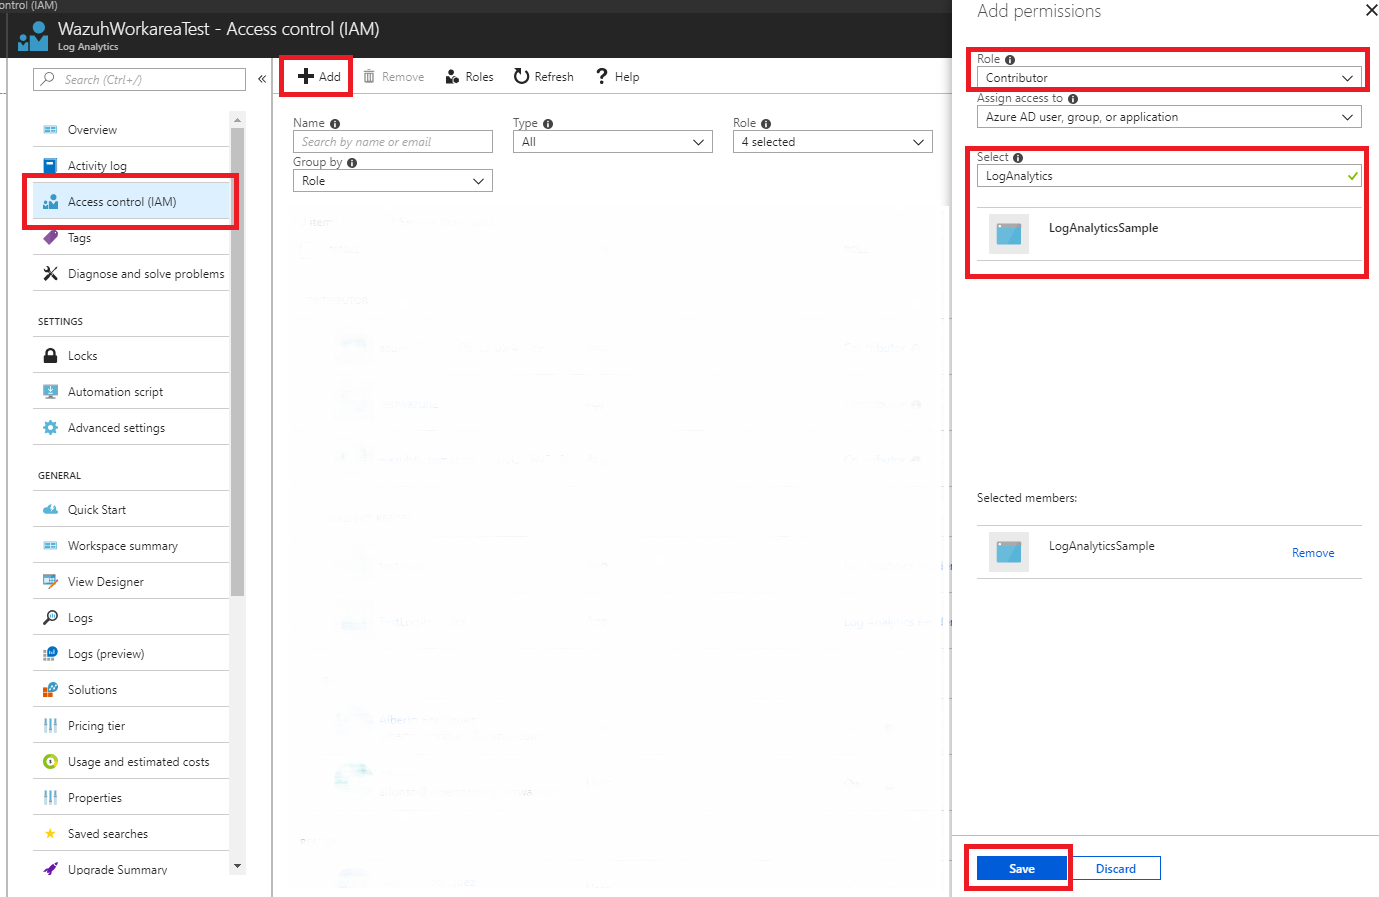
4.2 - Now select the Access control (IAM) input and choose the add option. In the add permissions window we will set the desired role and select our application, ending with the save option.
Wazuh configuration
Next will see the options we have to configure for the Wazuh integration.
5. azure-logs configuration
5.1 - Proceed to configure the azure-logs wodle in the Wazuh manager. We will use the data that we took previously as the key and ID of the application. In this case, we have introduced both fields in a file for authentication. You will also need the workspace ID. Through the following configuration, Wazuh is ready to search for any query accepted by Azure Log Analytics. In this case we are going to monitor all the activity by means of the query AzureActivity. Finally we add a representative tag and we will indicate that request will be made every Monday at 02:00 and the first search will be made two days ago and that does not run on start:
Note
When we choose to use a file for authentication, its content must be field = value. For example:
application_id = 317...764
application_key = wUj...9cj
<wodle name="azure-logs">

    <disabled>no</disabled>
    <wday>monday</wday>
    <time>02:00</time>
    <run_on_start>no</run_on_start>

    <log_analytics>

        <auth_path>/home/manager/Azure/log_analytics_auth.txt</auth_path>
        <tenantdomain>wazuh.onmicrosoft.com</tenantdomain>

        <request>
            <tag>azure-activity</tag>
            <query>AzureActivity</query>
            <workspace>d6b...efa</workspace>
            <time_offset>2d</time_offset>
        </request>

    </log_analytics>

</wodle>
You can see the module reference here.
The field tenantdomain is necessary and we can obtain it easily. In the azure portal, we can see it leaving the cursor in the upper right corner.

Adding this section to the configuration file of our Wazuh manager, we will start with the monitoring of activities using Azure Log Analytics.
Azure Log Analytics use case
Using the previously mentioned configuration, we will see an example of monitoring the activity of our infrastructure.
Wazuh Rules
As the records are in .json format, with these rules already included in the integration, we can start generating alerts:
<rule id="87801" level="5">
    <decoded_as>json</decoded_as>
    <field name="azure_tag">azure-log-analytics</field>
    <description>Azure: Log analytics</description>
</rule>

<rule id="87810" level="3">
    <if_sid>87801</if_sid>
    <field name="Type">AzureActivity</field>
    <description>Azure: Log analytics activity</description>
</rule>

<rule id="87811" level="3">
    <if_sid>87810</if_sid>
    <field name="OperationName">\.+</field>
    <description>Azure: Log analytics: $(OperationName)</description>
</rule>
Creating a virtual machine
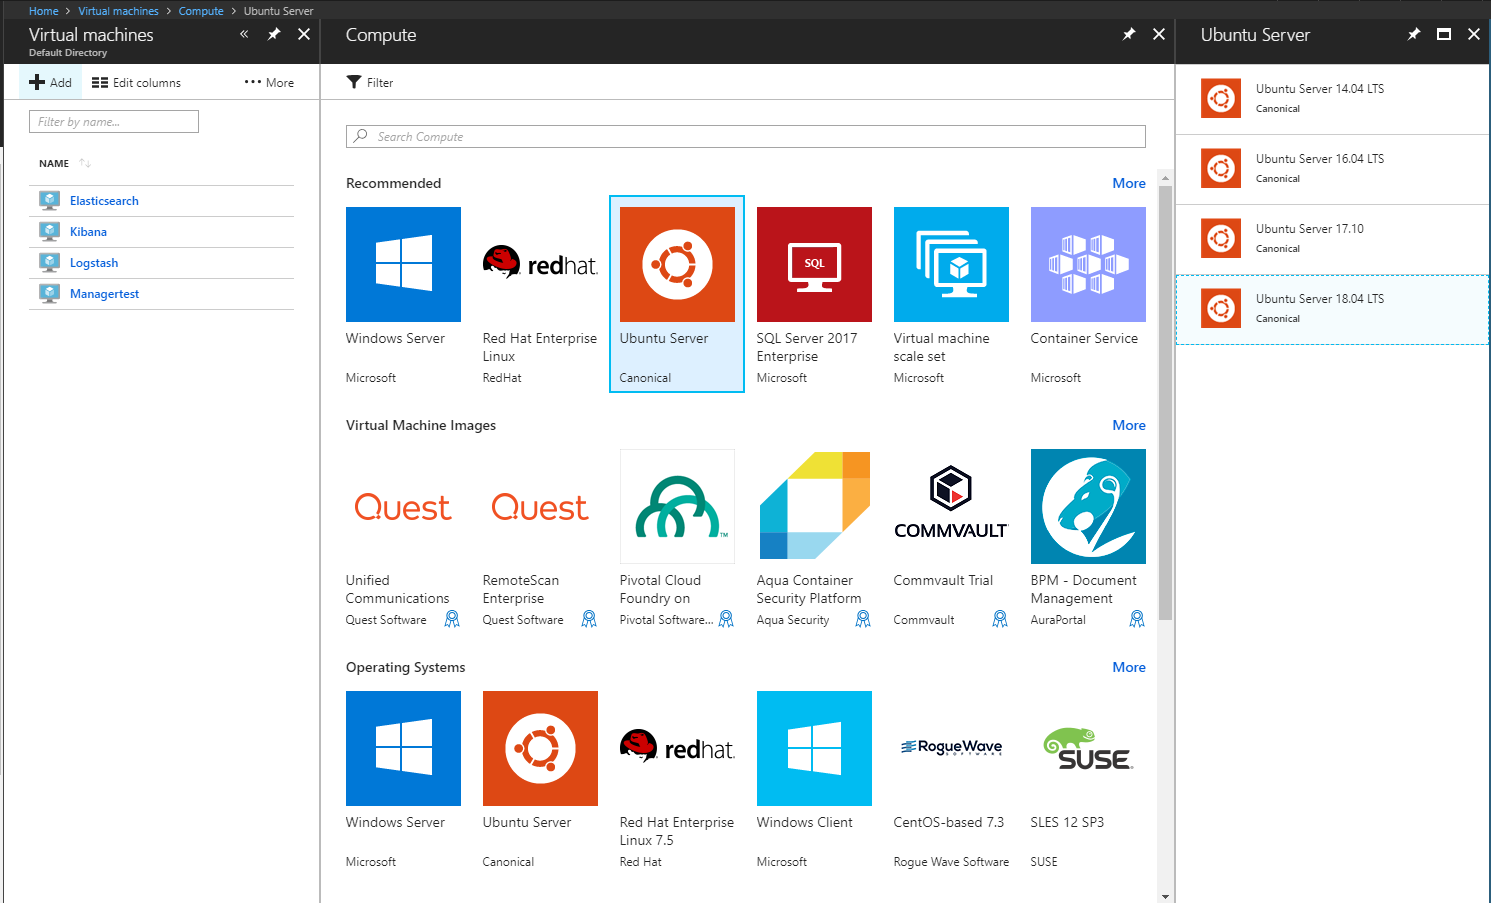
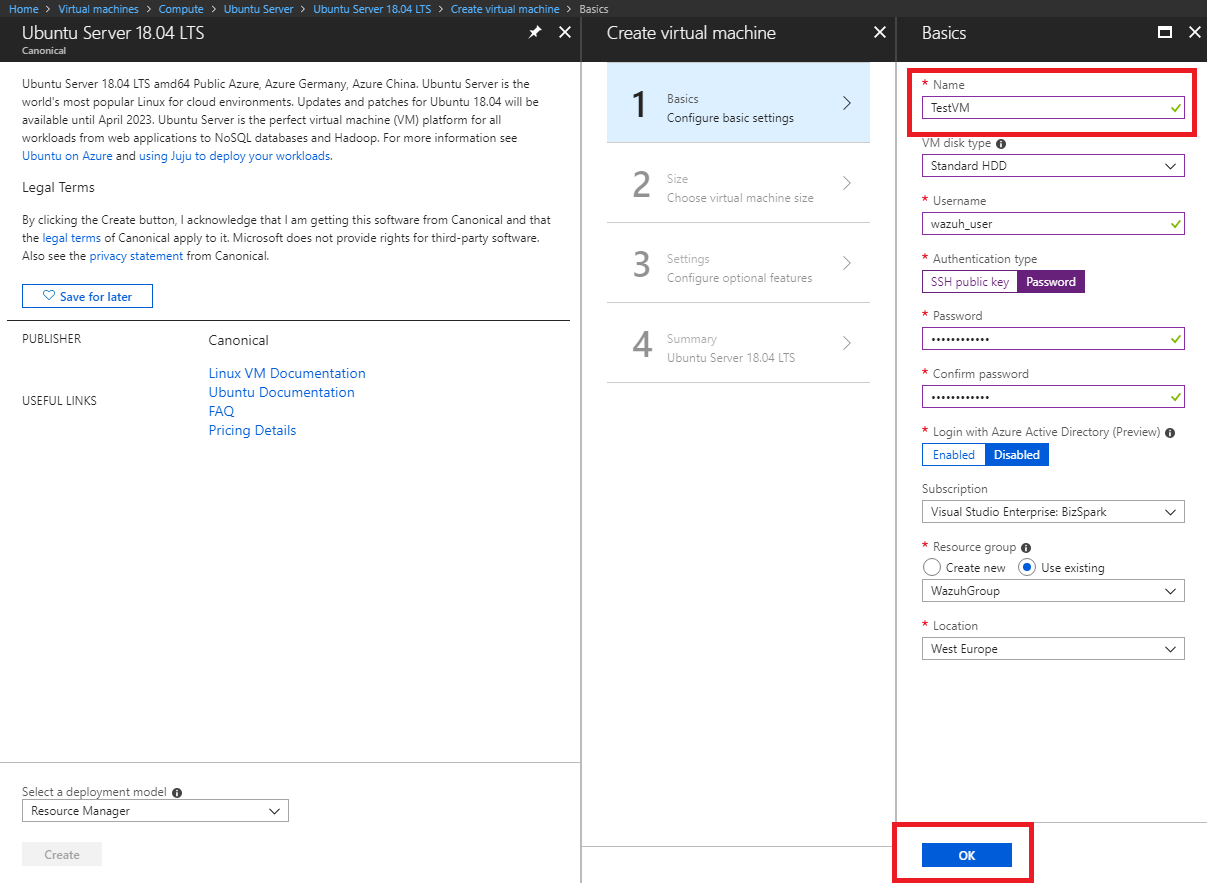
We will see as example, the creation of a new virtual machine. We are going to deploy an Ubuntu 18.04 server.
In this example we have prepared a minimum configuration when creating the virtual machine.
Azure portal visualization
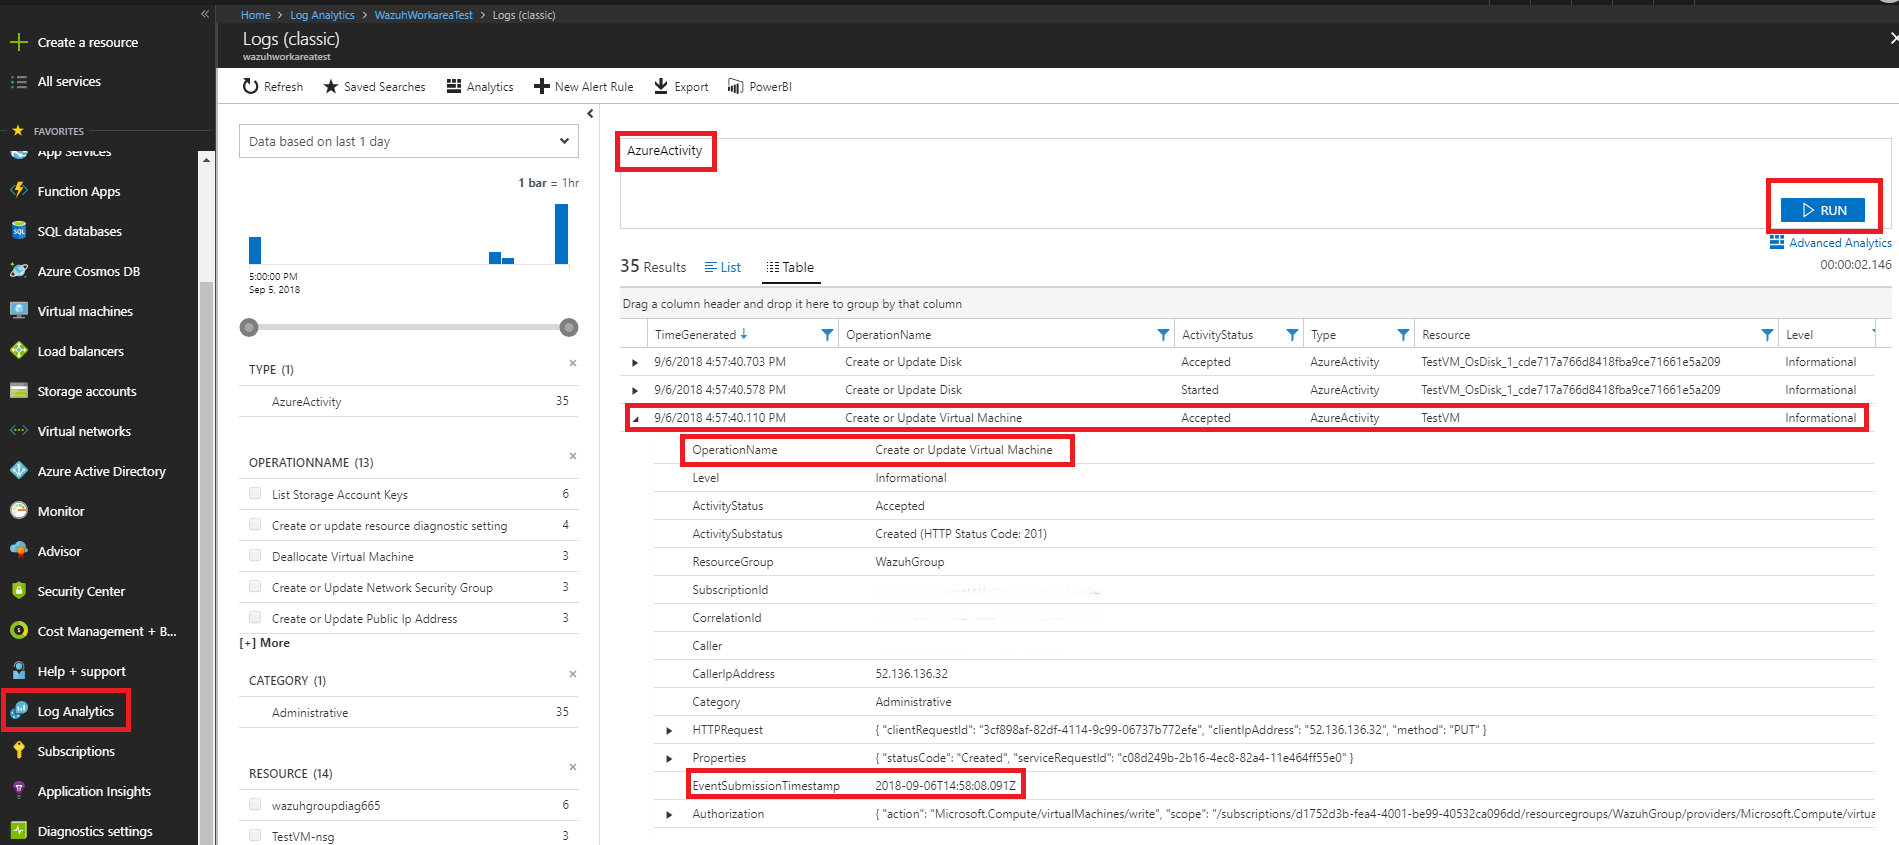
We select the Log Analytics entry, write our query AzureActivity and run the search. This log shows that a virtual machine has been created or updated. If we take a look at the Resource column we can see what have just been deployed.
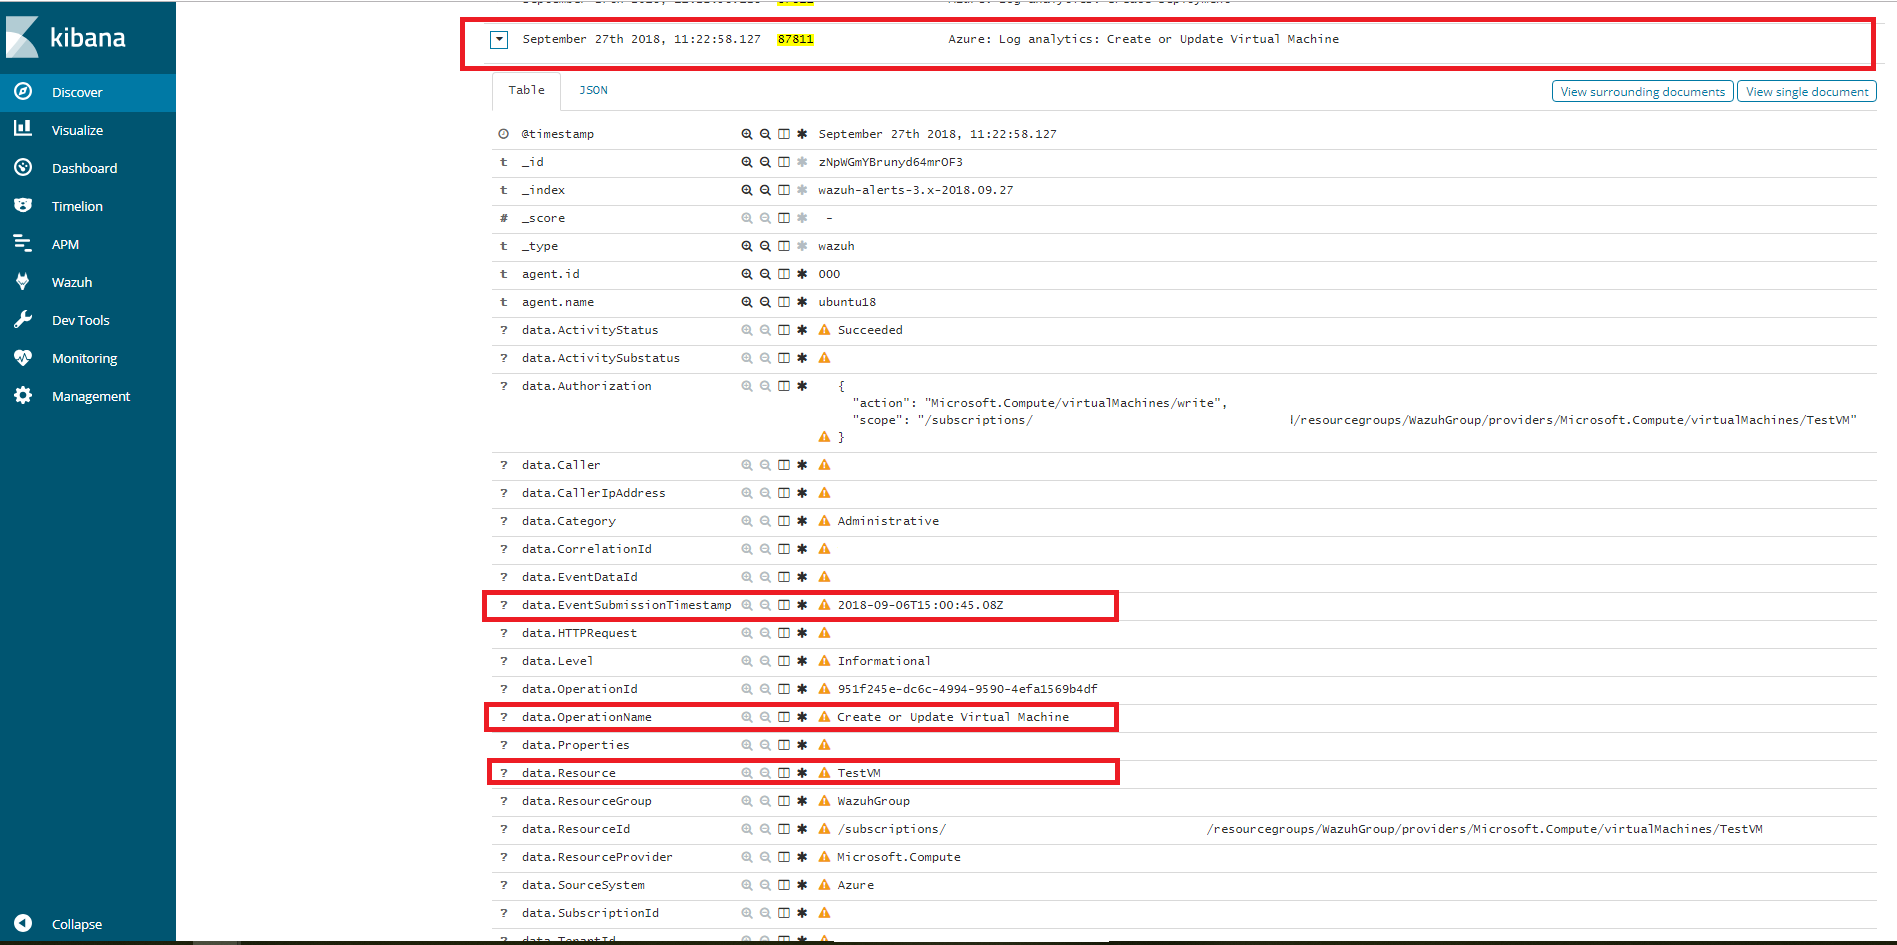
Kibana visualization
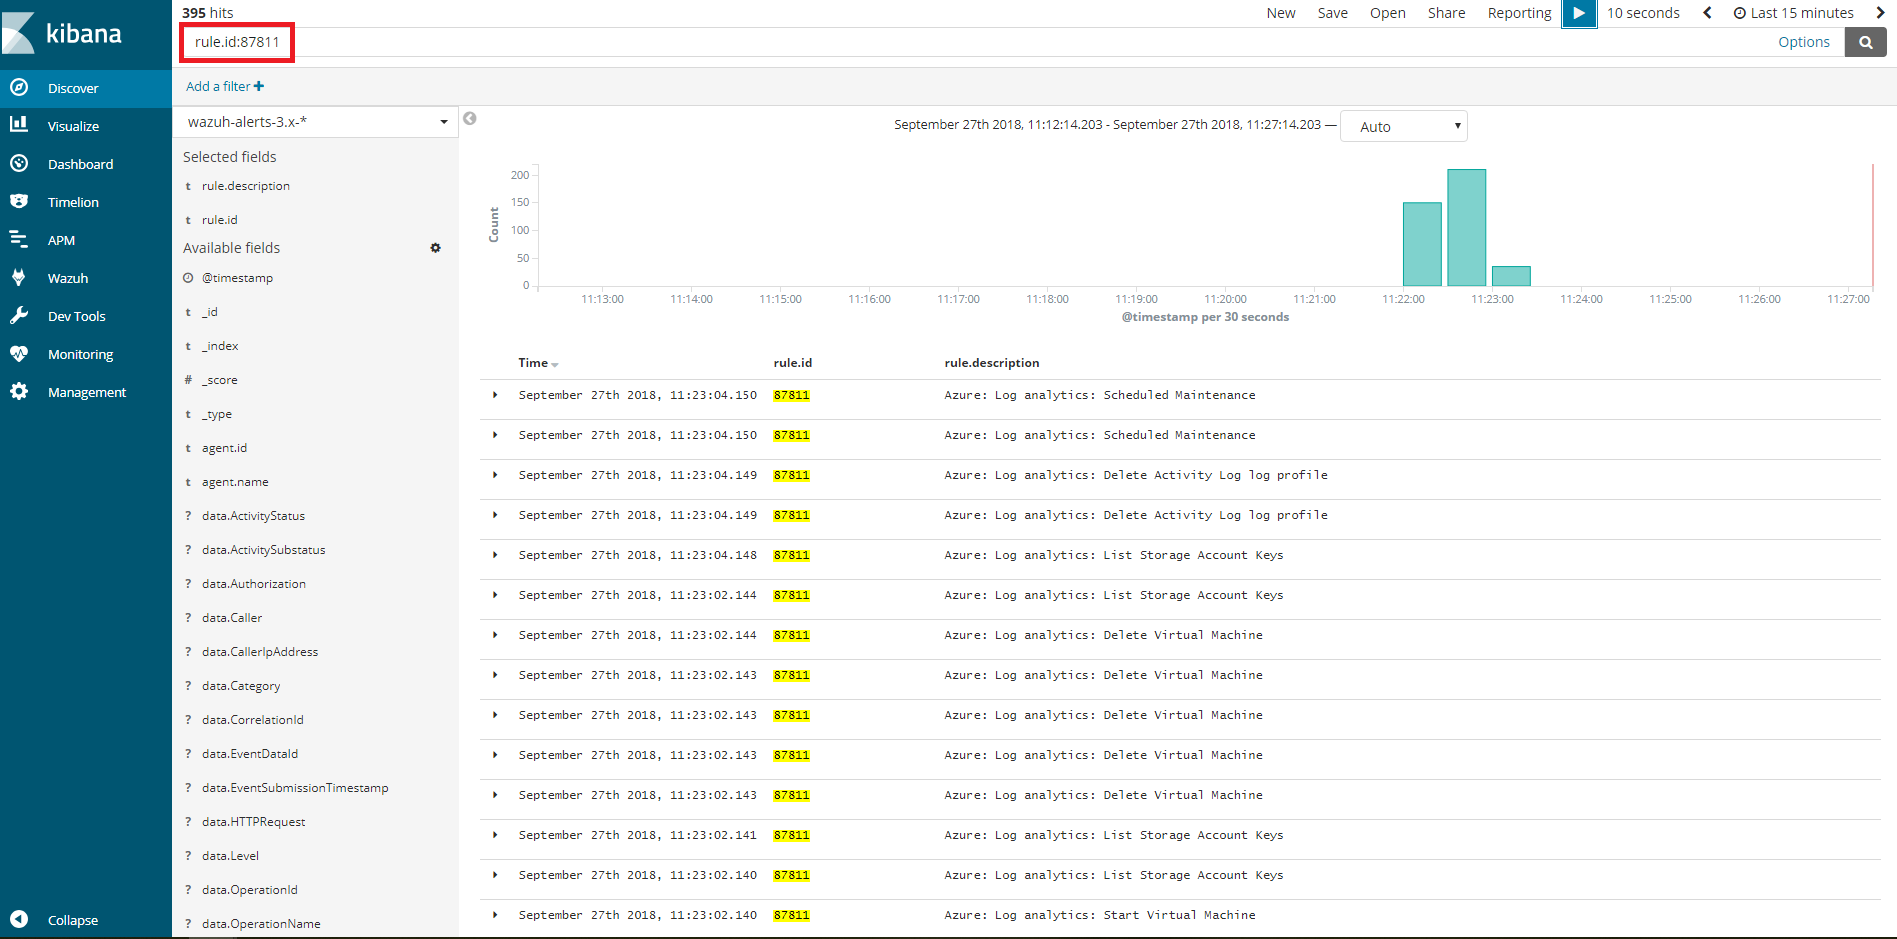
When our integration performs the query, we will be able to see the results in Kibana. In this case we can notice that the 87811 rule has been triggered and that the fields OperationName and EventSubmissionTimestamp coincide among others.
Using Azure Storage
Azure Storage refers to Microsoft Azure cloud storage by providing a massively scalable object store for data objects, a messaging store for reliable messaging, a file system service for the cloud, and a NoSQL store.
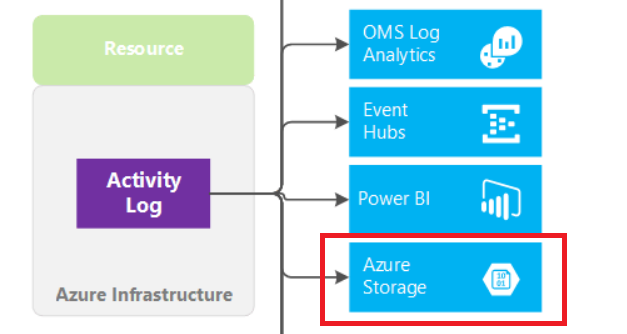
Next we will show how to use the Azure portal to archive the Azure activity log in a storage account, how to configure the azure-logs wodle and show a usage case for a better understanding.
1. Export Activity Logs
As an alternative to the Azure Log Analytics REST API, Wazuh offers the possibility to access Azure Storage accounts in a simple way. The activity logs of the Microsoft Azure infrastructure can be exported to the storage accounts.
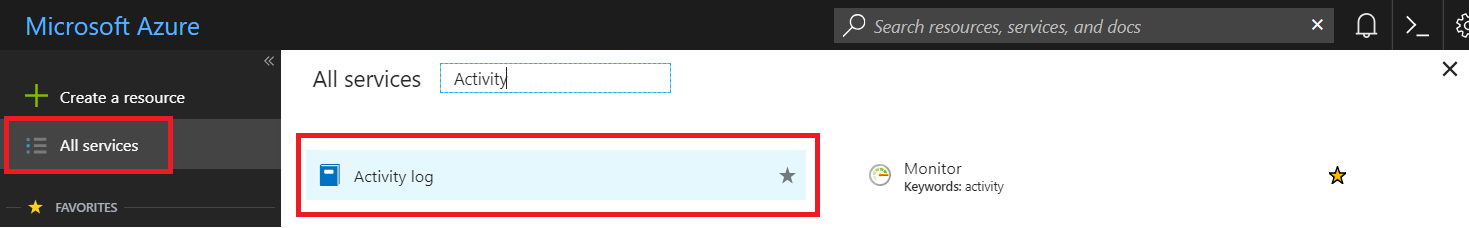
1.1 - Access to Activity log
We will search the Activity logs entry from the All services entry. Just type "Activity" in the search engine.
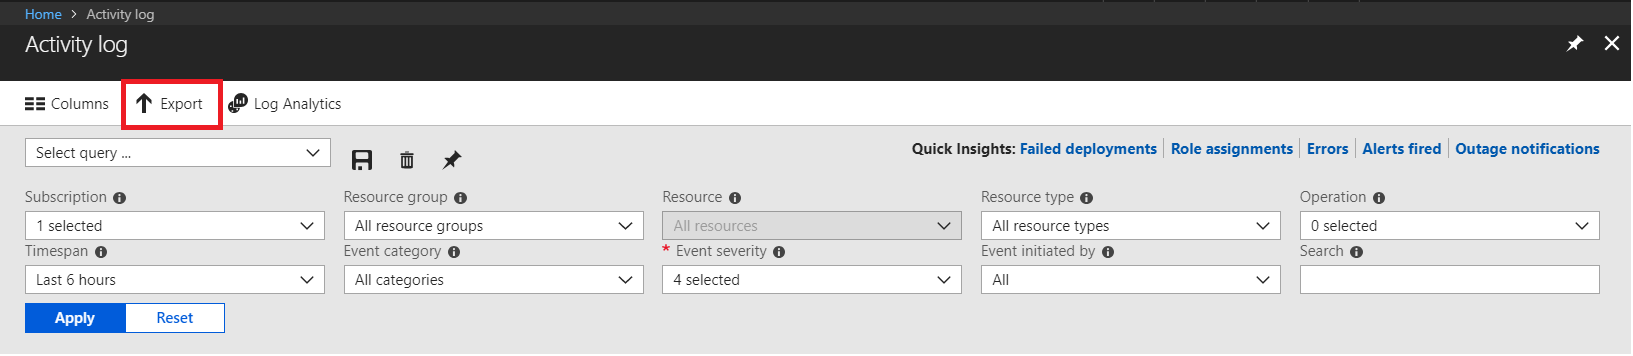
1.2 - Configuring the Activity log export
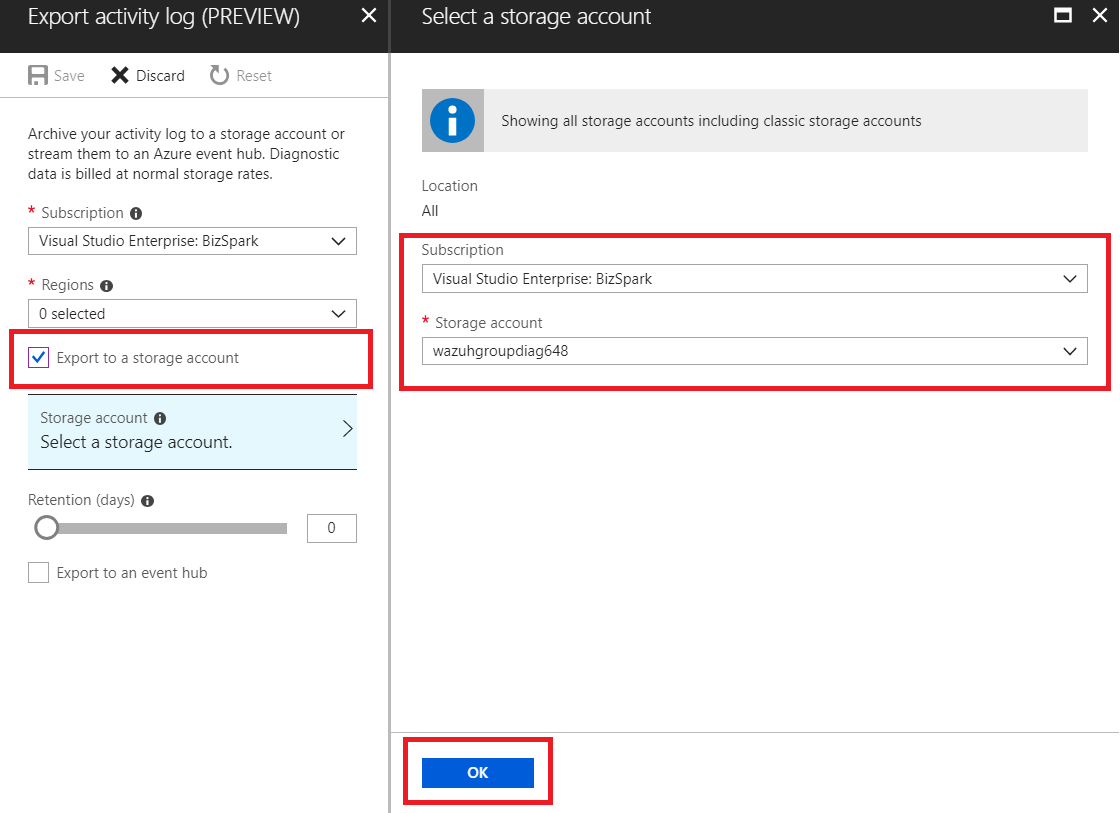
Once we access the log of activities, select the option to export.
Select the option to export to a storage account, establish the subscription we want to monitor and choose the account where the activity logs will be stored.
2. Wazuh configuration
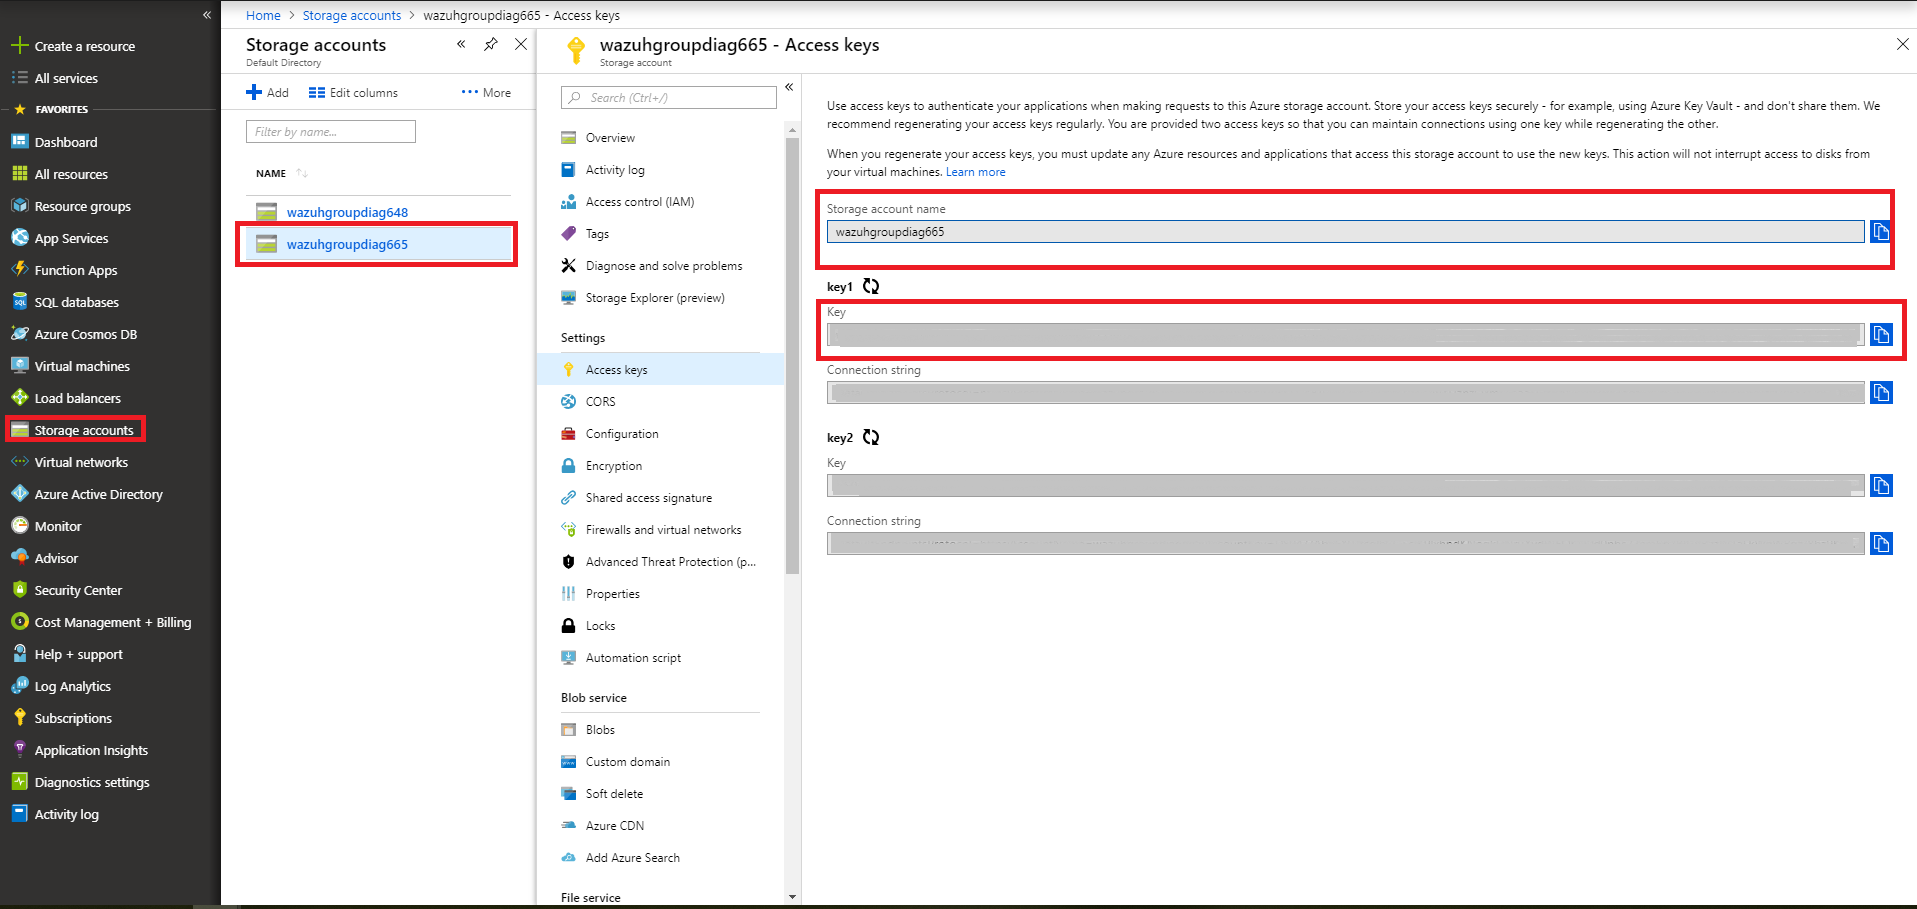
2.1 - We will be able to see the credentials needed to access the desired storage account in the Storage accounts section. We add a representative tag and select our account, then we choose the Access keys entry, where we use the key1.
Note
When we choose to use a file for authentication, its content must be field = value. For example:
account_name = wazuhgroupdiag665
account_key = wr+...jOQ
In this case, the integration will be executed with an interval of one day, the credentials will be taken from a file and we will proceed to search in the container insights-operational-logs, all the blobs that have the extension .json in the last 24 hours. We also indicate the type of content that have the blobs that we are going to recover, in this case json_file:
Note
As of November 1st 2018, the format of logs stored in Azure accounts will become inline JSON (json_inline in Wazuh) and the previous format will be obsolete (json_file in Wazuh).
<wodle name="azure-logs">

    <disabled>no</disabled>
    <interval>1d</interval>
    <run_on_start>yes</run_on_start>

    <storage>

            <auth_path>/home/manager/Azure/storage_auth.txt</auth_path>
            <tag>azure-activity</tag>

            <container name="insights-operational-logs">
                <blobs>.json</blobs>
                <content_type>json_file</content_type>
                <time_offset>24h</time_offset>
            </container>

    </storage>
</wodle>
You can see the module reference here.
Azure Storage Use Case
Using the previously mentioned configuration, we will see an example of monitoring the infrastructure activity.
Wazuh Rules
The logs are stored in JSON files, therefore, with these rules, already included in the integration, we will be able to obtain the related alerts.
<rule id="87803" level="3">
<decoded_as>json</decoded_as>
<field name="azure_tag">azure-storage</field>
<description>Azure: Storage</description>
</rule>
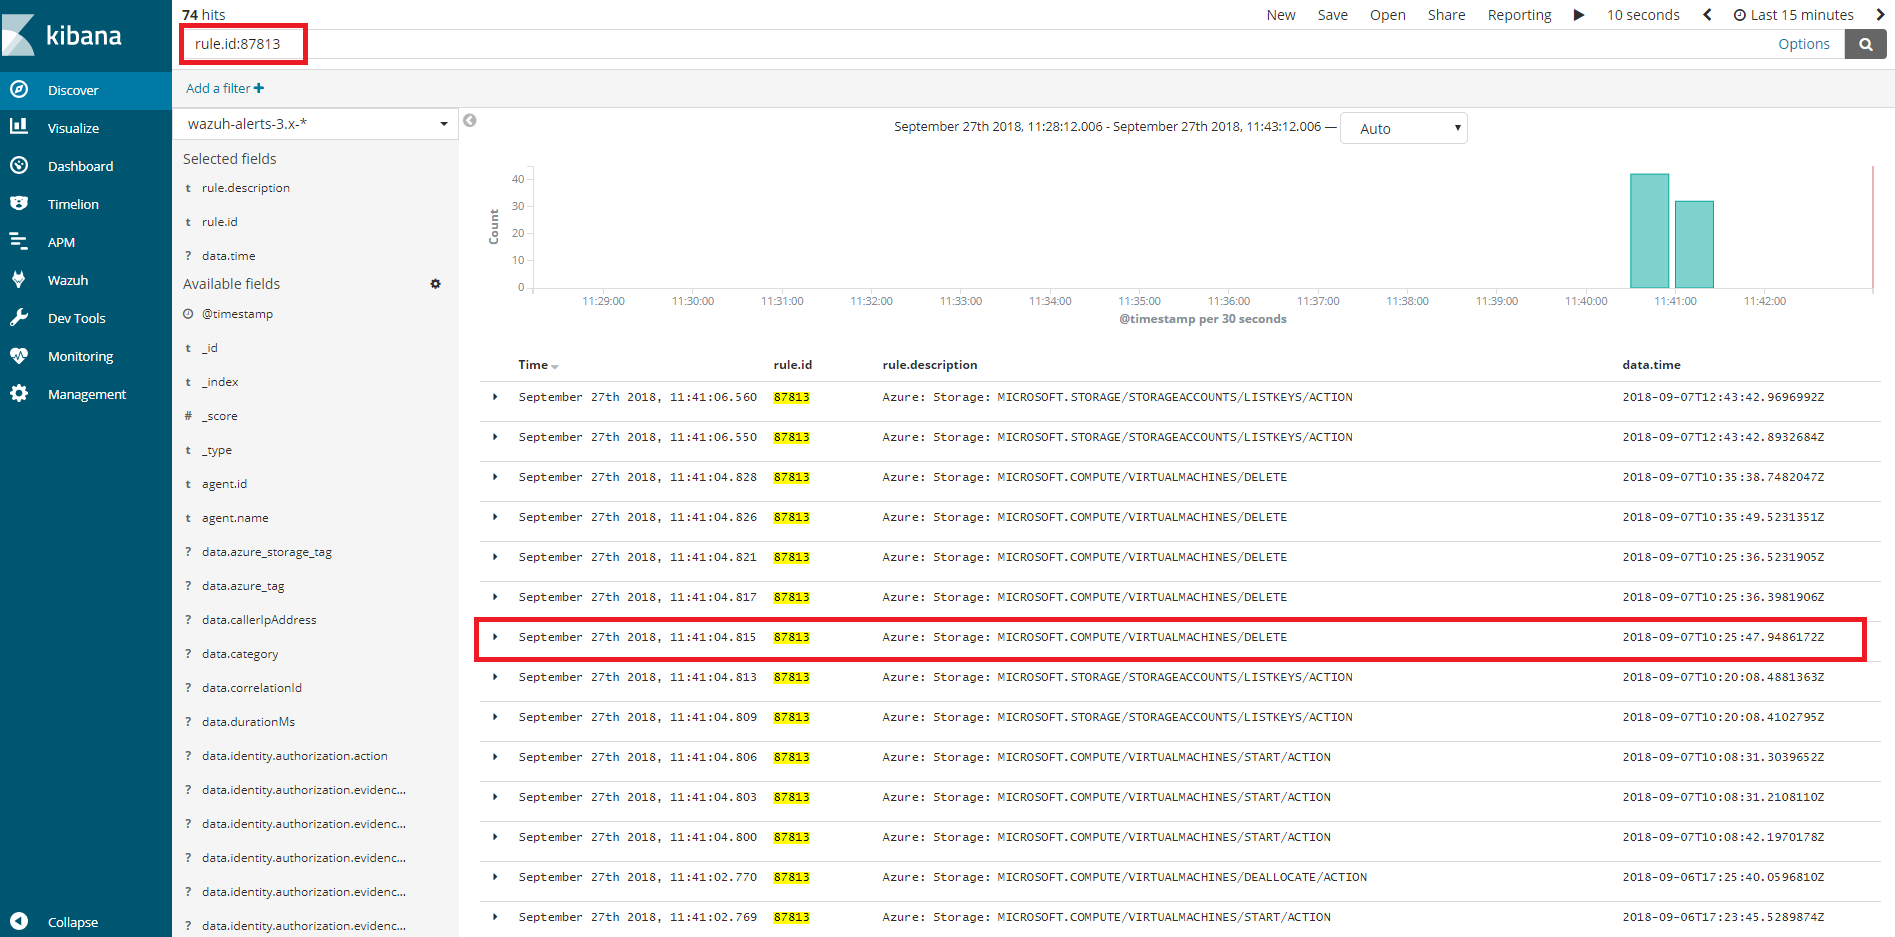
<rule id="87813" level="3">
<if_sid>87803</if_sid>
<field name="operationName">\.+</field>
<description>Azure: Storage: $(OperationName)</description>
</rule>
Removing a virtual machine
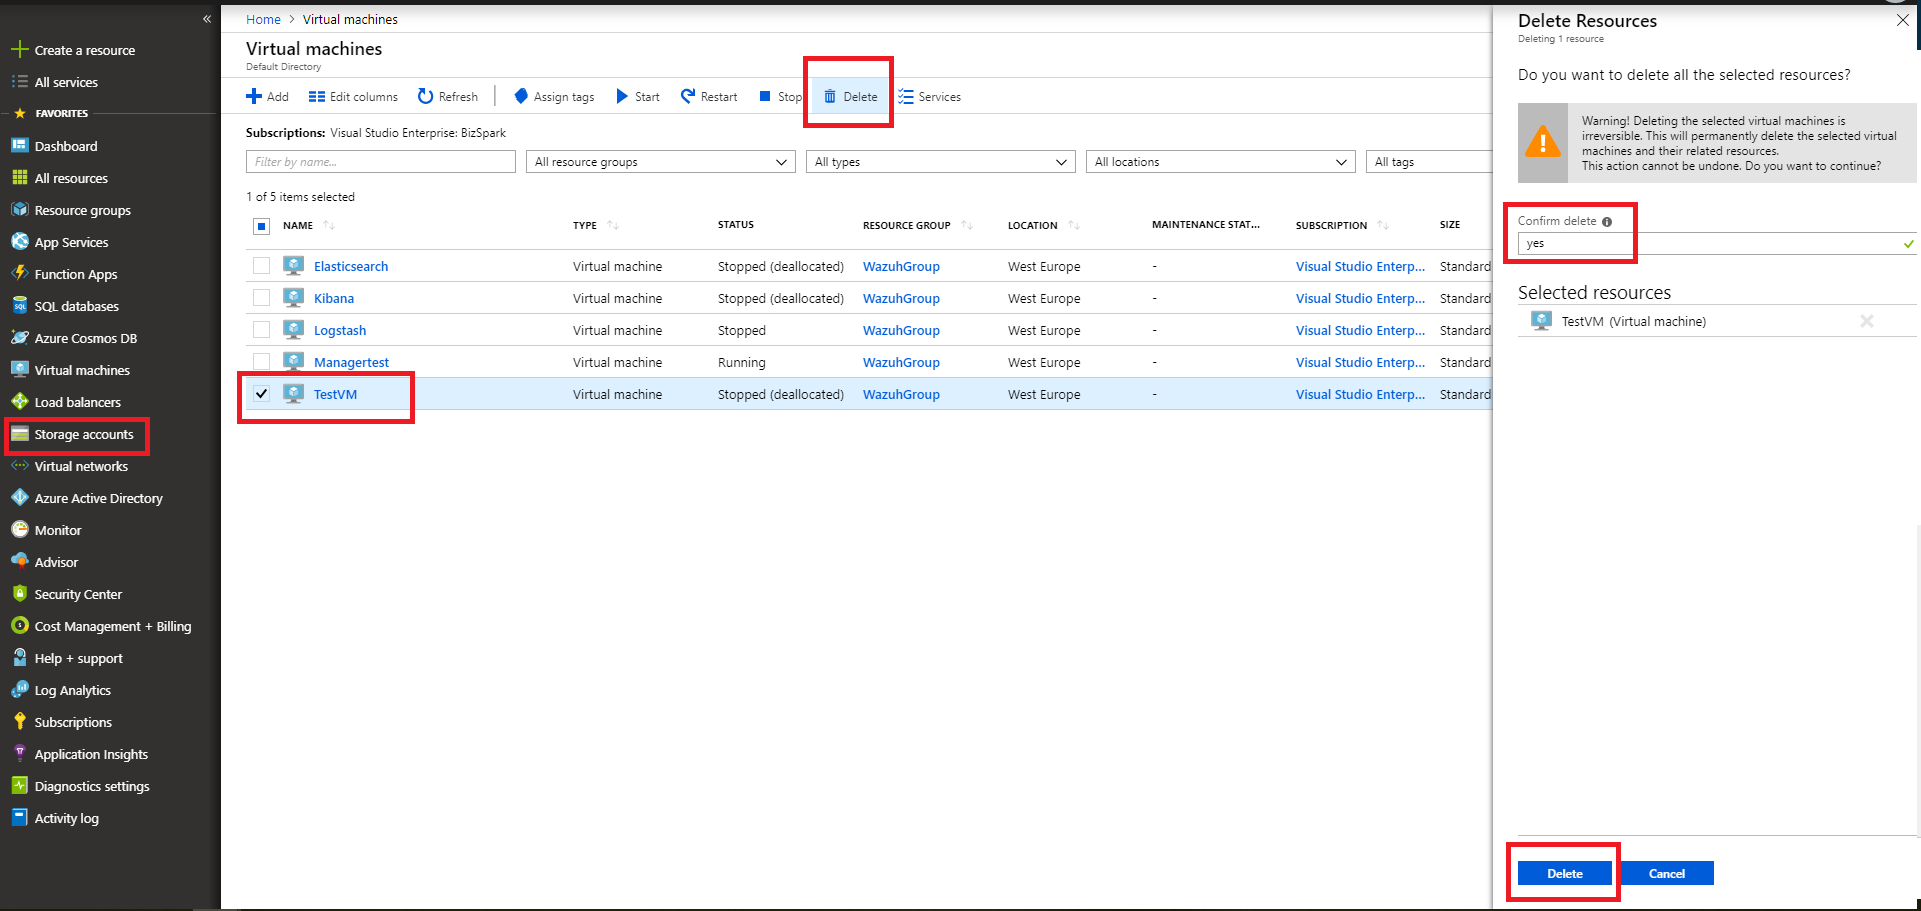
As an example we are going to remove the virtual machine we created for the example of Azure Log Analytics. From the Storage accounts entry, select our virtual machine and choose the delete option. Confirm the deletion and proceed.
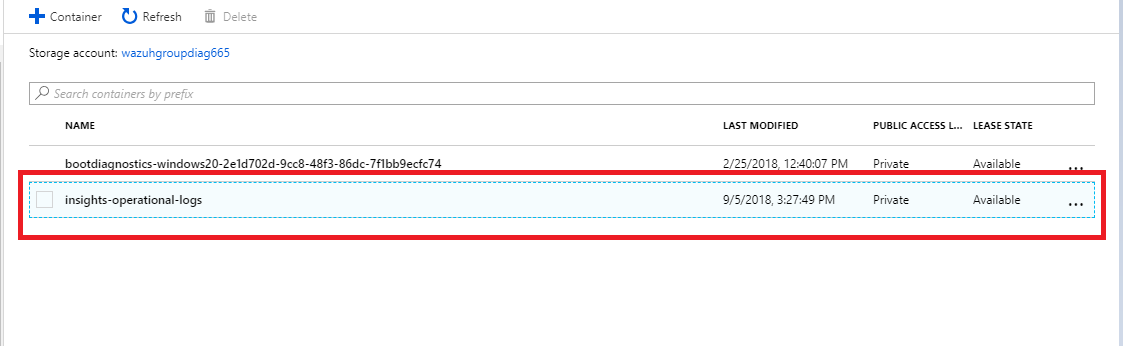
Again from the Storage accounts section, we select the account we want to access. Once there we access the Blobs section.
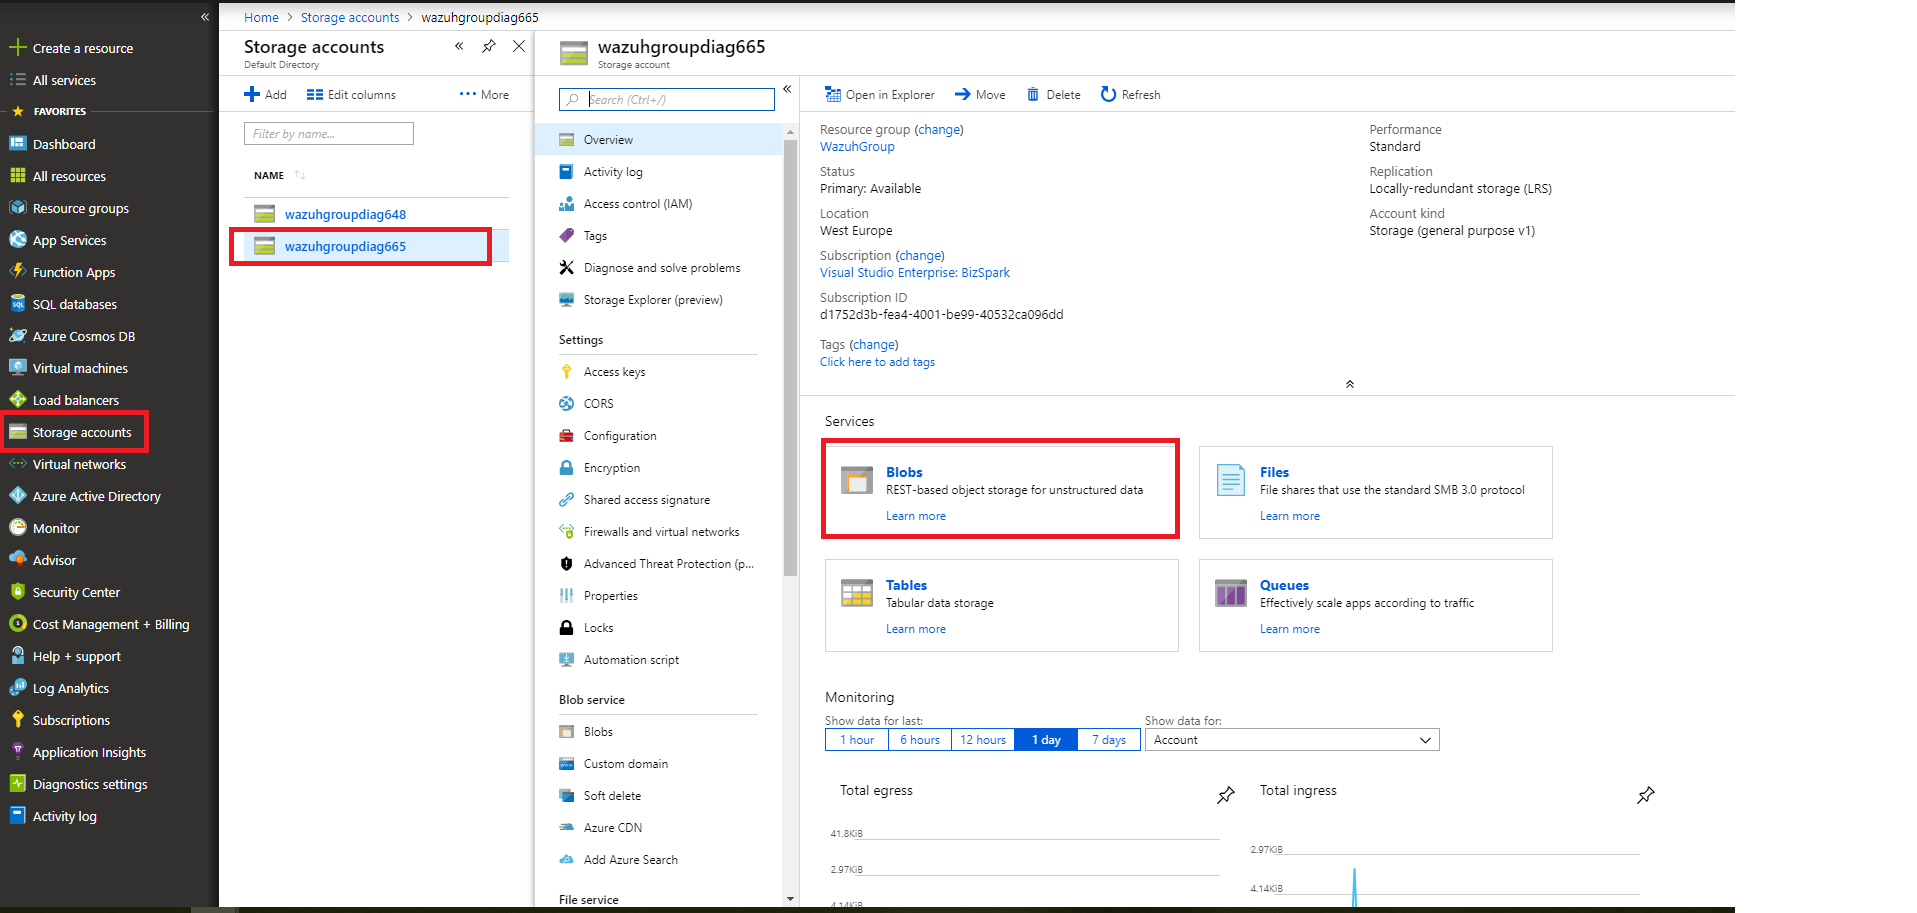
We select the container where we store the blobs.
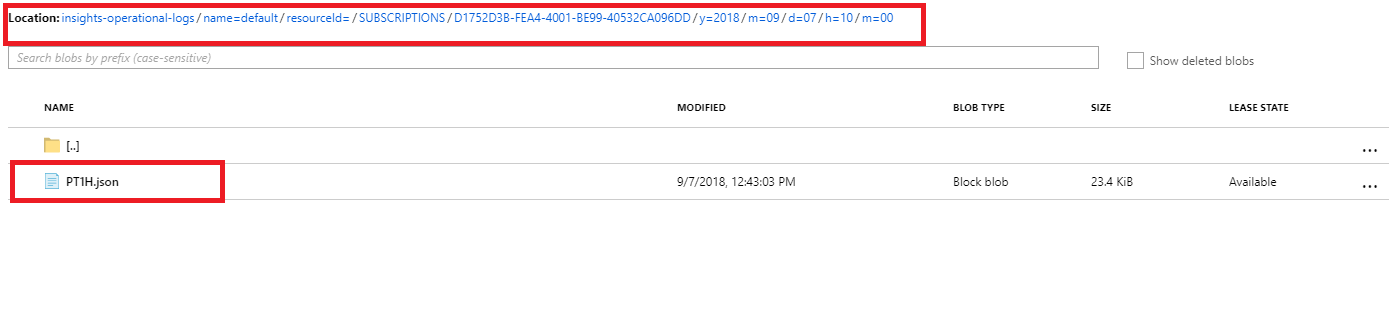
Navigate through the directories until we find the blob we want to check, in this case will be PTIH.json.
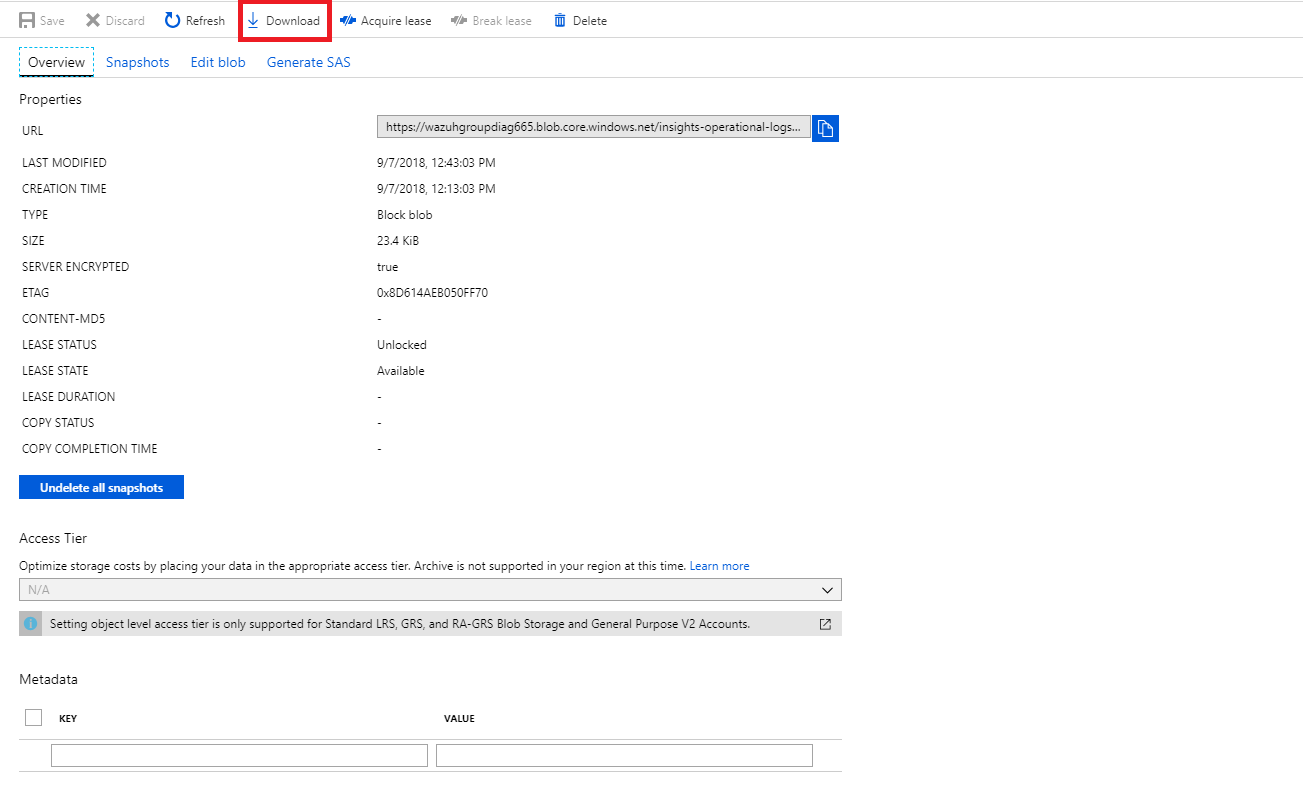
Download the blob to check its content.
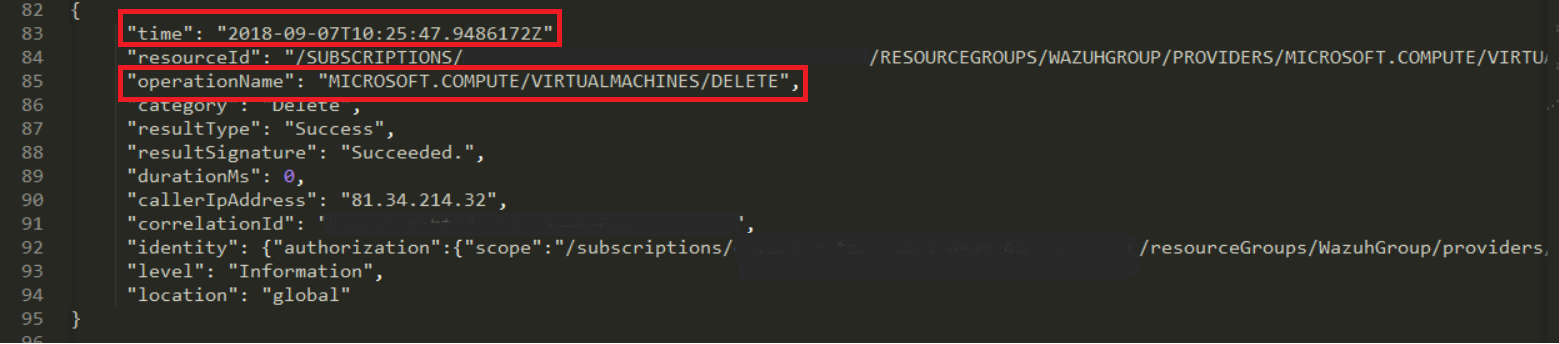
File visualization
In the downloaded blob we found several logs, we focus on this particular log, which refers to the removal of the virtual machine.
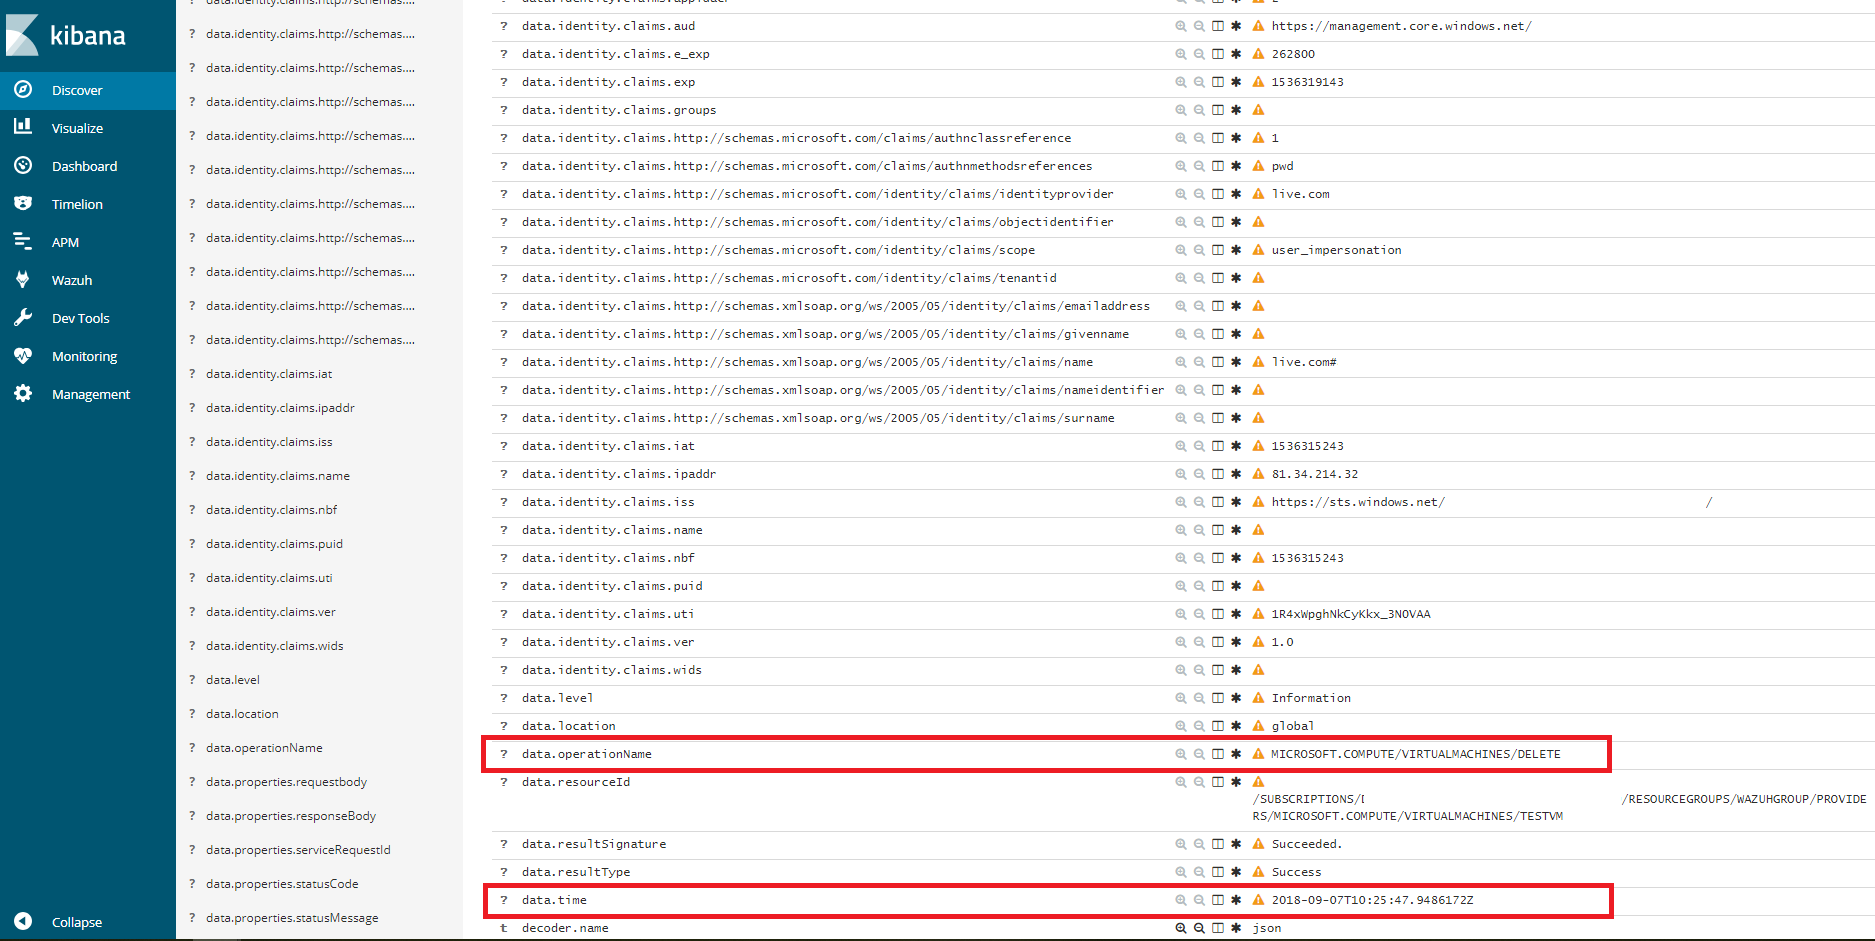
Kibana visualization
When our integration performs the access, we will be able to see the results in Kibana. In this case we can notice that the 87813 rule has been triggered and see that the fields operationName and time match among others.