Architecture
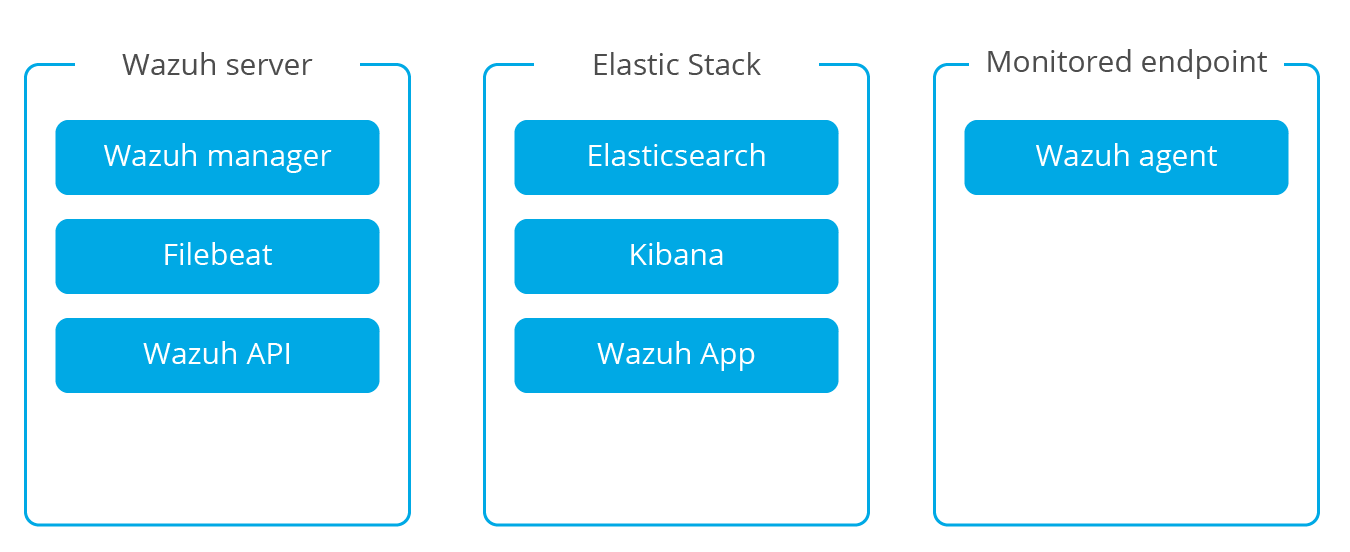
The Wazuh architecture is based on agents running on monitored hosts that forward log data to a central server. Also, agentless devices (such as firewalls, switches, routers, access points, etc.) are supported and can actively submit log data via syslog and/or a periodic probe of their configuration changes to later forward the data to the central server. The central server decodes and analyzes the incoming information and passes the results along to an Elasticsearch cluster for indexing and storage.
An Elasticsearch cluster is a collection of one or more nodes (servers) that communicate with each other to perform read and write operations on indexes. Small Wazuh deployments (<50 agents), can easily be handled by a single-node cluster. Multi-node clusters are recommended when there is a large number of monitored systems, when a large volume of data is anticipated and/or when high availability is required.
When the Wazuh server and the Elasticsearch cluster are on different hosts, Filebeat is used to securely forward Wazuh alerts and/or archived events to the Elasticsearch server(s) using TLS encryption.
The below diagram illustrates how components are distributed when the Wazuh server and the Elasticsearch cluster run on different hosts. Note that with multi-node clusters there will be multiple Elastic Stack servers to which Filebeat is capable of forwarding data:
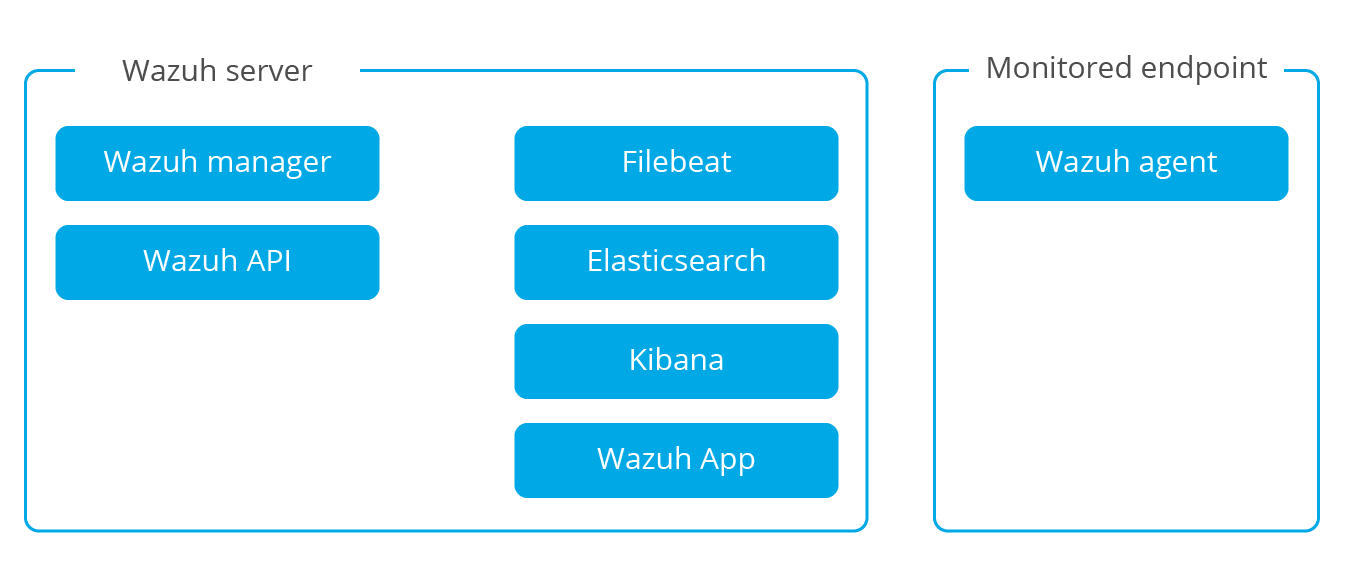
In smaller Wazuh deployments, Wazuh and Elastic Stack with a single-node Elasticsearch instance can all be deployed on a single server. In this scenario, Logstash can read the Wazuh alerts and/or archived events directly from the local file system and feed them into the local Elasticsearch instance.
Communications and data flow
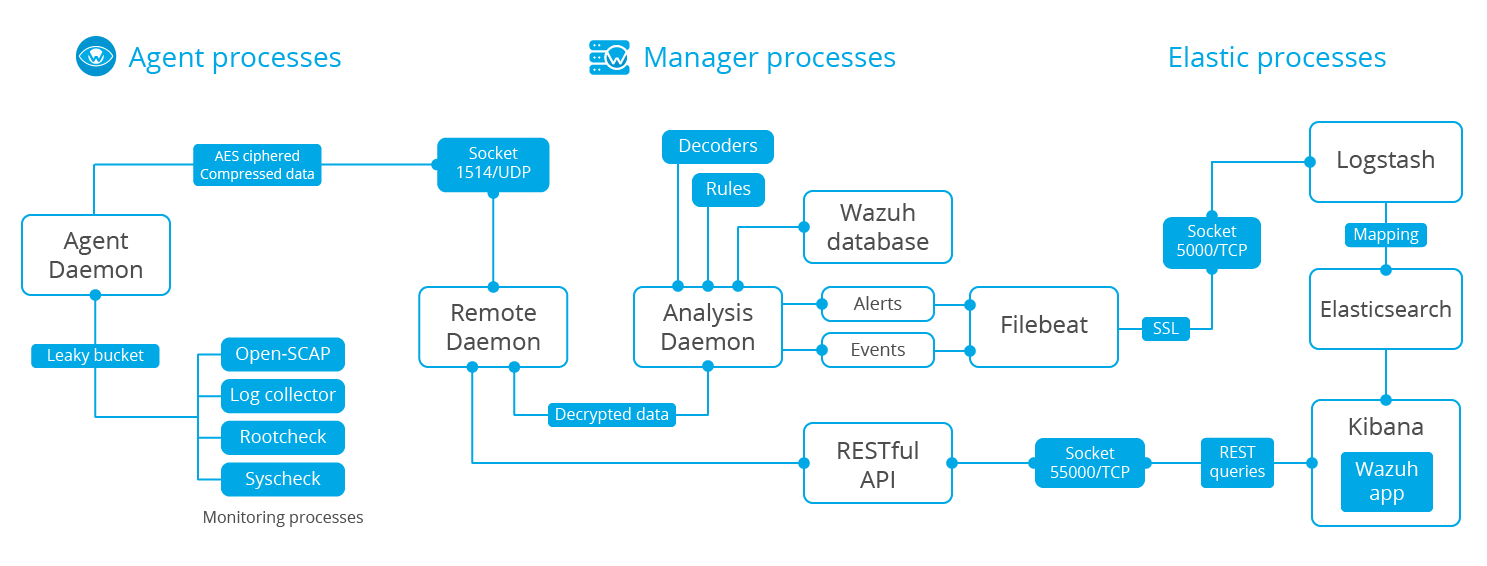
Agent-server communication
Wazuh agents use the OSSEC message protocol to send collected events to the Wazuh server over port 1514 (UDP or TCP). The Wazuh server then decodes and rule-checks the received events with the analysis engine. Events that trip a rule are augmented with alert data such as rule id and rule name. Events can be spooled to one or both of the following files, depending on whether or not a rule is tripped:
The file
/var/ossec/logs/archives/archives.jsoncontains all events whether they tripped a rule or not.The file
/var/ossec/logs/alerts/alerts.jsoncontains only events that tripped a rule.
Note
Alerts will be duplicated if you use both of these files. Also, note that both files receive fully decoded event data.
The Wazuh message protocol uses a 192-bit Blowfish encryption with a full 16-round implementation, or AES encryption with 128 bits per block and 256-bit keys.
Wazuh-Elastic communication
In larger deployments, the Wazuh server uses Filebeat to sends alert and event data to Logstash (5000/TCP) on the Elastic Stack server using TLS encryption. For a single-host architecture, Logstash is able to read the events/alerts directly from the local filesystem without using Filebeat.
Logstash formats the incoming data and optionally enriches it with GeoIP information before sending it to Elasticsearch (port 9200/TCP). Once the data is indexed into Elasticsearch, Kibana (port 5601/TCP) is used to mine and visualize the information.
The Wazuh App runs inside Kibana constantly querying the RESTful API (port 55000/TCP on the Wazuh manager) in order to display configuration and status related information of the server and agents, as well to restart agents when desired. This communication is encrypted with TLS and authenticated with username and password.
Required ports
For an installation of Wazuh and the Elastic Stack, several network ports must be available and opened so the different components can communicate properly between them.
Wazuh
Component |
Port |
Protocol |
Purpose |
|---|---|---|---|
Wazuh manager |
1514 |
TCP |
Send collected events from agents (when configured for TCP) |
1514 |
UDP |
Send collected events from agents (when configured for UDP) - Default |
|
1515 |
TCP |
Agents registration service |
|
1516 |
TCP |
Wazuh cluster communications |
|
514 |
TCP |
Send collected events from syslog (when configured for TCP) |
|
514 |
UDP |
Send collected events from syslog (when configured for UDP) - Default |
|
Wazuh API |
55000 |
TCP |
Incoming HTTP requests |
Elastic Stack
Component |
Port |
Protocol |
Purpose |
|---|---|---|---|
Logstash |
5000 |
TCP |
Input port (when using Filebeat) |
Elasticsearch |
9200 |
TCP |
Elasticsearch RESTful API |
9300-9400 |
TCP |
Elasticsearch cluster communications |
|
Kibana |
5601 |
TCP |
Kibana web interface |

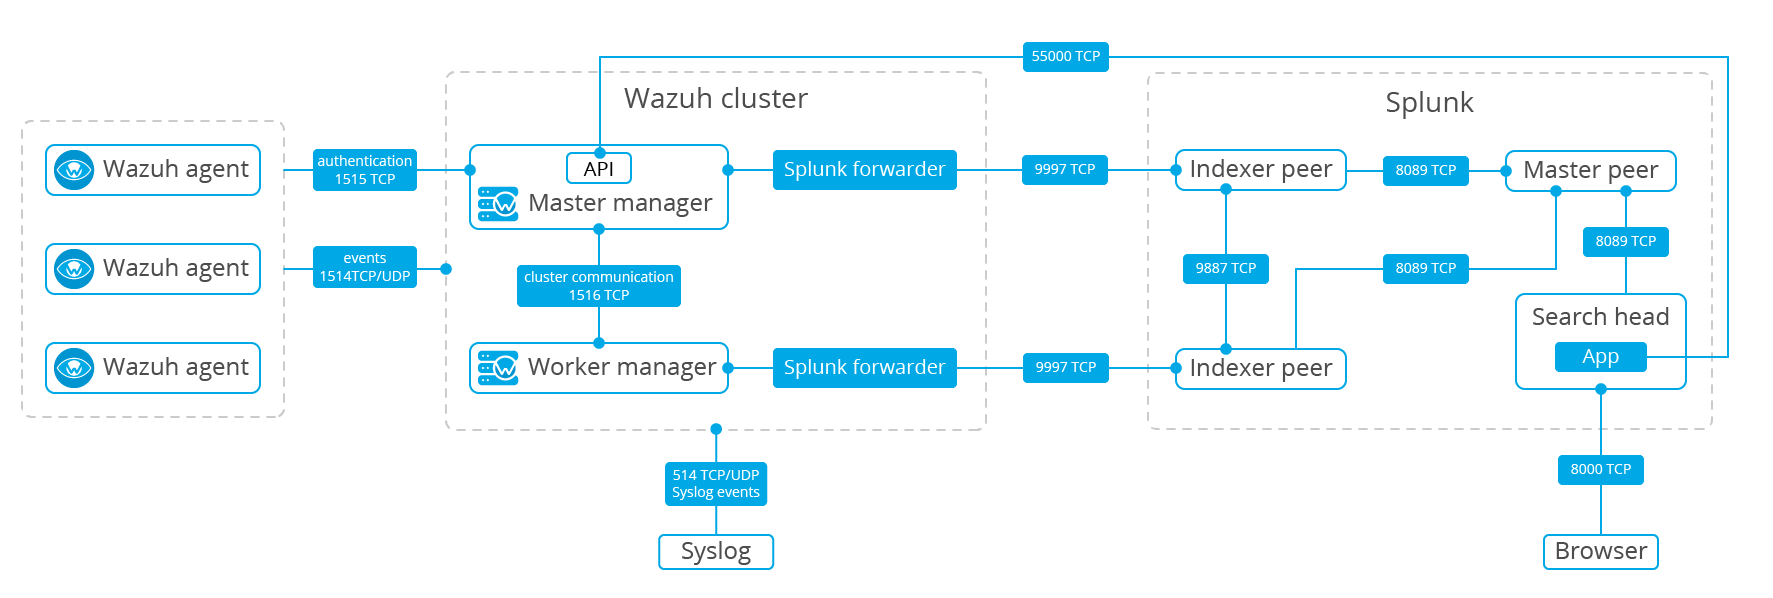
Splunk
Component |
Port |
Protocol |
Purpose |
|---|---|---|---|
Splunk |
8000 |
TCP |
Splunk web interface |
9997 |
TCP |
Input port (for Splunk Forwarder) |
|
8089 |
TCP |
Management port (for indexers) |
|
9887 |
TCP |
Splunk cluster communications |
More information
Archival data storage
Both alerts and non-alert events are stored in files on the Wazuh server in addition to being sent to Elasticsearch. These files can be written in JSON format (.json) and/or in plain text format (.log - no decoded fields but more compact). These files are daily compressed and signed using MD5 and SHA1 checksums. The directory and filename structure is as follows:
root@wazuh-server:/var/ossec/logs/archives/2017/Jan# ls -l
total 176
-rw-r----- 1 ossec ossec 234350 Jan  2 00:00 ossec-archive-01.json.gz
-rw-r----- 1 ossec ossec    350 Jan  2 00:00 ossec-archive-01.json.sum
-rw-r----- 1 ossec ossec 176221 Jan  2 00:00 ossec-archive-01.log.gz
-rw-r----- 1 ossec ossec    346 Jan  2 00:00 ossec-archive-01.log.sum
-rw-r----- 1 ossec ossec 224320 Jan  2 00:00 ossec-archive-02.json.gz
-rw-r----- 1 ossec ossec    350 Jan  2 00:00 ossec-archive-02.json.sum
-rw-r----- 1 ossec ossec 151642 Jan  2 00:00 ossec-archive-02.log.gz
-rw-r----- 1 ossec ossec    346 Jan  2 00:00 ossec-archive-02.log.sum
-rw-r----- 1 ossec ossec 315251 Jan  2 00:00 ossec-archive-03.json.gz
-rw-r----- 1 ossec ossec    350 Jan  2 00:00 ossec-archive-03.json.sum
-rw-r----- 1 ossec ossec 156296 Jan  2 00:00 ossec-archive-03.log.gz
-rw-r----- 1 ossec ossec    346 Jan  2 00:00 ossec-archive-03.log.sum
Rotation and backups of archive files is recommended according to the storage capacity of the Wazuh Manager server. By using cron jobs, you could easily arrange to keep only a certain time window of archive files locally on the Manager (e.g., last year or last three months).
On the other hand, you may choose to dispense with storing archive files at all and simply rely on Elasticsearch for archive storage, especially if you are running periodic Elasticsearch snapshot backups and/or a multi-node Elasticsearch cluster with shard replicas for high availability. You could even use a cron job to move snapshotted indexes to a final data storage server and sign them using MD5 and SHA1 algorithms.