Components
The Wazuh platform provides features to protect your cloud, container, and server workloads. These include log data analysis, intrusions and malware detection, file integrity monitoring, configuration assessment, vulnerability detection, and support for regulatory compliance. The Wazuh solution is based on the following three components:
Wazuh agent: Installed on endpoints such as laptops, desktops, servers, cloud instances or virtual machines, it provides prevention, detection and response capabilities. It supports Windows, Linux, MacOS, HP-UX, Solaris and AIX platforms.
Wazuh server: It analyzes data received from the agents, processing it through decoders and rules, and using threat intelligence to look for well-known indicators of compromise (IOCs). A single server can analyze data from hundreds or thousands of agents, and scale horizontally when set up as a cluster. The server is also used to manage the agents, configuring and upgrading them remotely when necessary.
Elastic Stack: It indexes and stores alerts generated by the Wazuh server. Besides, the integration between Wazuh and Kibana provides a powerful user interface for data visualization and analysis. This interface is also used to manage Wazuh configuration and to monitor its status.
In addition to agent-based monitoring capabilities, the Wazuh platform can monitor agent-less devices such as firewalls, switches, routers, or network IDS, among others. For example, a system log data can be collected via Syslog, and its configuration can be monitored through periodic probing of its data (e.g. via SSH or through an API).
The diagram below represents the Wazuh components and data flow. It shows the three main components of the solution, which are the Wazuh agent, the Wazuh server, and the Elastic Stack.
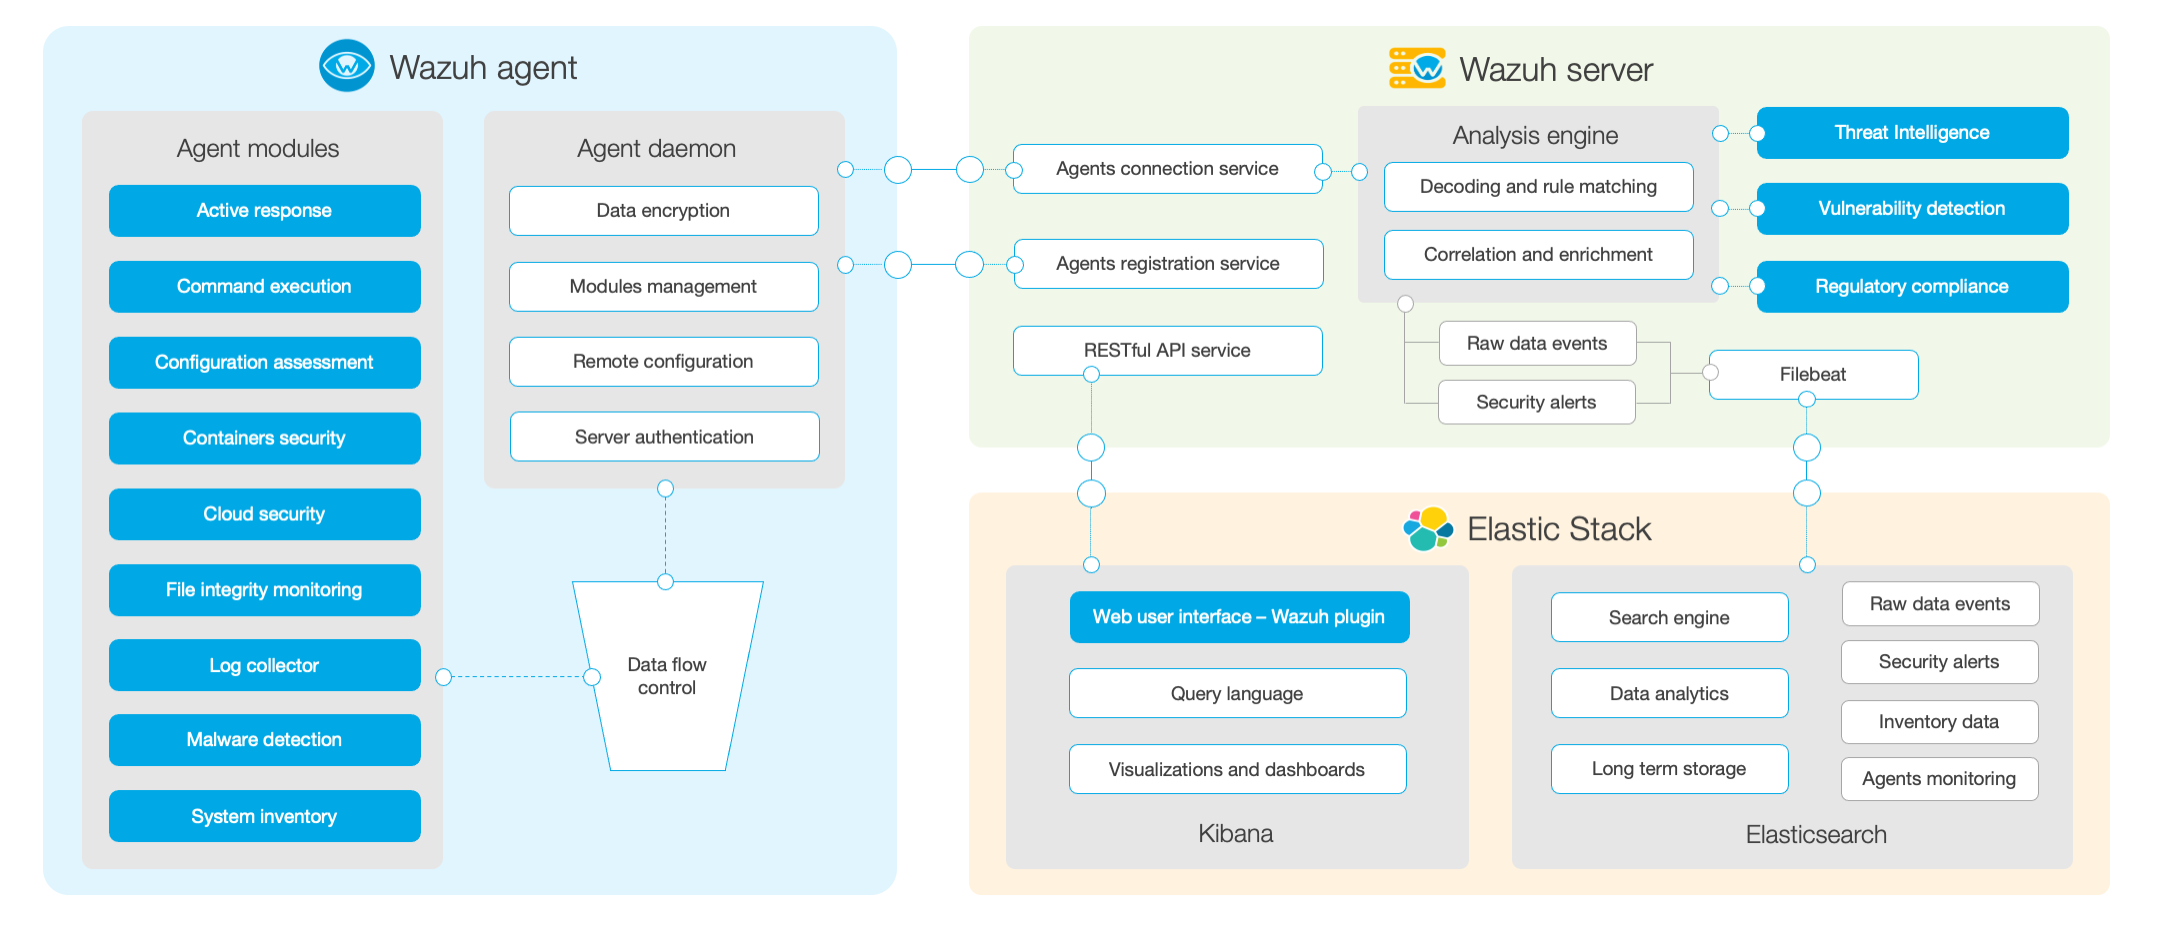
- In this section of the documentation you will find a description of the three Wazuh components: