Survive a log flood
A centralized logging system needs to be able to process many events per second (EPS) from many different log sources at the same time, but sometimes things just get completely out of hand. A variety of problems like infinite loop conditions, poorly written software, misconfigured applications or even malicious actors can cause one or a few individual devices to suddenly start producing an unstopping stream of log messages rushing at your logging system at a rate of hundreds or even thousands of events per second. When such a device or devices suddenly take up vastly more than their fair share of network and log processing resources, it can become widely disruptive.
Log flooding can saturate your network bandwidth and/or overtax your Wazuh and Elastic system components while one gigabyte after another of (often repetitive) log messages are being reanalyzed and churned to disk.
Thankfully the Wazuh agent has a flood protection mechanism to prevent one system from creating disruptions to your network or to your Wazuh/Elastic services. In this lab we will create a small log flood and observe how it is gracefully contained by the Wazuh agent before it departs the system where the logs are produced. We will also take a look at the leaky bucket queue that Wazuh uses to accomplish this. Lastly, we will note the alerts that are produced to keep us informed about the onset of, escalation of, and recovery from log flooding events.
Configure the Wazuh agent client buffer on linux-agent
In this lab, we will limit agent log production to 50 events per second (EPS) in order to easily simulate a flooding event. Open
/var/ossec/etc/ossec.confand find the <client_buffer> section, and edit within it the<events_per_second>value:<client_buffer> <!-- Agent buffer options --> <disabled>no</disabled> <queue_size>5000</queue_size> <events_per_second>50</events_per_second> </client_buffer>
Warning
These settings are small for simulation purposes. You would not want to make them this low in production.
Note
By default, this limit is prevented from being set to lower than 50, you may override that by changing the
agent.min_epsinternal options setting. This does not actually set an EPS limit. Rather, it is a strictly agent-side setting that protects the agent from being inadvertently subjected to overly restrictive EPS limits pushed to it via Wazuh manager centralized configuration. Here we make it possible to enforce an EPS as low as 10.:# echo "agent.min_eps=10" >> /var/ossec/etc/local_internal_options.confRestart the Wazuh agent so the configuration may take effect:
For Systemd:
# systemctl restart wazuh-agent
For SysV Init:
# service wazuh-agent restart
Note
The client buffer is explained in detail in the Wazuh User manual's Anti-flooding mechanism section. In brief, it allows a Wazuh agent to limit the rate at which it sends log events to the Wazuh manager. If events are produced at a rate in excess of the configured EPS limit, then they are stored in a leaky bucket queue until the EPS rate slows down enough that the queue contents can be sent along to the Wazuh manager. If the queue gets full, then any new events are dropped, i.e the bucket leaks. Various alerts are sent to the Wazuh manager about all of this.
Wazuh agent Client Buffer

Decrease minimum log alert level
We will generate a flood of messages with the word "fatal" so they will trigger
generic Wazuh rule 1002 which has a low severity level (2). By default,
Wazuh manager does not record alerts on rules of severity levels less than 3,
so for this lab we will lower the threshold:
Edit
/var/ossec/etc/ossec.confand change<log_alert_level>from 3 to 1 so that the<alerts>section looks like the one below. Now alerts of all severity levels except level 0 will show up in Kibana.<alerts> <log_alert_level>1</log_alert_level> <email_alert_level>12</email_alert_level> </alerts>
Restart Wazuh manager.
For Systemd:
# systemctl restart wazuh-manager
For SysV Init:
# service wazuh-manager restart
Generate a log flood on linux-agent
If you do not have it already, install netcat:
[root@linux-agent centos]# yum install nmap-ncat
Create a script called
/usr/local/bin/makeflood, with this content:#!/bin/bash for i in {1..10000} do echo -n "1:floodtest:Feb 3 03:08:47 linux-agent centos: fatal firehose $i" | ncat -Uu /var/ossec/queue/ossec/queue echo -n "." done
Note
While we could write records to a log file monitored by Wazuh agent, this script takes an even faster approach of writing records directly to the Wazuh agent's internal socket. This is where components like ossec-logcollector streams new log lines from log files.
The script uses netcat to do this, but any tool that can write datagrams to a Unix socket will do the job. Sometimes it is desirable to have a script on a Wazuh agent send results directly back to the Wazuh manager while completely bypassing the agent's filesystem.
The quoted log line that is piped to netcat consists of three colon-separated parts. First, the "1" corresponds to the syslog log type. The second field causes the location metadata value to be set to "floodtest". After that is a log line just like you might see in
/var/log/messages.Make the script executable and then run it to generate a rapid flood of 10,000 log entries.
# chmod 700 /usr/local/bin/makeflood
# makeflood
Notice that the periods representing log messages are scrolling across the screen at a rate well above our 50 EPS limit.
See what happened according to Kibana
Query Kibana for "firehose". Click on [Add] next to "full_log" for readability. Change the scale from "Auto" to "Second".
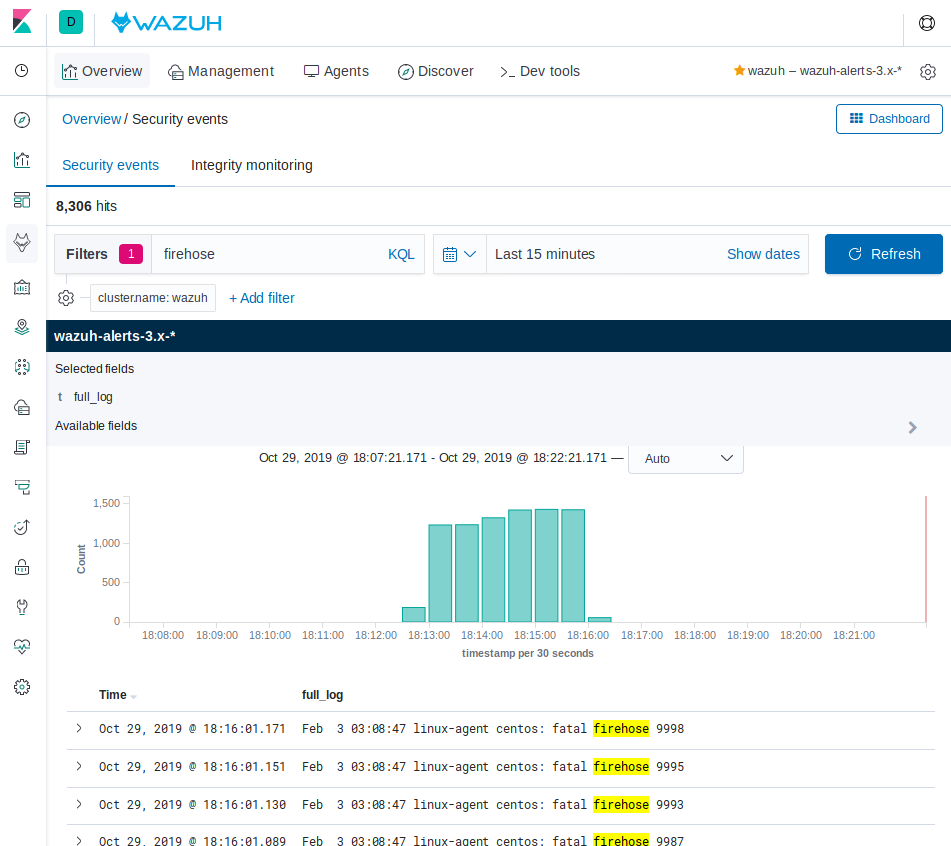
Notice that the flooding events only arrived at the Wazuh manager at a rate of 50 EPS, our intended limit. The client buffer EPS limit worked!
Notice that only 8,306 hits are reported for a flood. It appears some of the flooded events were lost.
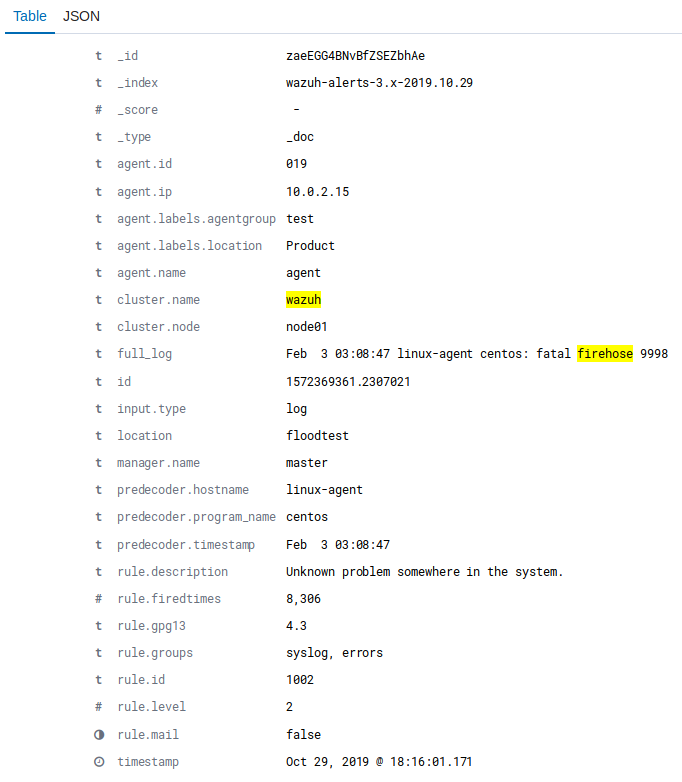
Expand one of the "firehose" records and compare the field values to the script you used to produce these records.
Query Kibana for "agent_flooding". Click [Add] additionally next to "rule.description" and "data.level" for readability.
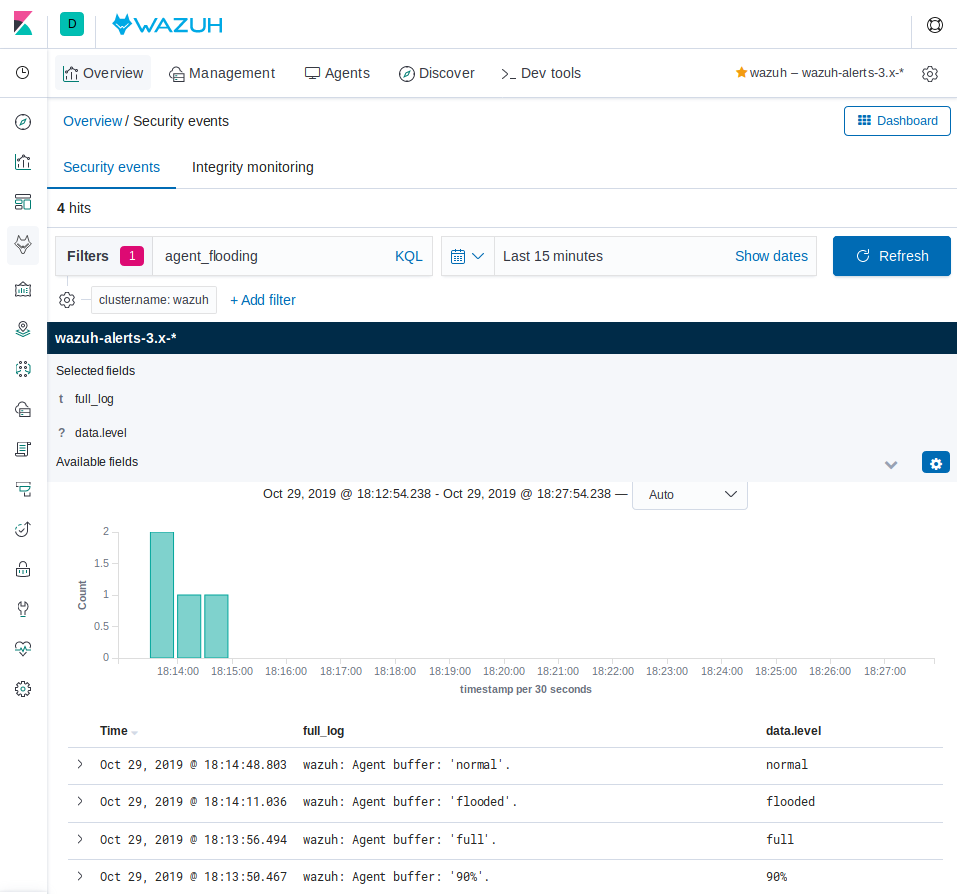
Observe how Wazuh alerts us at various stages of a flooding event so that we can know when we need to intervene with an over-logging system that is not recovering to a normal state on its own.
Return settings back to normal
In linux-agent, edit the
<client_buffer>section of/var/ossec/etc/ossec.conffile back to this:<client_buffer> <!-- Agent buffer options --> <disabled>no</disabled> <queue_size>5000</queue_size> <events_per_second>500</events_per_second> </client_buffer>
Restart the Wazuh agent:
For Systemd:
# systemctl restart wazuh-agent
For SysV Init:
# service wazuh-agent restart
In wazuh-manager, edit the
<alerts>section of/var/ossec/etc/ossec.conffile back to this:<alerts> <log_alert_level>3</log_alert_level> <email_alert_level>12</email_alert_level> </alerts>
Restart the Wazuh manager:
For Systemd:
# systemctl restart wazuh-manager
For SysV Init:
# service wazuh-manager restart
Congratulations on completing this lab. You survived the log flood!