Wazuh server
The Wazuh server component is in charge of analyzing the data received from the agents, triggering alerts when threats or anomalies are detected. It is also used to manage the agents configuration remotely and to monitor their status.
The Wazuh server uses threat intelligence sources to improve its detection capabilities. It also makes use of regulatory compliance requirements (e.g. PCI DSS, HIPAA, NIST 800-53...) and Mitre ATT&CK framework to enrich alerts data, providing useful context around them.
Additionally, the Wazuh server can be integrated with external software such as ticketing systems (e.g. Service Now, Jira, PagerDuty) and instant messaging platforms (e.g. Slack). This is convenient to streamline security operations.
Server architecture
The Wazuh server runs the analysis engine, the Wazuh RESTful API, the agents registration service, the agents connection service, the Wazuh cluster daemon, and Filebeat. The diagram below represents the server architecture and components:
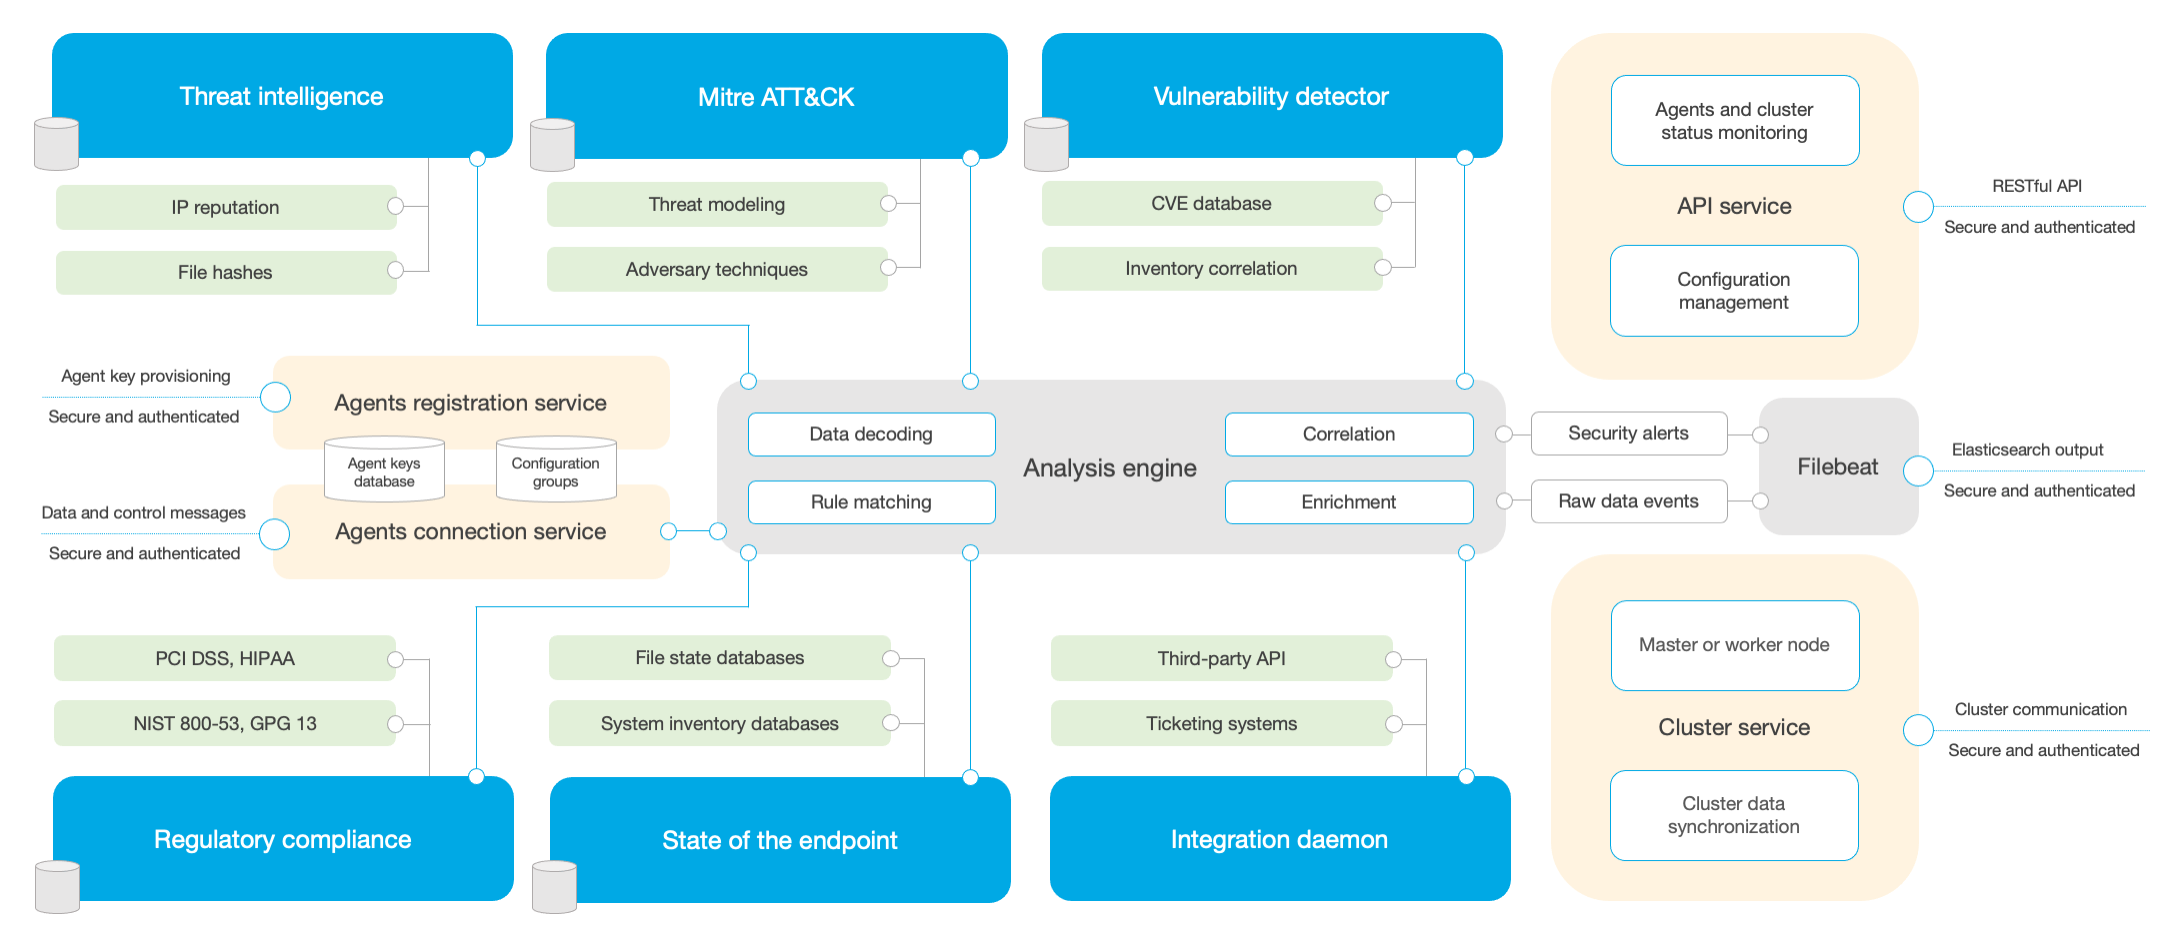
The server usually runs on a stand-alone physical machine, virtual machine, docker container, or cloud instance. It is installed on a Linux operating system. Below is a list of the main server components:
Agents registration service: It is used to register new agents by provisioning and distributing pre-shared authentication keys that are unique to each agent. This process runs as a network service and supports authentication via TLS/SSL certificates or by providing a fixed password.
Agents connection service: This is the service that receives data from the agents. It makes use of the pre-shared keys to validate each agent identity and to encrypt the communications between the agent and the Wazuh server. Additionally, this service is used to provide centralized configuration management, being able to push new agent settings remotely.
Analysis engine: This is the process that performs the data analysis. It utilizes decoders to identify the type of information being processed (e.g. Windows events, SSHD logs, web server logs, etc.) and to extract relevant data elements from the log messages (e.g. source IP address, event ID, username, etc.). Next, by using rules, it identifies specific patterns in the decoded events which could trigger alerts and possibly even call for automated countermeasures (e.g. an IP ban on the firewall).
Wazuh RESTful API: This service provides an interface to interact with the Wazuh infrastructure. It is used to manage agents and servers configuration settings, to monitor the infrastructure status and overall health, to manage and edit Wazuh decoders and rules, and to query about the state of the monitored endpoints. It is also used by the Wazuh web user interface, which is the Kibana app.
Wazuh cluster daemon: This service is used to scale Wazuh servers horizontally, deploying them as a cluster. This kind of configuration, in combination with a network load balancer, provides high-availability and load balancing. The Wazuh cluster daemon is what Wazuh servers use to communicate with each other and to keep synchronized.
Filebeat: It is used to ship events and alerts to Elasticsearch. It reads the output of Wazuh analysis engine and ships events in real time. It also provides load balancing when connected to a multi-node Elasticsearch cluster.