Catch suspicious network traffic
Wazuh is an excellent HIDS (Host-based Intrusion Detection System) among other things. In addition to it's rule-based analysis of log events from agents and other devices, it also performs file integrity monitoring and anomaly detection. This provides a great deal of insight into the security of your digital assets. However, some security issues are most successfully detected by inspecting a server's actual network traffic, which generally is not accounted for in logs. This is where a NIDS (Network Intrusion Detection System) can provide additional insight into your security in a way that is highly complimentary to the HIDS functionality in Wazuh.
Suricata is one such NIDS solution, which is open source and can be quickly deployed either on dedicated hardware for monitoring one or more transit points on your network, or directly on existing Unix-like hosts to monitor just their own network traffic. Because Suricata is capable of generating JSON logs of NIDS events, it integrates beautifully with Wazuh.
In this lab we will deploy Suricata on linux-agent and elastic-server such that Wazuh picks up the Suricata NIDS events so can be seen in Kibana. Instead of making the same Wazuh config changes to both Linux agents, we will make use of Wazuh's centralized configuration feature to push out the extra Suricata-related Wazuh configuration to the appropriate agents. Lastly, we will do a little GeoIP enrichment of the Suricata NIDS events with Logstash, showing how easily we can augment existing log records with additional context information to make them more valuable.
Set up Suricata on both elastic-server and linux-agent
On both agents as root, install Suricata and its dependencies, along with the Emerging Threats Open ruleset.
cd /root
yum -y install epel-release wget jq
curl -O https://copr.fedorainfracloud.org/coprs/jasonish/suricata-stable/repo/epel-7/jasonish-suricata-stable-epel-7.repo
yum -y install suricata
wget https://rules.emergingthreats.net/open/suricata-4.0/emerging.rules.tar.gz
tar zxvf emerging.rules.tar.gz
rm /etc/suricata/rules/* -f
mv rules/*.rules /etc/suricata/rules/
rm -f /etc/suricata/suricata.yaml
wget -O /etc/suricata/suricata.yaml http://www.branchnetconsulting.com/wazuh/suricata.yaml
systemctl daemon-reload
systemctl enable suricata
systemctl start suricata
Trigger NIDS alerts on both agents and see the output
Generate a specific web request from both agents, known to trip NIDS rules:
curl http://testmyids.comOn the agent, look at the latest alert in both the standard Suricata alert log and also in the JSON alert log.
tail -n1 /var/log/suricata/fast.log
tail -n1 /var/log/suricata/eve.json | jq .
Observe that the standard log is fairly simple with limited information.
22:02/09/2018-21:32:13.120749 [**] [1:2100498:7] GPL ATTACK_RESPONSE id check returned root [**] [Classification: Potentially Bad Traffic] [Priority: 2] {TCP} 82.165.177.154:80 -> 172.30.0.30:45504See how much more data is provided in the JSON output, and how field names are provided.
{
"timestamp": "2018-02-09T21:32:13.120749+0000",
"flow_id": 659410948727787,
"in_iface": "eth0",
"event_type": "alert",
"src_ip": "82.165.177.154",
"src_port": 80,
"dest_ip": "172.30.0.30",
"dest_port": 45504,
"proto": "TCP",
"alert": {
    "action": "allowed",
    "gid": 1,
    "signature_id": 2100498,
    "rev": 7,
    "signature": "GPL ATTACK_RESPONSE id check returned root",
    "category": "Potentially Bad Traffic",
    "severity": 2
  },
"http": {
    "hostname": "testmyids.com",
    "url": "/",
    "http_user_agent": "curl/7.29.0",
    "http_content_type": "text/html",
    "http_method": "GET",
    "protocol": "HTTP/1.1",
    "status": 200,
    "length": 39
  },
"app_proto": "http",
"flow": {
    "pkts_toserver": 5,
    "pkts_toclient": 4,
    "bytes_toserver": 415,
    "bytes_toclient": 522,
    "start": "2018-02-09T21:32:12.861163+0000"
  }
}
Not only do we get the basic NIDS alert details, but Suricata also includes http metadata and flow details that can be very helpful for alert assessment.
You might also be interested to see the actual NIDS rule that we triggered (found in
/etc/suricata/rules/emerging-attack_response.rules):alert ip any any -> any any (msg:"GPL ATTACK_RESPONSE id check returned root"; content:"uid=0|28|root|29|"; classtype:bad-unknown; sid:2100498; rev:7; metadata:created_at 2010_09_23, updated_at 2010_09_23;)
Get the Suricata JSON data to Wazuh
Suricata is configured to write alerts to /var/log/suricata/eve.json which Wazuh does not monitor by default. Both of our
Linux agents need an additional <localfile> config section like this:
<localfile>
    <log_format>json</log_format>
    <location>/var/log/suricata/eve.json</location>
</localfile>
Instead of adding the above directly to ossec.conf on each Linux agent, this time let's use Wazuh manager's centralized agent
configuration facility. This is a powerful feature that makes it feasible to manage the varied configurations of a diverse fleet of systems running
Wazuh agent. Search the online documentation for "Centralized Configuration" for the full details about this. In short, groups of agents share common
configuration content served up to them by Wazuh manager. Agents automatically pick up and apply changes made to this content on the manager, and merge
the shared configuration with their local configuration.
Add elastic-server and linux-agent to a new agent group called "linux". Go to wazuh-manager and:
Create an agent group called "linux" which will cover all shared Linux agent configuration elements.
[root@wazuh-manager centos]# /var/ossec/bin/agent_groups -a -g linux -q
Group 'linux' created.
List the registered agents on wazuh-manager with the
manage_agents -lcommand. Note the id numbers of the Linux agents.[root@wazuh-manager centos]# /var/ossec/bin/manage_agents -l
Available agents:
ID: 001, Name: linux-agent, IP: any
ID: 002, Name: elastic-server, IP: any
ID: 003, Name: windows-agent, IP: any
Add each Linux agent to this new agent group by its ID number:
[root@wazuh-manager centos]# /var/ossec/bin/agent_groups -a -i 001 -g linux -q
Group 'linux' set to agent '001'.
[root@wazuh-manager centos]# /var/ossec/bin/agent_groups -a -i 002 -g linux -q
Group 'linux' set to agent '002'.
Put our Suricata-specific Wazuh agent config into the shared agent.conf file belonging to the "linux" agent group. In wazuh-manager, edit this file:
/var/ossec/etc/shared/linux/agent.conf. Make it look like this:<agent_config> <localfile> <log_format>json</log_format> <location>/var/log/suricata/eve.json</location> </localfile> </agent_config>
Confirm this shared config is valid by running
verify-agent-confon wazuh-manager. Always run this after changing agent conf to prevent accidental deployment of a broken agent config to your agents.[root@wazuh-manager centos]# /var/ossec/bin/verify-agent-confverify-agent-conf: Verifying [/var/ossec/etc/shared/default/agent.conf] verify-agent-conf: OK verify-agent-conf: Verifying [/var/ossec/etc/shared/linux/agent.conf] verify-agent-conf: OK
Since the config is proven valid, restart Wazuh manager to deploy the new configuration to the agents.
For Systemd:
# systemctl restart wazuh-manager
For SysV Init:
# service wazuh-manager restart
Each agent should pull down and apply this additional configuration almost immediately. You can find the fetched configuration on each agent at
/var/ossec/etc/shared/agent.conf.
See Suricata NIDS events in Kibana
On each Linux agent, rerun the NIDS-tripping curl command again:
curl http://testmyids.comSearch Kibana for
rule.id:86601. That is the rule that notices Suricata alerts. Pick these fields for readability:agent.name
data.alert.signature
data.proto
data.src_ip
data.dest_ip
data.dest_port
data.http.hostname
Expand one of the events and look over the vast amount of information available.
Note
Yellow warning triangles on Kibana fields indicate that Kibana has never seen these new fields before and needs its field list refreshed. Click on the Management gear icon on the left, then on "Index Patterns", and then on the circular double arrow button in the upper right, and then on [Refresh fields]. Click back on the Discover icon on the upper left to return to your search and notice that when you expand a record, the warning triangles on the new fields are gone.
Observe how Wazuh decodes Suricata events
Find the full log of the event you just triggered. You can do so like this:
[root@linux-agent centos]# tail -n1 /var/log/suricata/eve.json
{"timestamp":"2018-02-09T21:32:13.120749+0000","flow_id":659410948727787,"in_iface":"eth0","event_type":"alert","src_ip":"82.165.177.154","src_port":80,"dest_ip":"172.30.0.30","dest_port":45504,"proto":"TCP","alert":{"action":"allowed","gid":1,"signature_id":2100498,"rev":7,"signature":"GPL ATTACK_RESPONSE id check returned root","category":"Potentially Bad Traffic","severity":2},"http":{"hostname":"testmyids.com","url":"/","http_user_agent":"curl/7.29.0","http_content_type":"text/html","http_method":"GET","protocol":"HTTP/1.1","status":200,"length":39},"app_proto":"http","flow":{"pkts_toserver":5,"pkts_toclient":4,"bytes_toserver":415,"bytes_toclient":522,"start":"2018-02-09T21:32:12.861163+0000"}}
Run
ossec-logteston wazuh-manager and paste in the copied Suricata alert record, observing how it is analyzed:**Phase 1: Completed pre-decoding. full event: '{"timestamp":"2018-02-09T21:32:13.120749+0000","flow_id":659410948727787,"in_iface":"eth0","event_type":"alert","src_ip":"82.165.177.154","src_port":80,"dest_ip":"172.30.0.30","dest_port":45504,"proto":"TCP","alert":{"action":"allowed","gid":1,"signature_id":2100498,"rev":7,"signature":"GPL ATTACK_RESPONSE id check returned root","category":"Potentially Bad Traffic","severity":2},"http":{"hostname":"testmyids.com","url":"/","http_user_agent":"curl/7.29.0","http_content_type":"text/html","http_method":"GET","protocol":"HTTP/1.1","status":200,"length":39},"app_proto":"http","flow":{"pkts_toserver":5,"pkts_toclient":4,"bytes_toserver":415,"bytes_toclient":522,"start":"2018-02-09T21:32:12.861163+0000"}}' timestamp: '(null)' hostname: 'wazuh-manager' program_name: '(null)' log: '{"timestamp":"2018-02-09T21:32:13.120749+0000","flow_id":659410948727787,"in_iface":"eth0","event_type":"alert","src_ip":"82.165.177.154","src_port":80,"dest_ip":"172.30.0.30","dest_port":45504,"proto":"TCP","alert":{"action":"allowed","gid":1,"signature_id":2100498,"rev":7,"signature":"GPL ATTACK_RESPONSE id check returned root","category":"Potentially Bad Traffic","severity":2},"http":{"hostname":"testmyids.com","url":"/","http_user_agent":"curl/7.29.0","http_content_type":"text/html","http_method":"GET","protocol":"HTTP/1.1","status":200,"length":39},"app_proto":"http","flow":{"pkts_toserver":5,"pkts_toclient":4,"bytes_toserver":415,"bytes_toclient":522,"start":"2018-02-09T21:32:12.861163+0000"}}' **Phase 2: Completed decoding. decoder: 'json' timestamp: '2018-02-09T21:32:13.120749+0000' flow_id: '659410948727787.000000' in_iface: 'eth0' event_type: 'alert' src_ip: '82.165.177.154' src_port: '80' dest_ip: '172.30.0.30' dest_port: '45504' proto: 'TCP' alert.action: 'allowed' alert.gid: '1' alert.signature_id: '2100498' alert.rev: '7' alert.signature: 'GPL ATTACK_RESPONSE id check returned root' alert.category: 'Potentially Bad Traffic' alert.severity: '2' http.hostname: 'testmyids.com' http.url: '/' http.http_user_agent: 'curl/7.29.0' http.http_content_type: 'text/html' http.http_method: 'GET' http.protocol: 'HTTP/1.1' http.status: '200' http.length: '39' app_proto: 'http' flow.pkts_toserver: '5' flow.pkts_toclient: '4' flow.bytes_toserver: '415' flow.bytes_toclient: '522' flow.start: '2018-02-09T21:32:12.861163+0000' **Phase 3: Completed filtering (rules). Rule id: '86601' Level: '3' Description: 'Suricata: Alert - GPL ATTACK_RESPONSE id check returned root' **Alert to be generated.Notice the decoder used is just called "json". This decoder is used whenever Wazuh detects JSON records. With Wazuh's ability to natively decode incoming JSON log records, you do not have to build your own decoders for applications that support JSON logging.
Spice things up with a little GeoIP
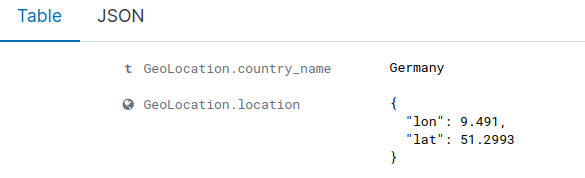
You may have noticed that there were no Geolocation fields in the Kibana records for Suricata events. In Wazuh's default configuration, Geolocation is only performed on fields data.srcip, data.win.eventdata.ipAddress and data.aws.sourceIPAddress , while with Suricata events we would need to act on fields
data.src_ip and data.dest_ip. We are going to change our configuration to show more information from data.src_ip:
On wazuh-manager, edit
/usr/share/filebeat/module/wazuh/alerts/ingest/pipeline.jsonadding the new IP field insideprocessors, along the other Geolocation fields:{ "geoip": { "field": "data.src_ip", "target_field": "GeoLocation", "properties": ["city_name", "country_name", "region_name", "location"], "ignore_missing": true, "ignore_failure": true } },We now need to delete the current pipeline. In Kibana, go to
Dev Toolsclicking on the Wrench icon. Then execute the following:DELETE _ingest/pipeline/filebeat-7.9.1-wazuh-alerts-pipeline
We restart Filebeat in wazuh-manager:
[root@wazuh-manager centos]# systemctl restart filebeat
Trigger some more NIDS events on one of more of your Linux agents with:
curl ``http://testmyids.com``.Look through the new Suricata events in Kibana, observing they now have source geoip fields populated. Private IPs of course cannot be geolocated.
If you have time, you could also...
Build a CDB list of the the signature_id values of Suricata rules that call for immediate attention. Maybe these would be special NIDS events you would want to get SMS alerted about in real time. Create a custom child rule to 86601 that looks for matches in your CDB and has a high severity level like 12.
Build another CDB list of signature_id values of rules you choose to classify as "noise" and want to suppress entirely. Then make another child rule with a severity level of 0.
Experiment with making Suricata-specific visualization in Kibana. Create a new dashboard to pull them all together.