Components
Wazuh’s main components are the agent that runs on each monitored host and the server that analyzes data received from the agents and agentless sources like syslog. In addition, the server forwards event data to an Elasticsearch cluster where information is indexed and stored.
Wazuh agent
The Wazuh agent runs on Windows, Linux, Solaris, BSD, and Mac operating systems. It is used to collect different types of system and application data that it forwards to the Wazuh server through an encrypted and authenticated channel. In order to establish this secure channel, a registration process involving unique pre-shared keys is utilized.
The agents can be used to monitor physical servers, virtual machines and cloud instances (e.g. Amazon AWS, Azure or Google Cloud). Pre-compiled agent installation packages are available for Linux, HP-UX, AIX, Solaris, Windows, and Darwin (Mac OS X).
On Unix-based operating systems, the agent runs multiple processes which communicate with each other through a local Unix domain socket. One of those processes is in charge of the communication and data sending to the Wazuh server. On Windows systems, there is only one agent process running multiple tasks using mutexes.
Different agent tasks or processes are used to monitor the system in different ways (e.g., monitoring file integrity, reading system log messages and scanning system configurations).
The diagram below represents the internal tasks and processes that take place at the agent level:

All agent processes have different purposes and settings. Here is a brief description of what is done by each of them:
Rootcheck: This process performs multiple tasks related to the detection of rootkits, malware and system anomalies. It also runs certain basic security checks against system configuration files.
Log Collector: This agent component is used to read operating system and application log messages, including flat log files, standard Windows event logs and even Windows Event Channels. It can also be configured to periodically run and capture the output of specific commands.
Syscheck: This process performs file integrity monitoring (FIM) and can also monitor registry keys on Windows systems. It is capable of detecting changes in a file's content, ownership and other attributes, as well as noting the creation and deletion of files. While it performs periodic FIM scans by default, it can also be configured to communicate with the operating system kernel to do real-time detection of file changes and to produce a detailed change report (diffs) of text files.
OpenSCAP: This module uses published OVAL (Open Vulnerability Assessment Language) and XCCDF (Extensible Configuration Checklist Description Format) baseline security profiles. By periodically scanning a system, it can find vulnerable applications or configurations that do not follow well-known standards, such as those defined in CIS (Center for Internet Security) benchmarks.
Agent Daemon: This is the process that receives the data generated or collected by all other agent components. It compresses, encrypts and delivers the data to the server through an authenticated channel. This process runs in an isolated “chroot” (change root) environment, meaning that it has limited access to the monitored system. This improves the overall security of the agent because it is the only process that connects to the network.
Wazuh server
The server component is in charge of analyzing the data received from the agents and triggering alerts when an event matches a rule (e.g. intrusion detected, file changed, configuration not compliant with policy, possible rootkit, etc...).
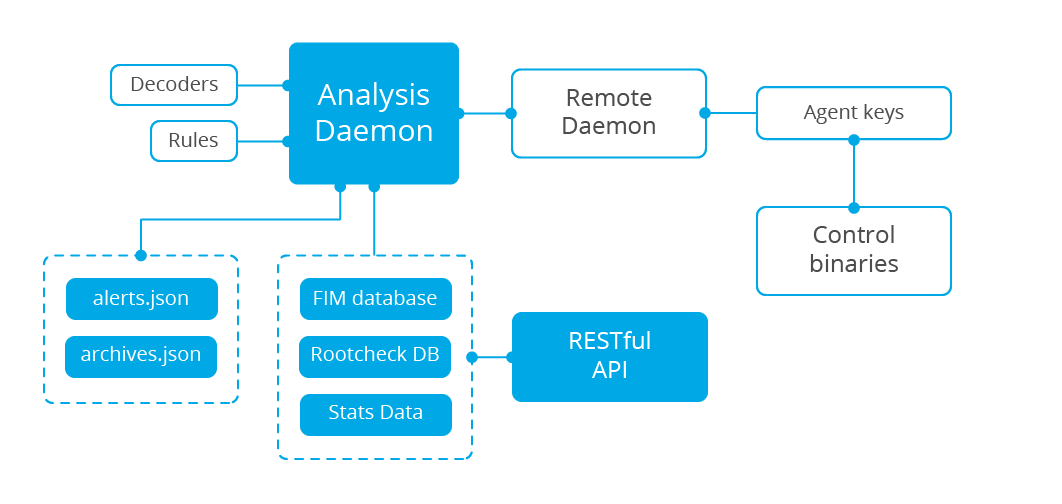
The server usually runs on a stand-alone physical machine, virtual machine or cloud instance and runs agent components with the purpose of monitoring itself. Below is a list of the main server components:
Registration service: This is used to register new agents by provisioning and distributing pre-shared authentication keys that are unique to each agent. This process runs as a network service and supports authentication via TLS/SSL and/or by a fixed password.
Remote daemon service: This is the service that receives data from the agents. It makes use of the pre-shared keys to validate each agent's identity and to encrypt the communications between the agent and the manager.
Analysis daemon: This is the process that performs data analysis. It utilizes decoders to identify the type of information being processed (e.g. Windows events, SSHD logs, web server logs, etc.) and then extract relevant data elements from the log messages (e.g. source ip, event id, user, etc.). Next, by using rules, it can identify specific patterns in the decoded log records which could trigger alerts and possibly even call for automated countermeasures (active responses) like an IP ban on the firewall.
RESTful API: This provides an interface to manage and monitor the configuration and deployment status of agents. It is also used by the Wazuh web interface, which is a Kibana app.
Elastic Stack
Elastic Stack is a unified suite of popular open source projects for log management, including Elasticsearch, Kibana, Filebeat, and others. The projects that are especially relevant to the Wazuh solution are:
Elasticsearch: A highly scalable, full-text search and analytics engine. Elasticsearch is distributed, meaning the data (indices) are divided into shards and each shard can have zero or more replicas.
Kibana: A flexible and intuitive web interface for mining, analyzing, and visualizing data. It runs on top of the content indexed on an Elasticsearch cluster.
Filebeat: A lightweight forwarder used to convey logs across a network, usually to Elasticsearch.
Wazuh integrates with Elastic Stack to provide a feed of already decoded log messages to be indexed by Elasticsearch, as well as a real-time web console for alert and log data analysis. In addition, the Wazuh user interface (running on top of Kibana) can be used for management and monitoring of your Wazuh infrastructure.
An Elasticsearch index is a collection of documents that have somewhat similar characteristics (like certain common fields and shared data retention requirements). Wazuh utilizes as many as three different indices, created daily, to store different event types:
wazuh-alerts: Index for alerts generated by the Wazuh server each time an event trips a rule.
wazuh-events: Index for all events (archive data) received from the agents whether or not they trip a rule.
wazuh-monitoring: Index for data related to agent status over time. It is used by the web interface to represent when individual agents are or have been “Active”, “Disconnected” or “Never connected”.
An index is composed of documents. For the indices above, documents are individual alerts, archived events or status events.
An Elasticsearch index is divided into one or more shards and each shard can optionally have one or more replicas. Each primary and replica shard is an individual Lucene index. Thus, an Elasticsearch index is made up of many Lucene indexes. When a search is run on an Elasticsearch index, the search is executed on all the shards in parallel and the results are merged. Dividing Elasticsearch indexes into multiple shards and replicas is used in multiple-node Elasticsearch clusters with the purpose of scaling out searches and for high availability. Single-node Elasticsearch clusters normally have only one shard per index and no replicas.