How it works
The below image illustrations how events flow through the Wazuh environment.
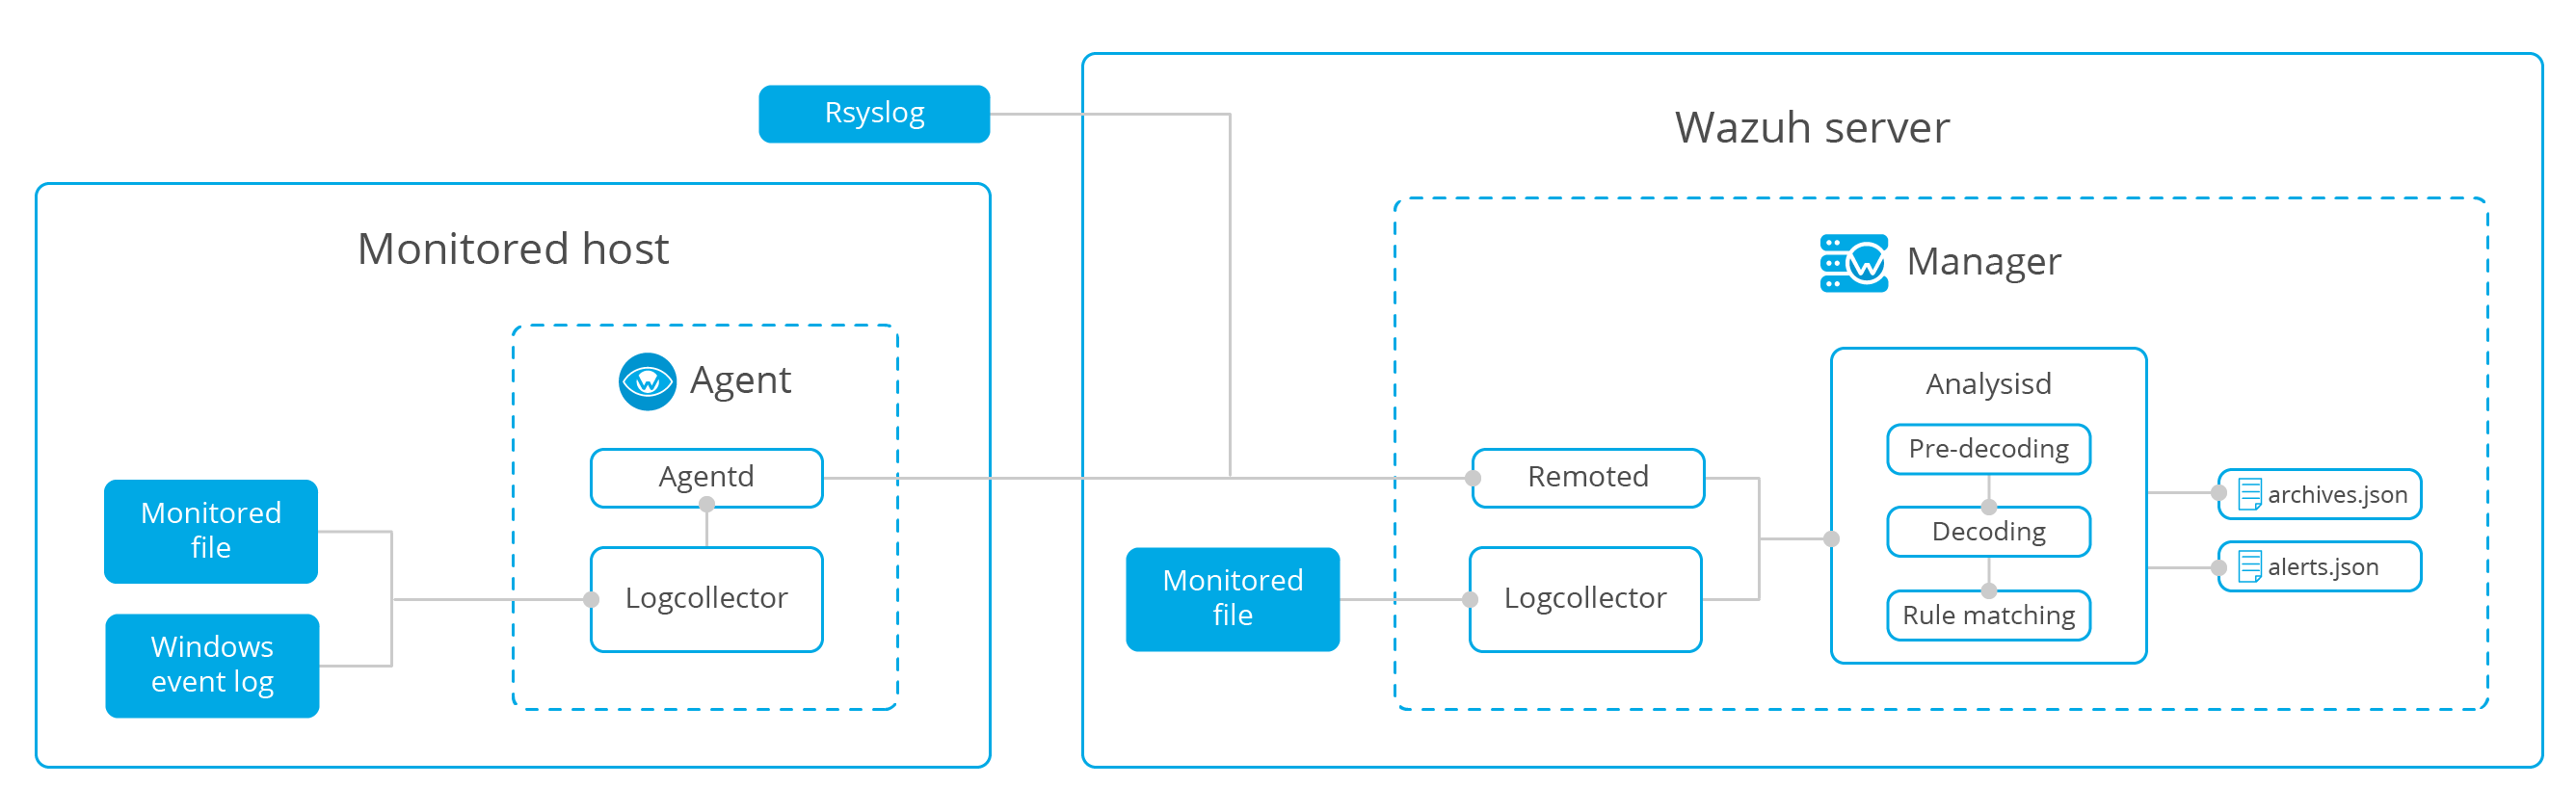
Log collection
Log files
The Log analysis engine can be configured to monitor specific files on the servers.
Linux:
<localfile>
  <location>/var/log/example.log</location>
  <log_format>syslog</log_format>
</localfile>
Windows:
<localfile>
  <location>C:\myapp\example.log</location>
  <log_format>syslog</log_format>
</localfile>
Windows event logs
Wazuh can monitor classic Windows event logs, as well as the newer Windows event channels.
Event log:
<localfile>
  <location>Security</location>
  <log_format>eventlog</log_format>
</localfile>
Event channel:
<localfile>
  <location>Microsoft-Windows-PrintService/Operational</location>
  <log_format>eventchannel</log_format>
</localfile>
Remote syslog
In order to integrate network devices such as routers, firewalls, etc, the log analysis component can be configured to receive log events through syslog. To do that we have two methods available:
One option is for Wazuh to receive syslog logs by a custom port:
<ossec_config>
  <remote>
    <connection>syslog</connection>
    <port>513</port>
    <protocol>udp</protocol>
    <allowed-ips>192.168.2.0/24</allowed-ips>
  </remote>
<ossec_config>
<connection>syslog</connection>indicates that the manager will accept incoming syslog messages from across the network.<port>513</port>defines the port that Wazuh will listen to retrieve the logs. The port must be free.<protocol>udp</protocol>defines the protocol to listen the port. It can be UDP or TCP.<allowed-ips>192.168.2.0/24</allowed-ips>defines the network or IP from which syslog messages will be accepted.
The other option store the logs in a plaintext file and monitor that file with Wazuh. If a /etc/rsyslog.conf configuration file is being used and we have defined where to store the syslog logs we can monitor them in Wazuh ossec.conf using a <localfile> block with syslog as the log format.
<localfile>
  <log_format>syslog</log_format>
  <location>/custom/file/path</location>
</localfile>
<log_format>syslog</log_format>indicates the source log format, in this case, syslog format.<location>/custom/file/path</location>indicates where we have stored the syslog logs.
Analysis
Pre-decoding
In the pre-decoding phase of analysis, static information from well-known fields all that is extracted from the log header.
Feb 14 12:19:04 localhost sshd[25474]: Accepted password for rromero from 192.168.1.133 port 49765 ssh2
Extracted information:
hostname: 'localhost'
program_name: 'sshd'
Decoding
In the decoding phase, the log message is evaluated to identify what type of log it is and known fields for that specific log type are then extracted.
Sample log and its extracted info:
Feb 14 12:19:04 localhost sshd[25474]: Accepted password for rromero from 192.168.1.133 port 49765 ssh2
Extracted information:
program name: sshd
dstuser: rromero
srcip: 192.168.1.133
Rule matching
In the next phase, the extracted log information is compared to the ruleset to look for matches:
For the previous example, rule 5715 is matched:
<rule id="5715" level="3">
  <if_sid>5700</if_sid>
  <match>^Accepted|authenticated.$</match>
  <description>sshd: authentication success.</description>
  <group>authentication_success,pci_dss_10.2.5,</group>
</rule>
Note
For more information, see the Wazuh Ruleset
Alert
Once a rule is matched, the manager will create an alert as below:
** Alert 1487103546.21448: - syslog,sshd,authentication_success,pci_dss_10.2.5,
2017 Feb 14 12:19:06 localhost->/var/log/secure
Rule: 5715 (level 3) -> 'sshd: authentication success.'
Src IP: 192.168.1.133
User: rromero
Feb 14 12:19:04 localhost sshd[25474]: Accepted password for rromero from 192.168.1.133 port 49765 ssh2
By default, alerts will be generated on events that are important or of security relevance. To store all events even if they do not match a rule, enable the <logall> option.
Alerts will be stored at /var/ossec/logs/alerts/alerts.(json|log) and events at /var/ossec/logs/archives/archives.(json|log). Logs are rotated and an individual directory is created for each month and year.
Note
Archived logs are not automatically deleted by default. You can choose when to manually or automatically (e.g., cron job) delete logs according to your own legal and regulatory requirements.