Configuring a cluster
Added in version 3.0.0.
Introduction
The cluster extends the managers into a cluster of managers to enhance the availability and scalability of the service.
Reasons for using a cluster
Horizontal scalability
It multiplies Wazuh's event processing capacity and allows it to have thousands of agents reporting. Adding a new node to the cluster is very simple (just add the master's address in the configuration) and it can be automated easily, giving the user the ability to implement auto-scaling.
High availability
Servers eventually fail: hardware can be broken, a human can turn them off, the system can go down... And while the server is restored, you won't be able to see what is happening in your agents. Using a cluster you make sure your agents will always have a manager to report to.
Types of nodes
Master
The master node centralizes and coordinates worker nodes, making sure the critical and required data is consistent across all nodes. It provides the centralization of the following:
Agent registration.
Agent deletion.
Rules, decoders and CDB lists synchronization.
Configuration of agents grouping.
Warning
The master doesn't send its local configuration file to the workers. If the configuration is changed in the master node, it should be changed manually in the workers. Take care of not overwriting the cluster section in the local configuration of each worker.
Warning
When rules, decoders or CDB lists are synchronized, the worker nodes are not restarted. They must be restarted manually in order to apply the received configuration.
All communications among nodes in the cluster are encrypted using AES algorithm.
Worker
Worker nodes are responsible of two main tasks:
Synchronizing integrity files from the master node.
Sending agent status updates to the master.
Getting started
Deploying a Wazuh cluster
Set the cluster configuration
Using the
<cluster>section in the Local configuration, set the cluster configuration as below:<node_type>: Set the node type.<key>: The key must be 32 characters long and should be the same for all of the nodes of the cluster. You may use the following command to generate a random one:# openssl rand -hex 16
<disabled>: Set this field tonoin order to enable the cluster.<nodes>: The address of the master must be specified in all nodes (including the master itself). The address can be either an IP or a DNS.The following is an example of the configuration of a worker node:
<cluster>
    <name>wazuh</name>
    <node_name>node02</node_name>
    <key>c98b62a9b6169ac5f67dae55ae4a9088</key>
    <node_type>worker</node_type>
    <port>1516</port>
    <bind_addr>0.0.0.0</bind_addr>
    <nodes>
      <node>master</node>
    </nodes>
    <hidden>no</hidden>
    <disabled>no</disabled>
</cluster>
And the following is an example of the configuration of a master node:
<cluster>
    <name>wazuh</name>
    <node_name>node01</node_name>
    <key>c98b62a9b6169ac5f67dae55ae4a9088</key>
    <node_type>master</node_type>
    <port>1516</port>
    <bind_addr>0.0.0.0</bind_addr>
    <nodes>
      <node>master</node>
    </nodes>
    <hidden>no</hidden>
    <disabled>no</disabled>
</cluster>
Restart the node
# systemctl restart wazuh-manager
Agent registration in the cluster
All agents must be registered in the master node. The master is responsible for replicating the new agent's information across all worker nodes. If an agent is registered in a worker node, it will be deleted by the master node.
Configuring the Wazuh app for Kibana/Splunk
The following must be considered when configuring a Wazuh app:
The apps must be configured to point to the master's API.
All worker nodes need an event forwarder in order to send data to Elasticsearch or Splunk. Install Filebeat if you're using the Elastic stack or Splunk forwarder if you're using Splunk. This is only necessary if the node is in a separated instance from Elasticsearch or Splunk.
Installing Filebeat:
Type
Description
Install Filebeat on Amazon Linux 1 or greater.
Install Filebeat on CentOS 6 or greater.
Install Filebeat on Debian 7 or greater.
Install Filebeat on Fedora 22 or greater.
Install Filebeat on OpenSUSE OpenSUSE 42, OpenSUSE Leap and OpenSUSE Tumbleweed.
Install Filebeat on Oracle Linux 6 or greater.
Install Filebeat on Red Hat Enterprise Linux 6 or greater.
Install Filebeat on SUSE 12.
Install Filebeat on Ubuntu 12.04 or greater.
Installing Splunk forwarder:
Type
Description
Install Splunk forwarder for RPM or DEB based OS.
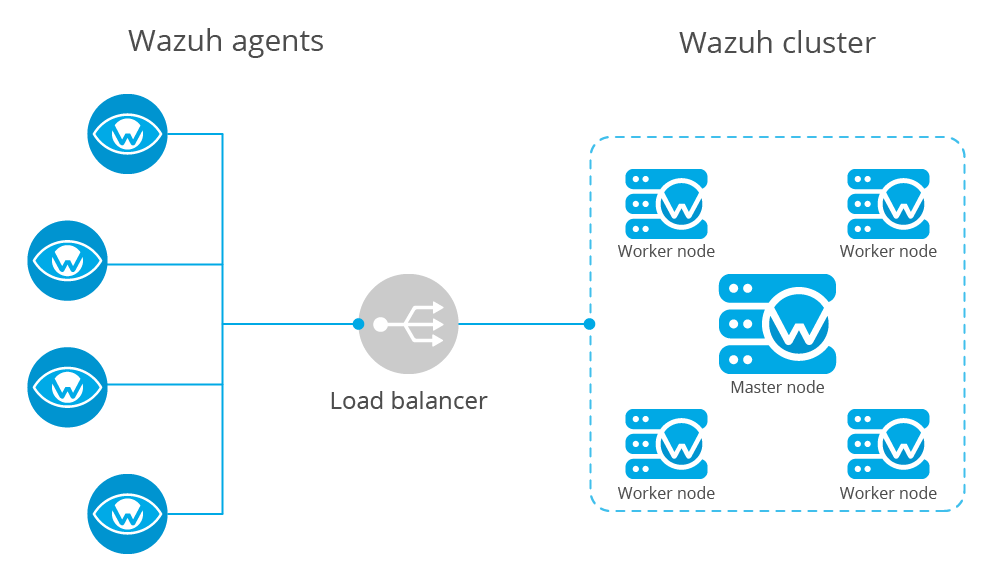
Pointing agents to the cluster with a load balancer
A load balancer is a service that distributes the workloads across multiple resources. In Wazuh's case, users want to use a load balancer to catch all the agent events and distribute them between the different workers in the cluster.
The correct way to use it is to point every agent to send the events to the load balancer:
Edit the Wazuh agent configuration in
/var/ossec/etc/ossec.confto add the Load Balancer IP address. In the<client><server>section, change theLOAD_BALANCER_IPvalue to theload balanceraddress andport:<client> <server> <address>LOAD_BALANCER_IP</address> ... </server> </client>
Restart the agents:
For Systemd:
# systemctl restart wazuh-agent
For SysV Init:
# service wazuh-agent restart
Include in the
Load Balancerthe IP of every instance of the cluster we want to deliver events.This configuration will depend of the load balancer service choosen.
Here is a short configuration guide of a load balancer using Nginx:
Install Nginx in the load balancer instance:
Download the packages from the Official Page.
Follow the steps related on that guide to install the packages.
Configure the instance as a load balancer:
The way nginx and its modules work is determined in the configuration file. By default, the configuration file is named nginx.conf and placed in the directory /usr/local/nginx/conf, /etc/nginx, or /usr/local/etc/nginx.
Now, open the configuration file and add the following structure:
stream {
    upstream cluster {
        hash $remote_addr consistent;
        server <WAZUH-MASTER-IP>:1514;
        server <WAZUH-WORKER1-IP>:1514;
        server <WAZUH-WORKER2-IP>:1514;
    }
    upstream master {
        server <WAZUH-MASTER-IP>:1515;
    }
    server {
        listen 1514;
        proxy_pass cluster;
    }
    server {
        listen 1515;
        proxy_pass master;
    }
}
You can find more details in nginx guide for configuring TCP and UDP load balancer.
Restart nginx configuration files:
# nginx -s reload
Keep in mind the following considerations:
It is recommended to use TCP protocol instead of UDP. Permanent connections and stickiness are needed in order to make sure agent data is consistent. In order to use the TCP protocol, you should configure both your agents and your nodes.
Disable the option use_source_ip in your authd configuration. When using a LB, the cluster nodes will only see the LB's IP and no the agents'. This will make the agents unable to connect to the cluster.
Upgrading from older versions
If you already have a cluster installation from a version older or equal to 3.2.2, you should do some changes in your cluster configuration:
Remove
<interval>section.Remove worker nodes from
<nodes>section. Only the master node is allowed.
The cluster will work with an old configuration but it is recommended to update it.
How the cluster works
The cluster is managed by a daemon, called wazuh-clusterd, which communicates with all the nodes following a master-worker architecture. Refer to the Daemons section for more information about its use.
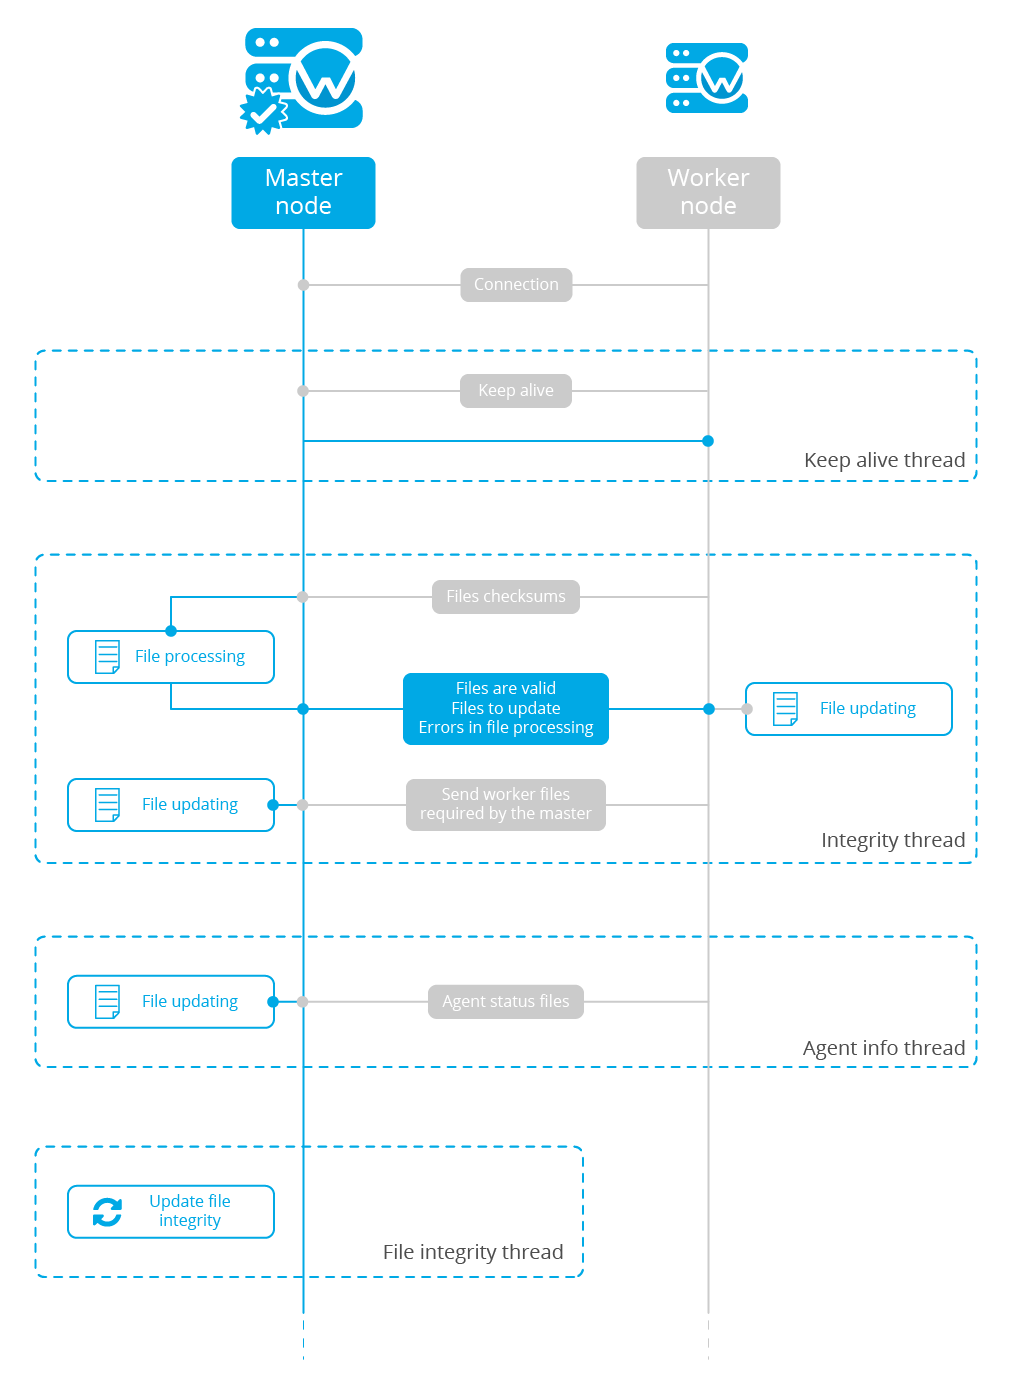
The image below shows the communications between a worker and a master node. Each worker-master communication is independent from each other, since workers are the ones who start the communication with the master.
There are different independent threads running, each one is framed in the image:
Keep alive thread: Responsible of sending a keep alive to the master every so often.
Agent info thread: Responsible of sending the statuses of the agents that are reporting to that node.
Integrity thread: Responsible of synchronizing the files sent by the master.
All cluster logs are written in the file logs/cluster.log.
Keep alive thread
The keep alive thread sends a keep-alive to the master every so often. It is necessary to keep the connection opened between master and worker, since the cluster uses permanent connections.
Agent info thread
The agent info thread sends the statuses of the agents that are reporting to the worker node. The master checks the modification date of each received agent status file and keeps the most recent one.
The master also checks whether the agent exists or not before saving its status update. This is done to prevent the master to store unnecessary information. For example, this situation is very common when an agent is removed but the master hasn't notified worker nodes yet.
Integrity thread
The integrity thread is in charge of synchrozing the files sent by the master node to the workers. Those files are:
Usually, the master is responsible for sending group assignments, but just in case a new agent starts reporting in a worker node, the worker will send the new agent's group assignment to the master.
File Integrity Thread
The integrity of each file is calculated using its MD5 checksum and its modification time. To avoid calculating the integrity with each worker connection, the integrity is calculated in a different thread, called File integrity thread, in the master node every so often.
Cluster management
The cluster_control tool allows you to obtain real-time information about the cluster health, connected nodes and the agents reporting to the cluster. This information can also be obtained using the API requests.
For example, the following snippet shows the connected nodes in the cluster:
# /var/ossec/bin/cluster_control -l
NAME      TYPE    VERSION  ADDRESS
worker-1  worker  3.9.5    172.17.0.101
worker-2  worker  3.9.5    172.17.0.102
master    master  3.9.5    172.17.0.100
This information can also be obtained using the Restful API:
# curl -u foo:bar -X GET "http://localhost:55000/cluster/nodes?pretty"
{
   "error": 0,
   "data": {
      "totalItems": 3,
      "items": [
         {
            "ip": "192.168.56.103",
            "version": "3.9.5",
            "type": "worker",
            "name": "node02"
         },
         {
            "ip": "192.168.56.105",
            "version": "3.9.5",
            "type": "worker",
            "name": "node03"
         },
         {
            "ip": "192.168.56.101",
            "version": "3.9.5",
            "type": "master",
            "name": "node01"
         }
      ]
   }
}
If you want to see more examples and check all its options, refer to the cluster_control manual or the API requests.