Detecting a Shellshock attack
Wazuh is capable of detecting a Shellshock attack by analyzing web server logs collected from a monitored endpoint. In addition, the attack can also be identified at a network level by configuring a Suricata integration.
Check the Shellshock attack section of our documentation for further information. Additionally, the Catch suspicious network traffic section provides information on how to configure a Suricata integration.
Prerequisites
You need an Apache server running on the monitored CentOS 8 system.
Configuration
Add the following lines to the
/var/ossec/etc/ossec.confconfiguration file at the Wazuh CentOS 8 host. This sets the Linux agent to monitor the access logs of your Apache server.<localfile> <log_format>apache</log_format> <location>/var/log/httpd/access_log</location> </localfile>
Optionally, you can install Suricata on the CentOS 8 endpoint and configure it to monitor the endpoint's network traffic.
Steps to generate the alerts
Replace
<your_web_server_address>with the appropriate value and execute the following command from a system external to your CentOS 8 endpoint (the attacker).# curl -H "User-Agent: () { :; }; /bin/cat /etc/passwd" <your_web_server_address>
Query the alerts
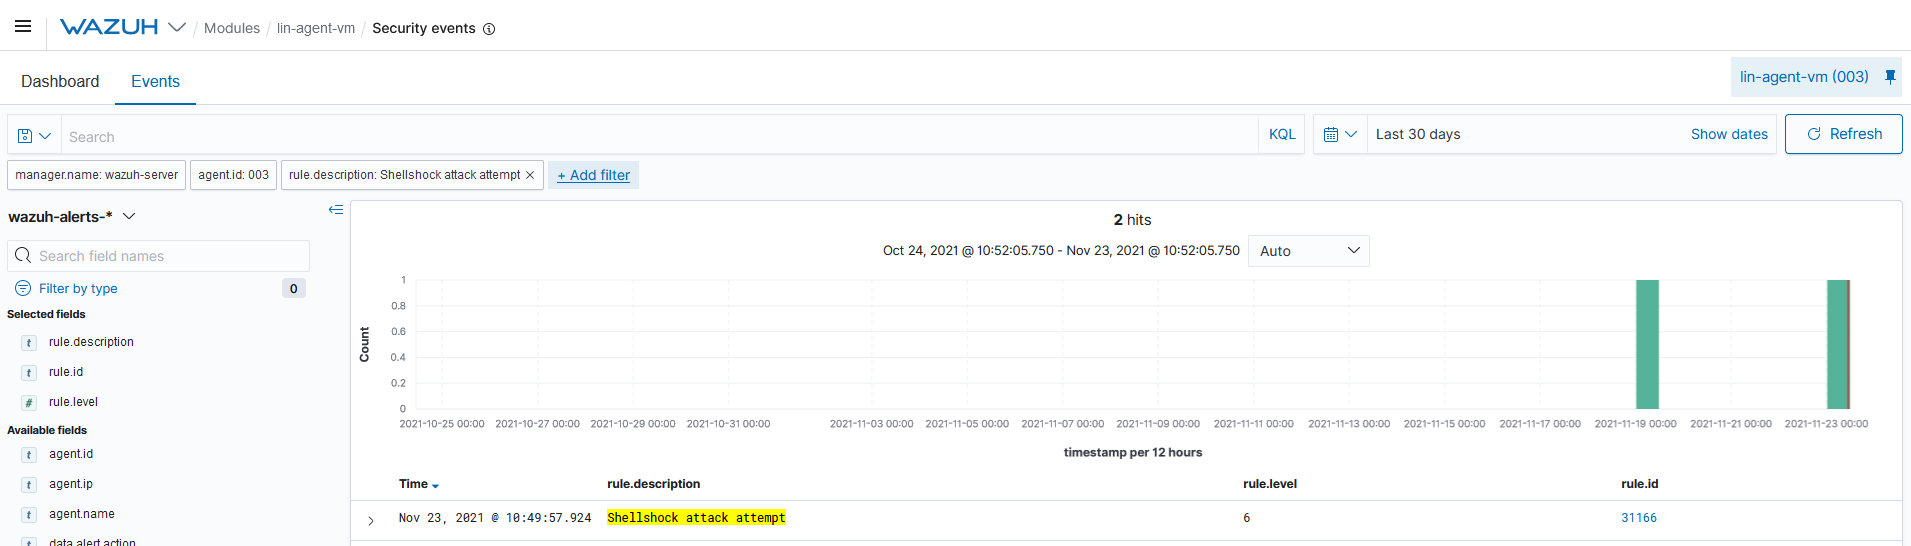
You can visualize the alert data in the Wazuh Kibana plugin. To do this, go to the Security events module and add the filters in the search bar to query the alerts.
rule.description:Shellshock attack attemptIf you have Suricata monitoring the endpoint's traffic, you can also query
rule.description:*CVE-2014-6271*for the related Suricata's alerts.