Detect an SSH brute-force attack
Here you will wage a small SSH brute force attack against your Linux Agent instance.
You will see how Wazuh detects and alerts on each login failure, and how a higher severity alert is produced when enough login failures from the same source IP address are detected in the same time window.
You will also inspect the actual rules that fire as well as the enriched alert records that subsequently can be seen in Kibana.
Attack
Using the SSH client of your choice, attempt to login as user "blimey" to your Linux Agent instance. For example:
ssh blimey@13.56.124.147
The attempts may be rejected before you are even prompted for a password since "blimey" is not an authorized SSH user on that system.
Do this a total of eight times, making sure to get all your attempts made in the same 2-minute time window.
The first alert
Use the file viewer of your choice to look at /var/ossec/logs/alerts/alerts.log on the Wazuh Manager instance. For example:
less /var/ossec/logs/alerts/alerts.log
Search for the text "blimey" and the first alert you find should look like this:
** Alert 1571166477.30198: - syslog,sshd,invalid_login,authentication_failed,pci_dss_10.2.4,pci_dss_10.2.5,pci_dss_10.6.1,gpg13_7.1,gdpr_IV_35.7.d,gdpr_IV_32.2,hipaa_164.312.b,nist_800_53_AU.14,nist_800_53_AC.7,nist_800_53_AU.6,
2019 Oct 15 21:09:56 (agent) any->/var/log/secure
Rule: 5710 (level 5) -> 'sshd: Attempt to login using a non-existent user'
Src IP: 18.18.18.18
Oct 15 21:07:56 linux-agent sshd[29205]: Invalid user blimey from 18.18.18.18 port 48928
The really important alert output file Wazuh writes to is /var/ossec/logs/alerts/alerts.json.
It consists of single-line JSON records containing much more detail than what the alerts.log file shows.
These JSON records are conveyed by Filebeat to Elasticsearch while enriching them so they may be inserted into the appropriate Elasticsearch index.From there they can then be visualized with Kibana.
Here is a beautified example of the JSON record in alerts.json that corresponds to the same alert above in alerts.log.
{
  "timestamp": "2019-10-15T19:07:57.741+0000",
  "rule": {
    "level": 5,
    "description": "sshd: Attempt to login using a non-existent user",
    "id": "5710",
    "mitre":{
      "id":[
          "T1110"
      ],
      "tactic":[
          "Credential Access"
      ],
      "technique":[
          "Brute Force"
      ]
    },
    "firedtimes": 7,
    "mail": false,
    "groups": [
      "syslog",
      "sshd",
      "invalid_login",
      "authentication_failed"
    ],
    "pci_dss": [
      "10.2.4",
      "10.2.5",
      "10.6.1"
    ],
    "gpg13": [
      "7.1"
    ],
    "gdpr": [
      "IV_35.7.d",
      "IV_32.2"
        ],
    "hipaa": [
      "164.312.b"
    ],
    "nist_800_53": [
      "AU.14",
      "AC.7",
      "AU.6"
    ],
    "tsc":[
      "CC6.1",
      "CC6.8",
      "CC7.2",
      "CC7.3"
    ]
  },
  "agent": {
    "id": "001",
    "name": "linux-agent"
  },
  "manager": {
    "name": "wazuh-manager-master-0"
  },
  "id": "1571166477.30198",
  "cluster": {
    "name": "wazuh",
    "node": "wazuh-manager-master-0"
  },
  "full_log": "Oct 15 21:07:56 linux-agent sshd[29205]: Invalid user blimey from 18.18.18.18 port 48928",
  "predecoder": {
    "program_name": "sshd",
    "timestamp": "Oct 15 21:07:56",
    "hostname": "linux-agent"
  },
  "decoder": {
    "parent": "sshd",
    "name": "sshd"
  },
  "data": {
    "srcip": "18.18.18.18",
    "srcport": "48928",
    "srcuser": "blimey"
  },
  "location": "/var/log/auth.log"
}
Moving on to Kibana
It is good to know about the log files, but Kibana is usually the best tool for looking at and analyzing Wazuh alerts.
Log in to Kibana and click on the Discover icon on the left vertical menu.
In the "Search..." field, enter the word "blimey" and hit the search button on the right (the magnifying glass).
For better readability, hover over each of these field names on the left and click on [Add] to the right of them
rule.description
full_log
Now you see a nice summary of recent events mentioning "blimey".
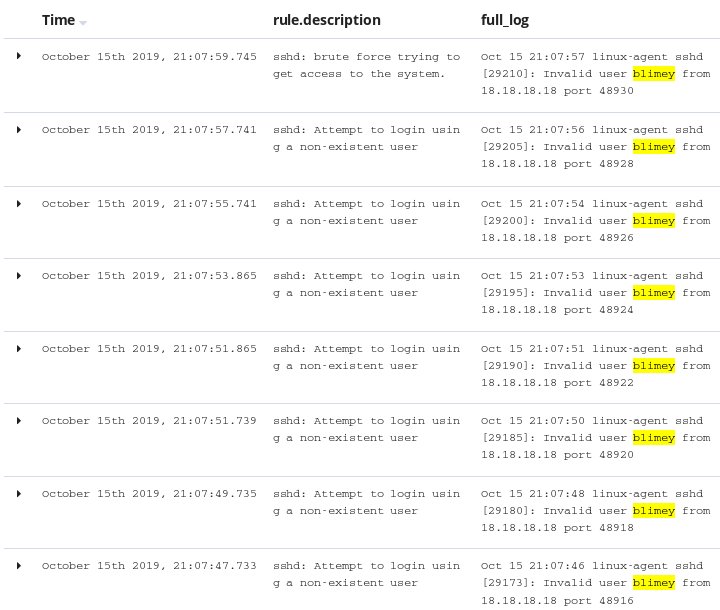
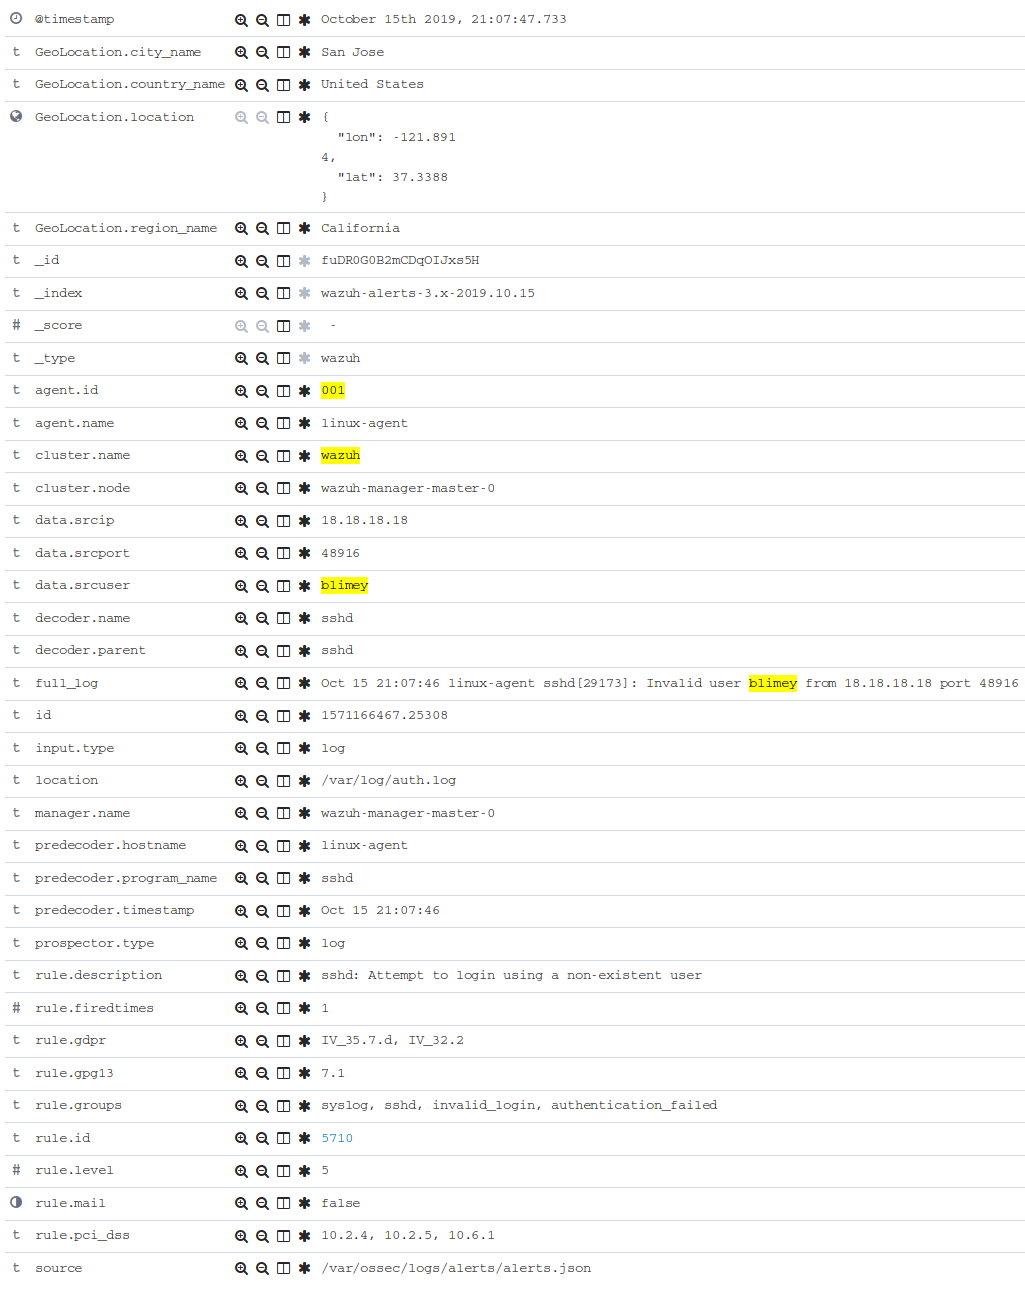
Take a closer look at the full details of the first alert that occurred (bottom record in the list), by clicking on the triangle to the left of the record.
Notice there is even more information here than in the original JSON record, due to enrichment by Filebeat, most notably including GeoLocation fields that are based on the "attacker's" IP address if this was done over an external IP address.
To better understand this alert, let's look up rule 5710 (from the rule.id field above) with the following command:
[root@wazuh-manager-master-0 ~]# ID=5710; rulefiles=/var/ossec/ruleset/rules/*.xml; grep 'id="'$ID'"' $rulefiles -l; sed -e '/id="'$ID'"/,/\/rule>/!d' $rulefiles;
/var/ossec/ruleset/rules/0095-sshd_rules.xml
  <rule id="5710" level="5">
    <if_sid>5700</if_sid>
    <match>illegal user|invalid user</match>
    <description>sshd: Attempt to login using a non-existent user</description>
    <mitre>
      <id>T1110</id>
    </mitre>
    <group>invalid_login,authentication_failed,pci_dss_10.2.4,pci_dss_10.2.5,pci_dss_10.6.1,gpg13_7.1,gdpr_IV_35.7.d,gdpr_IV_32.2,hipaa_164.312.b,nist_800_53_AU.14,nist_800_53_AC.7,nist_800_53_AU.6,tsc_CC6.1,tsc_CC6.8,tsc_CC7.2,tsc_CC7.3,</group>
  </rule>
The rule 5710 looks for matching text "illegal user" or "invalid user" to appear in any log event that has already triggered its parent rule 5700.
Parent rule 5700 simply detects all sshd events and has a number of child rules that are used to fire on specific sshd event patterns, just like rule 5710 does.
Because these rules deal with individual events with no correlation across separate events, they are called atomic rules.
However, after we repeated our SSH logon failure a number of times, another rule fired.
If you scroll back up in Kibana and look for an event with the following description: "sshd: brute force trying to get access to the system" which should be the first or nearly the first entry in your Kibana results. If not, you will need to repeat the attack making sure you do it 8 times in less than 2 minutes.
Expand that record to take a closer look.
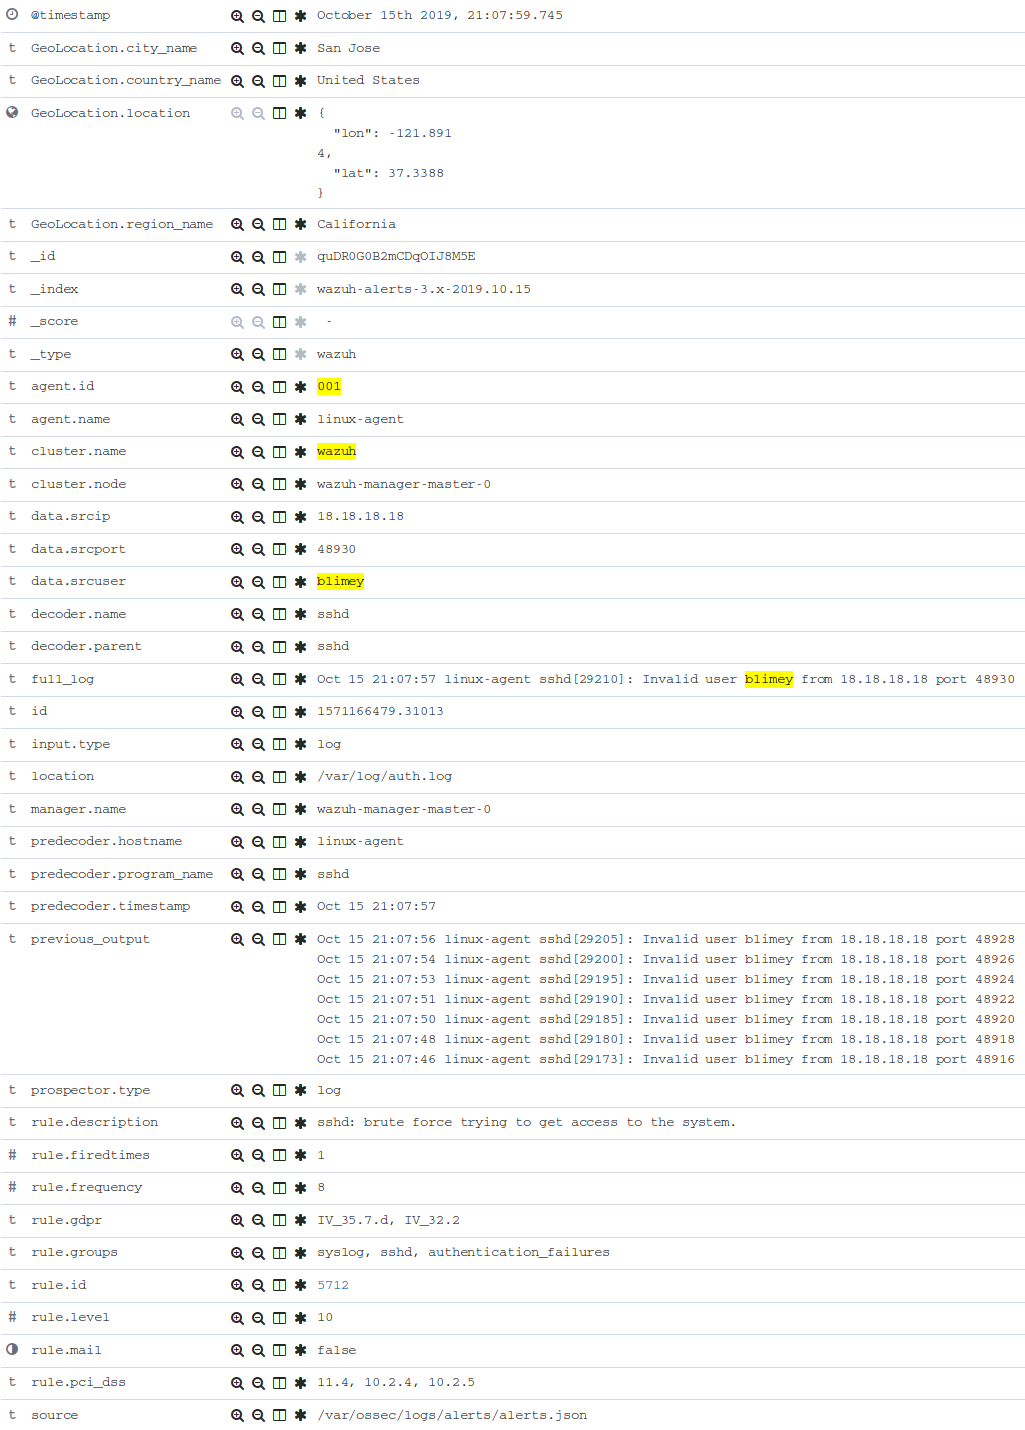
Let's look into this new rule 5712 and see why was it triggered.
[root@wazuh-manager-master-0 ~]# ID=5712; rulefiles=/var/ossec/ruleset/rules/*.xml; grep 'id="'$ID'"' $rulefiles -l; sed -e '/id="'$ID'"/,/\/rule>/!d' $rulefiles;
/var/ossec/ruleset/rules/0095-sshd_rules.xml
  <rule id="5712" level="10" frequency="8" timeframe="120" ignore="60">
    <if_matched_sid>5710</if_matched_sid>
    <description>sshd: brute force trying to get access to </description>
    <description>the system.</description>
    <mitre>
      <id>T1110</id>
    </mitre>
    <same_source_ip />
    <group>authentication_failures,pci_dss_11.4,pci_dss_10.2.4,pci_dss_10.2.5,gdpr_IV_35.7.d,gdpr_IV_32.2,hipaa_164.312.b,nist_800_53_SI.4,nist_800_53_AU.14,nist_800_53_AC.7,tsc_CC6.1,tsc_CC6.8,tsc_CC7.2,tsc_CC7.3,</group>
  </rule>
The rule 5712 is a special kind of child rule to rule 5710.
It is only triggered if its parent rule, 5710, fires on events involving the same source IP address at least eight times in a 120 second period.
The severity level of this rule is higher (10) than the previous one (only 5) because a cluster of SSH login failure attempts from the same source is commonly a sign of a brute force attack.
This kind of rule is correlating multiple events over time and is thus called a composite rule.
Testing the rules with wazuh-logtest
The wazuh-logtest tool is very helpful for finding out from the command line what log entries would
fire what rules and why, without actually generating real alerts in your system.
It is an essential tool for developing, tuning, and debugging rules.
The actual log line generated by sshd when we tried to log in via ssh as "blimey" looks like this:
Oct 15 21:07:56 linux-agent sshd[29205]: Invalid user blimey from 18.18.18.18 port 48928
On wazuh-manager, run the wazuh-logtest command and then paste in the above line and press <Enter>.
[root@wazuh-manager centos]# /var/ossec/bin/wazuh-logtest
You should see an analysis of the event and the resulting rule 5710 match like this:
Type one log per line

Oct 15 21:07:56 linux-agent sshd[29205]: Invalid user blimey from 18.18.18.18 port 48928

**Phase 1: Completed pre-decoding.
        full event: 'Oct 15 21:07:56 linux-agent sshd[29205]: Invalid user blimey from 18.18.18.18 port 48928'
        timestamp: 'Oct 15 21:07:56'
        hostname: 'linux-agent'
        program_name: 'sshd'

**Phase 2: Completed decoding.
        name: 'sshd'
        parent: 'sshd'
        srcip: '18.18.18.18'
        srcport: '48928'
        srcuser: 'blimey'

**Phase 3: Completed filtering (rules).
        id: '5710'
        level: '5'
        description: 'sshd: Attempt to login using a non-existent user'
        groups: '['syslog', 'sshd', 'invalid_login', 'authentication_failed']'
        firedtimes: '1'
        gdpr: '['IV_35.7.d', 'IV_32.2']'
        gpg13: '['7.1']'
        hipaa: '['164.312.b']'
        mail: 'False'
        mitre.id: '['T1110']'
        mitre.tactic: '['Credential Access']'
        mitre.technique: '['Brute Force']'
        nist_800_53: '['AU.14', 'AC.7', 'AU.6']'
        pci_dss: '['10.2.4', '10.2.5', '10.6.1']'
        tsc: '['CC6.1', 'CC6.8', 'CC7.2', 'CC7.3']'
**Alert to be generated.
Note
When wazuh-logtest indicates **Alert to be generated. it means that an alert would be generated if the tested event were
to occur outside of the wazuh-logtest environment. The wazuh-logtest tool will never cause records to be written to alerts.log or
alerts.json, and thus you will never see anything in Kibana caused by an wazuh-logtest test.
Paste that log record in a number of times. On the 8th time, you should see a rule 5712 match instead:
**Phase 1: Completed pre-decoding.
        full event: 'Oct 15 21:07:56 linux-agent sshd[29205]: Invalid user blimey from 18.18.18.18 port 48928'
        timestamp: 'Oct 15 21:07:56'
        hostname: 'linux-agent'
        program_name: 'sshd'

**Phase 2: Completed decoding.
        name: 'sshd'
        parent: 'sshd'
        srcip: '18.18.18.18'
        srcport: '48928'
        srcuser: 'blimey'

**Phase 3: Completed filtering (rules).
        id: '5712'
        level: '10'
        description: 'sshd: brute force trying to get access to the system.'
        groups: '['syslog', 'sshd', 'authentication_failures']'
        firedtimes: '1'
        frequency: '8'
        gdpr: '['IV_35.7.d', 'IV_32.2']'
        hipaa: '['164.312.b']'
        mail: 'False'
        mitre.id: '['T1110']'
        mitre.tactic: '['Credential Access']'
        mitre.technique: '['Brute Force']'
        nist_800_53: '['SI.4', 'AU.14', 'AC.7']'
        pci_dss: '['11.4', '10.2.4', '10.2.5']'
        tsc: '['CC6.1', 'CC6.8', 'CC7.2', 'CC7.3']'
**Alert to be generated.
Press Control+C to exit wazuh-logtest.
Congratulations on the completion of your first Learning Wazuh lab!
Before moving on, you might be interested in taking a more detailed look at the documentation about Wazuh rules here.