Availability - A1.1
The TSC additional criteria for availability A1.1 states that “The entity maintains, monitors, and evaluates current processing capacity and use of system components (infrastructure, data, and software) to manage capacity demand and to enable the implementation of additional capacity to help meet its objectives”. Maintaining the availability of information systems is very important to the business activities of service organizations.
Many service organizations offer outsourced services to their clients and typically have contractual obligations or service-level agreements regarding the services provided. These agreements make it valuable to include TSC requirements regarding availability, as it provides confidence to customers and the organization. It is especially common among data centers and organizations that have service (SaaS) offerings which often include TSC compliance.
The use case below demonstrates how Wazuh assists in meeting this requirement.
Use case: Using Wazuh for system resource monitoring on a Windows endpoint
Wazuh helps to meet the TSC additional criteria for availability A1.1 using a combination of several Wazuh modules. These modules can monitor system resources and performance to create alerts based on custom thresholds to help administrators react to events that impact availability. The modules include command monitoring and system inventory.
Using the Wazuh command monitoring module, we configure the Wazuh agent to run commands to monitor system resources on a Windows Server 2022 endpoint. We also show how to create custom rules to monitor the commands and view the relevant alerts on the Wazuh dashboard.
Add the configuration below to the Wazuh agent configuration file
C:\Program Files (x86)\ossec-agent\ossec.conf. This monitors the RAM and CPU consumption of the monitored Windows endpoint:<wodle name="command"> <disabled>no</disabled> <tag>CPUUsage</tag> <command>Powershell -c "@{ winCounter = (Get-Counter '\Processor(_Total)\% Processor Time').CounterSamples[0] } | ConvertTo-Json -compress"</command> <interval>1m</interval> <ignore_output>no</ignore_output> <run_on_start>yes</run_on_start> <timeout>0</timeout> </wodle> <wodle name="command"> <disabled>no</disabled> <tag>MEMUsage</tag> <command>Powershell -c "@{ winCounter = (Get-Counter '\Memory\Available MBytes').CounterSamples[0] } | ConvertTo-Json -compress"</command> <interval>1m</interval> <ignore_output>no</ignore_output> <run_on_start>yes</run_on_start> <timeout>0</timeout> </wodle>
Launch PowerShell as administrator and restart the Wazuh agent for the changes to take effect:
> Restart-Service -Name wazuh
Create a file
performance_monitor.xmlin the/var/ossec/etc/rules/directory on the Wazuh server. Add the custom rules below to trigger alerts on different performance thresholds:<group name="WinCounter,"> <rule id="301000" level="0"> <decoded_as>json</decoded_as> <match>^{"winCounter":</match> <description>Windows Performance Counter: $(winCounter.Path).</description> </rule> <rule id="302000" level="3"> <if_sid>301000</if_sid> <field name="winCounter.Path">memory\\available mbytes</field> <description>Windows Counter: Available Memory.</description> <group>MEMUsage,tsc_A1.1,</group> </rule> <rule id="302001" level="5"> <if_sid>302000</if_sid> <field name="winCounter.CookedValue" type="pcre2">^[5-9]\d{2}$</field> <description>Windows Counter: Available Memory less than 1GB.</description> <group>MEMUsage,tsc_A1.1,</group> </rule> <rule id="302002" level="7"> <if_sid>302000</if_sid> <field name="winCounter.CookedValue" type="pcre2">^[1-4]\d{2}$</field> <description>Windows Counter: Available Memory less than 500MB.</description> <group>MEMUsage,tsc_A1.1,</group> </rule> <rule id="303000" level="3"> <if_sid>301000</if_sid> <field name="winCounter.Path">processor\S+ processor time</field> <description>Windows Counter: CPU Usage.</description> <group>CPUUsage,tsc_A1.1,</group> </rule> <rule id="303001" level="5"> <if_sid>303000</if_sid> <field name="winCounter.CookedValue">^8\d.\d+$</field> <description>Windows Counter: CPU Usage above 80%.</description> <group>CPUUsage,tsc_A1.1,</group> </rule> <rule id="303002" level="7"> <if_sid>303000</if_sid> <field name="winCounter.CookedValue">^9\d.\d+$</field> <description>Windows Counter CPU Usage above 90%.</description> <group>CPUUsage,tsc_A1.1,</group> </rule> </group>
Where:
Rule ID 301000 matches all "Windows Performance Counter" events and is the parent rule for all the other rules.
Rule ID 302000 reports the current memory utilization, measured in megabytes.
Rule ID 302001 triggers when the available memory is less than 1GB.
Rule ID 302002 triggers when the available memory is less than 500MB
Rule ID 303000 reports the current CPU utilization, measured in percentage.
Rule ID 303001 triggers when the CPU usage is above 80%.
Rule ID 303002 triggers when the CPU usage is above 90%.
Restart the Wazuh manager to apply the changes:
# systemctl restart wazuh-manager
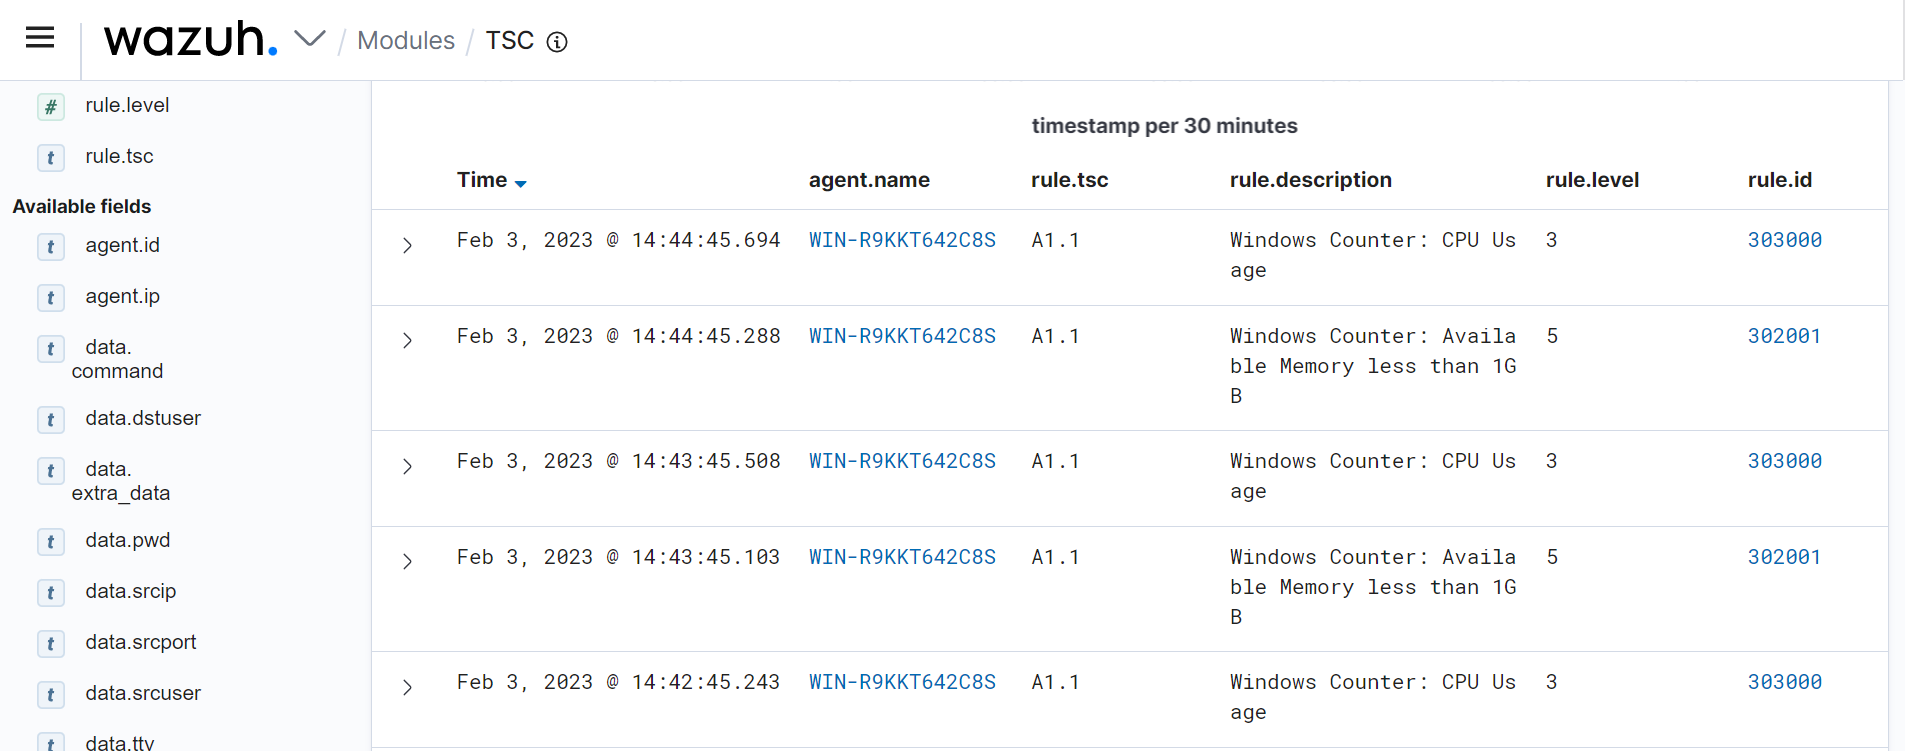
Select TSC from the Wazuh dashboard to see the alerts. These alerts are identified with the tag
A1.1.