Log data analysis
In many cases, evidence of an attack can be found in the log messages of devices, systems, and applications. Wazuh assists users by automating log management and analysis to accelerate threat detection.
The Wazuh agent, running on the monitored endpoint, is in charge of reading operating system and application log messages, forwarding those to the Wazuh server, where the analysis takes place. The server can also receive data via Syslog from network devices or applications when no agent is deployed.
Wazuh uses decoders to identify the source application of the log message. Then, it analyzes the data using application-specific rules. This is an example of a rule used to detect SSH authentication failure events:
<rule id="5716" level="5">
  <if_sid>5700</if_sid>
  <match>^Failed|^error: PAM: Authentication</match>
  <description>SSHD authentication failed.</description>
  <mitre>
    <id>T1110</id>
  </mitre>
  <group>pci_dss_10.2.4,pci_dss_10.2.5,</group>
</rule>
Rules include a match field used to define the pattern that the rule looks for. They also have a level field that specifies the priority of the resulting alerts. Besides, rules enrich events with technique identifiers from the MITRE ATT&CK framework and mappings to regulatory compliance controls.
The manager generates an alert every time an event, collected by one of the agents or received via Syslog, matches a rule with a priority level higher than a predefined threshold (3 by default).
See below an example alert found in /var/ossec/logs/alerts/alerts.json. Some fields have been removed for reasons of brevity:
{
  "agent": {
      "id": "005",
      "ip": "10.0.1.175",
      "name": "Centos"
  },
  "predecoder": {
      "hostname": "ip-10-0-1-175",
      "program_name": "sshd",
      "timestamp": "Jul 12 15:32:41"
  },
  "decoder": {
      "name": "sshd",
      "parent": "sshd"
  },
  "full_log": "Jul 12 15:32:41 ip-10-0-1-175 sshd[21746]: Failed password for root from 61.177.172.13 port 61658 ssh2",
  "location": "/var/log/secure",
  "data": {
      "dstuser": "root",
      "srcip": "61.177.172.13",
      "srcport": "61658"
  },
  "rule": {
      "description": "sshd: authentication failed.",
      "id": "5716",
      "level": 5,
      "mitre": {
          "id": [
              "T1110"
          ],
          "tactic": [
              "Credential Access"
          ],
          "technique": [
              "Brute Force"
          ]
      },
  },
  "timestamp": "2020-07-12T15:32:41.756+0000"
}
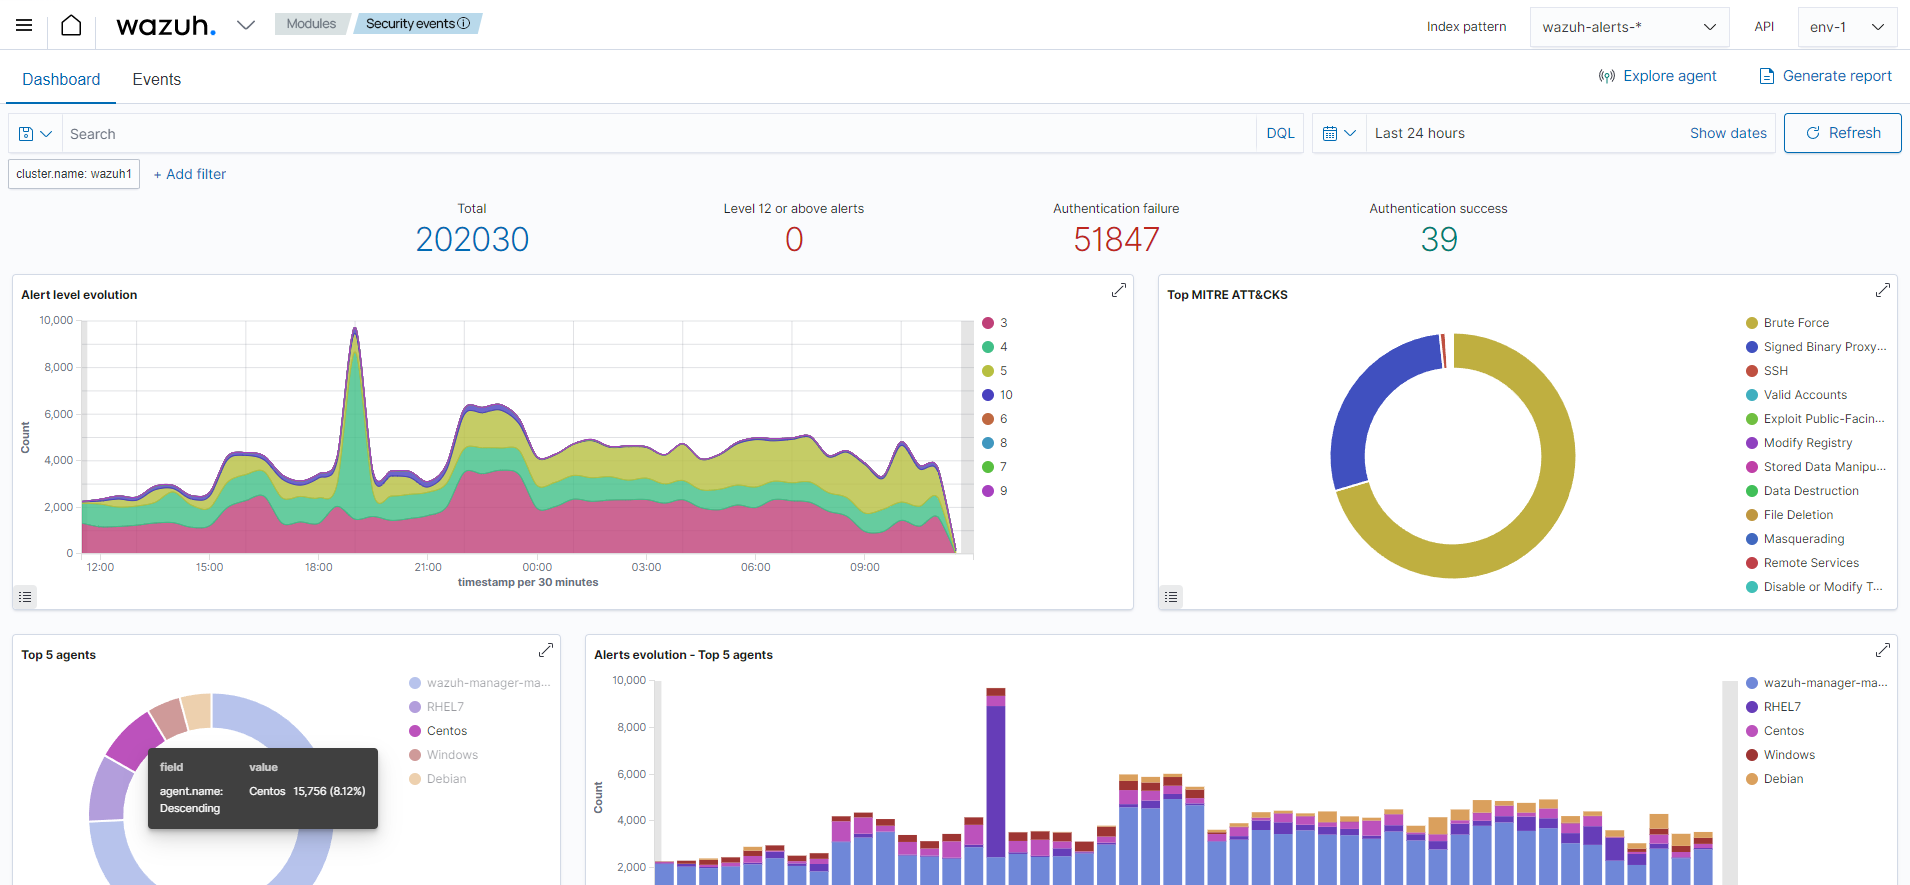
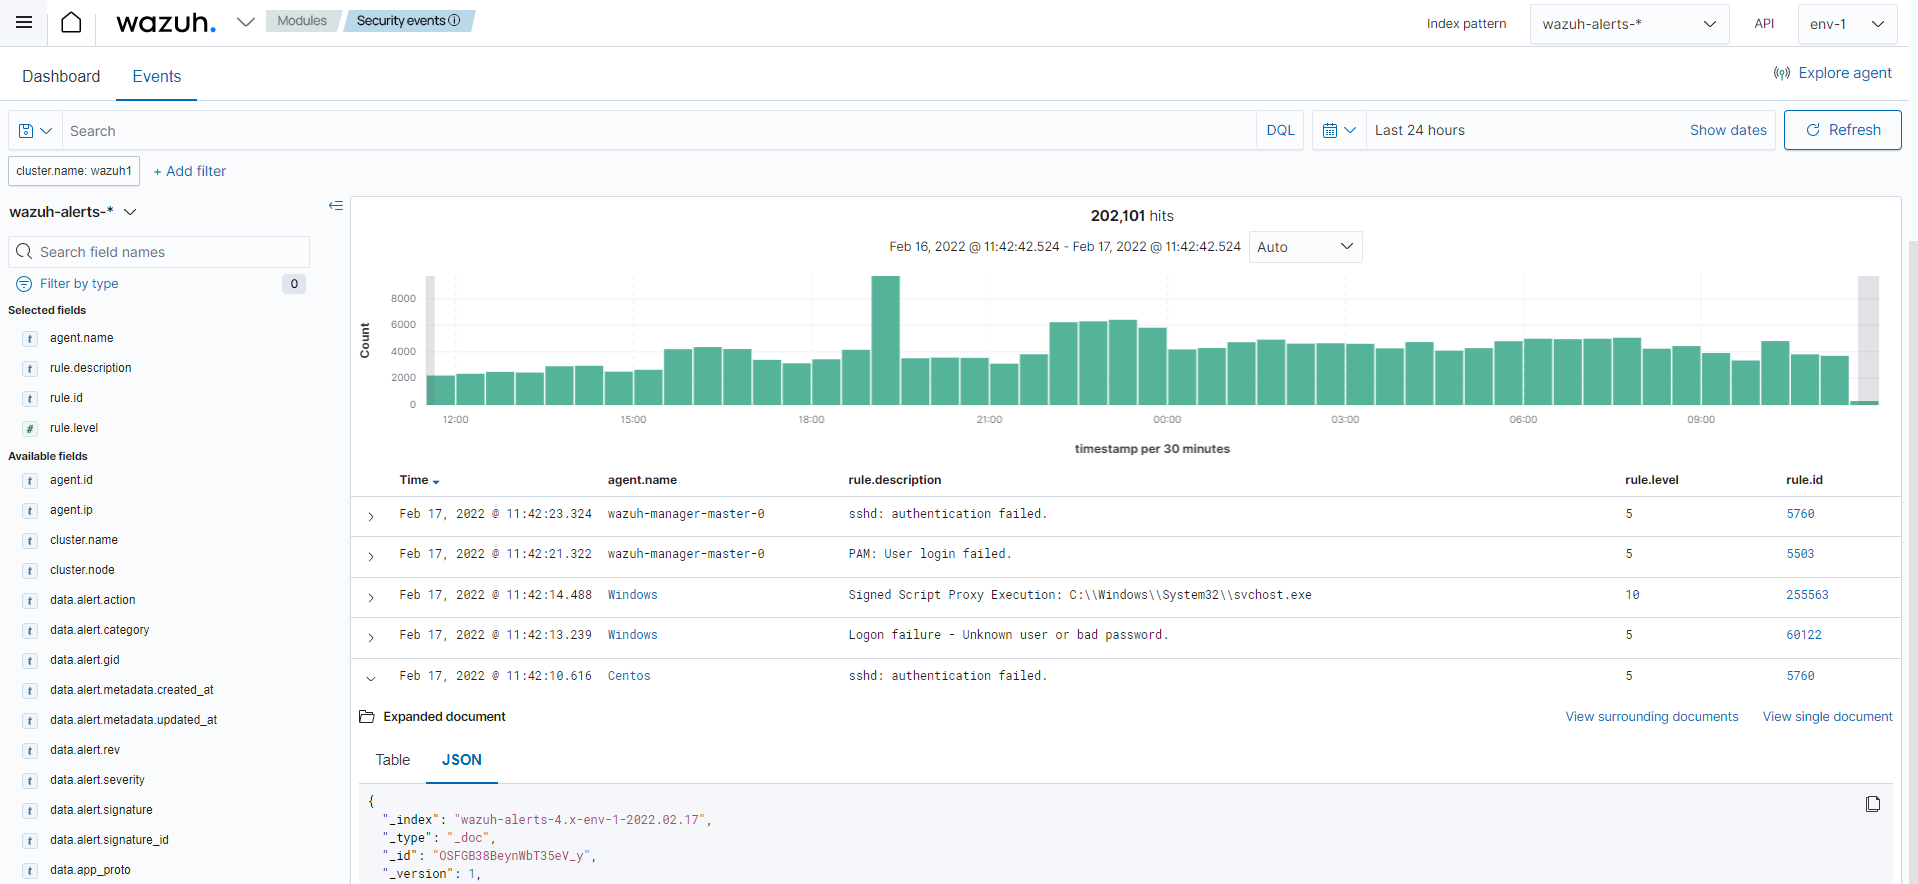
Once generated by the Wazuh server, the alerts are sent to the Wazuh indexer component where they are enriched with geolocation information, stored and indexed. The Wazuh dashboard can then be used to search, analyze, and visualize the data. Below is an example screenshot of the interface:
Wazuh provides a default ruleset, updated periodically, with over 3,000 rules for different systems and applications. In addition, Wazuh allows the creation of custom rules. Find more information in the user manual.