Viewing system inventory data
Wazuh dashboard
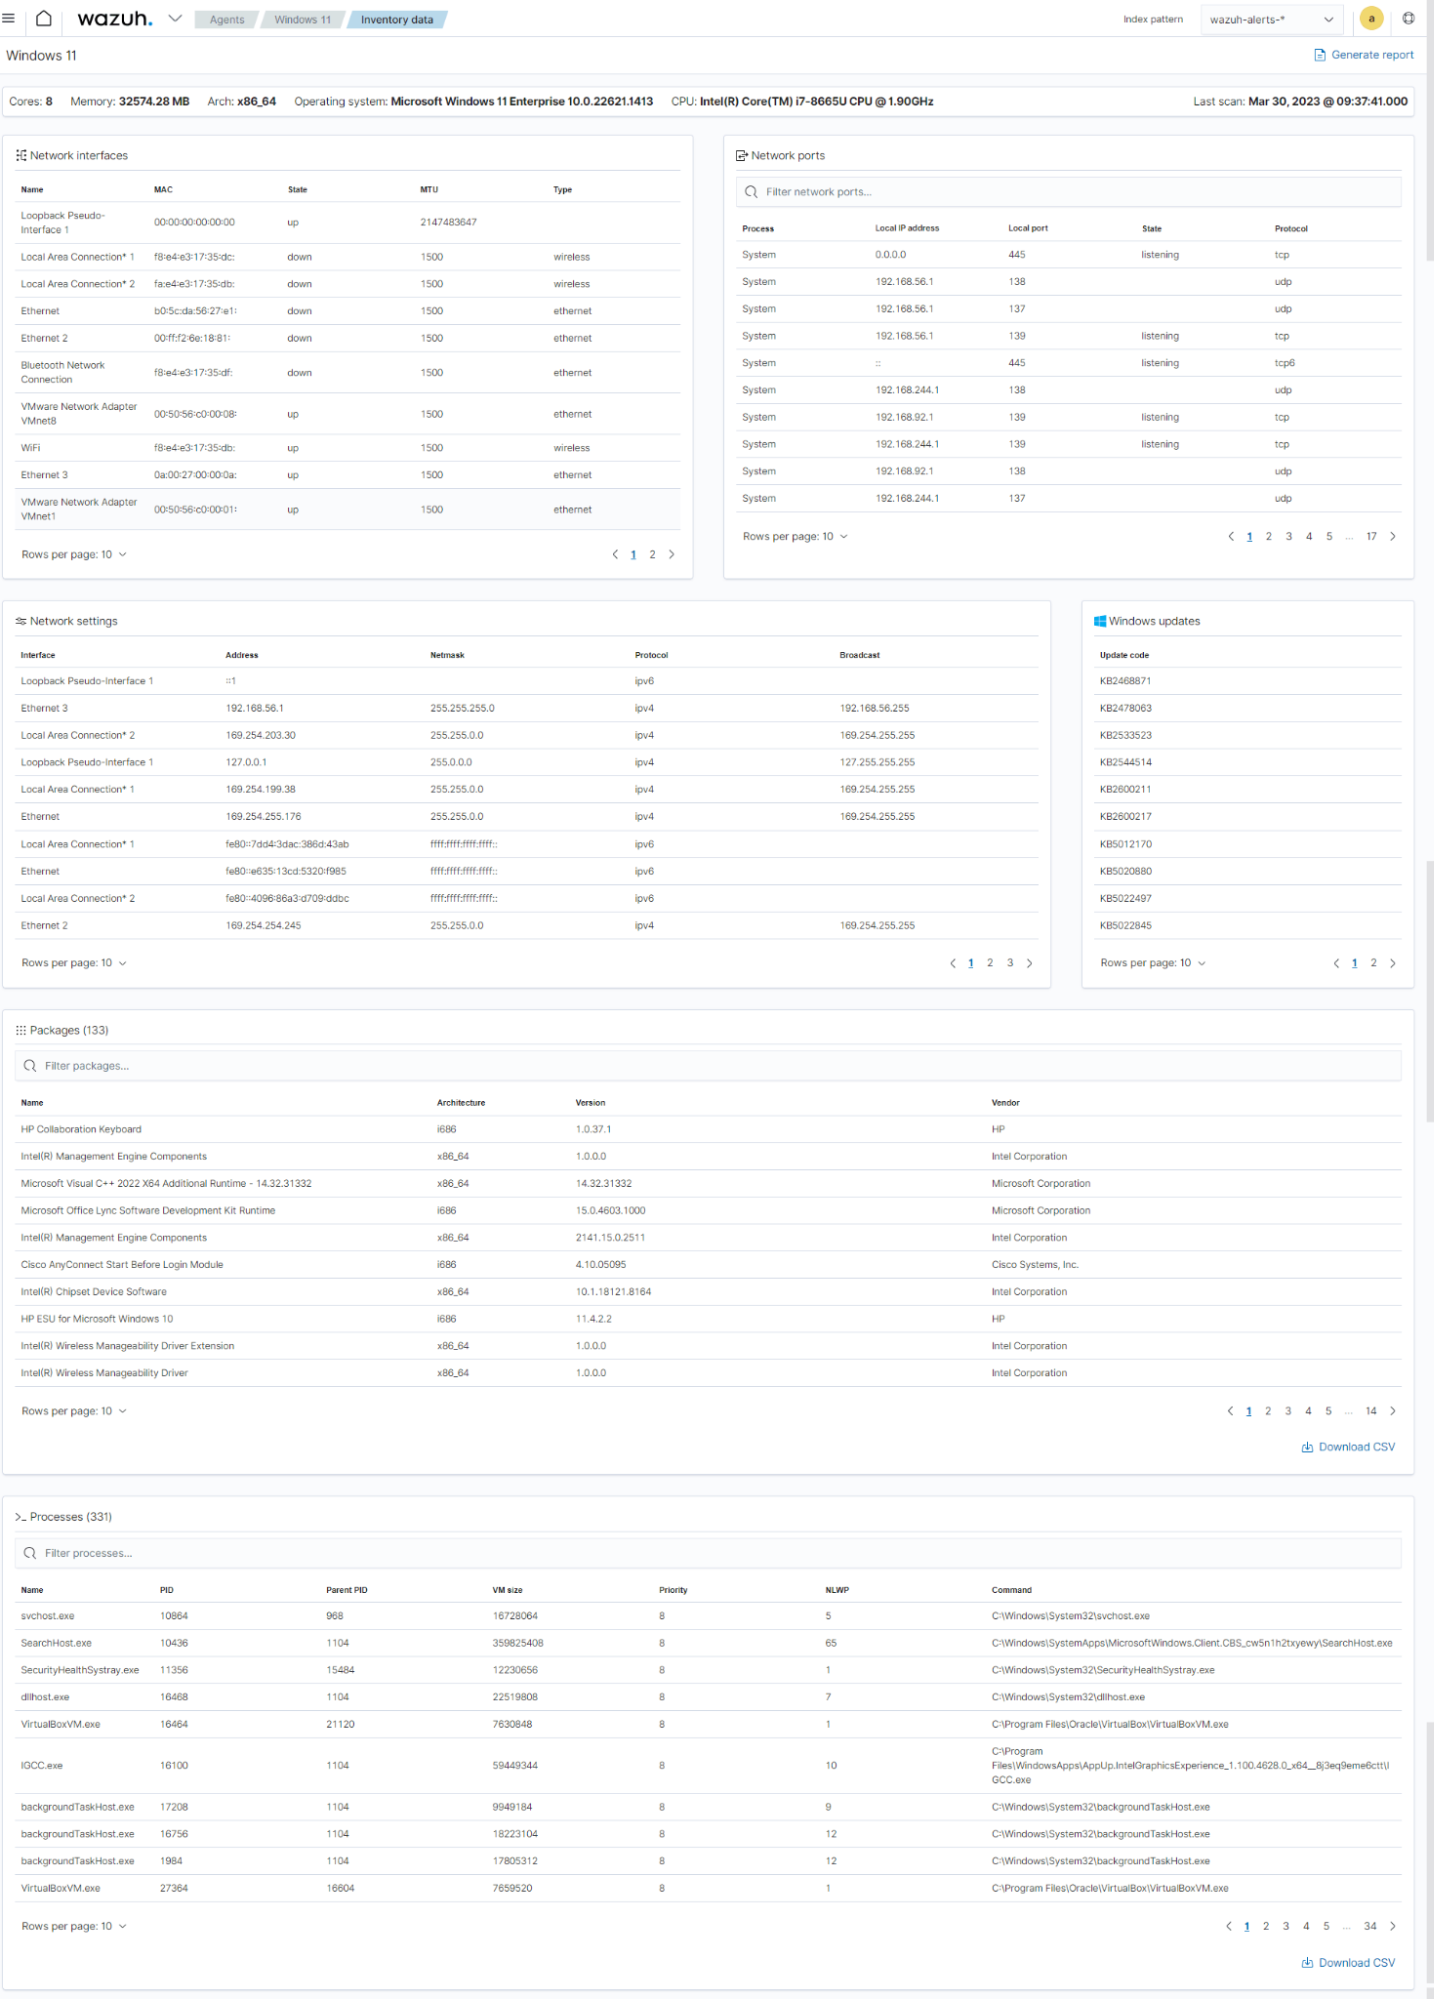
You can view the system inventory of each monitored endpoint from the Wazuh dashboard. To do this, select an agent from your Wazuh dashboard and navigate to the Inventory data tab as displayed below. The inventory data page for each monitored endpoint shows its operating system, hardware, processes, network interface, and packages.


Query the agent inventory database
The Syscollector module runs periodic scans and sends the updated data in JSON format to the Wazuh server. The Wazuh server analyzes and stores this data in a separate database for each endpoint. The databases contain tables that store each type of system information. You can query the database for specific information using the Wazuh API or the SQLite tool.
Using the Wazuh API
You can query the Wazuh inventory data using the Wazuh API, which retrieves nested data in JSON format. You can use the Wazuh API GUI on the dashboard or a command line tool like cURL to query the inventory database.
Wazuh API GUI
On the Wazuh dashboard, navigate to Wazuh > Tools > API Console. On the Console, type the following:
GET /syscollector/<AGENT_ID>/
Where <AGENT_ID> corresponds to the agent ID of the endpoint.
The Wazuh dashboard will suggest a list of available tables that you can query via the API.

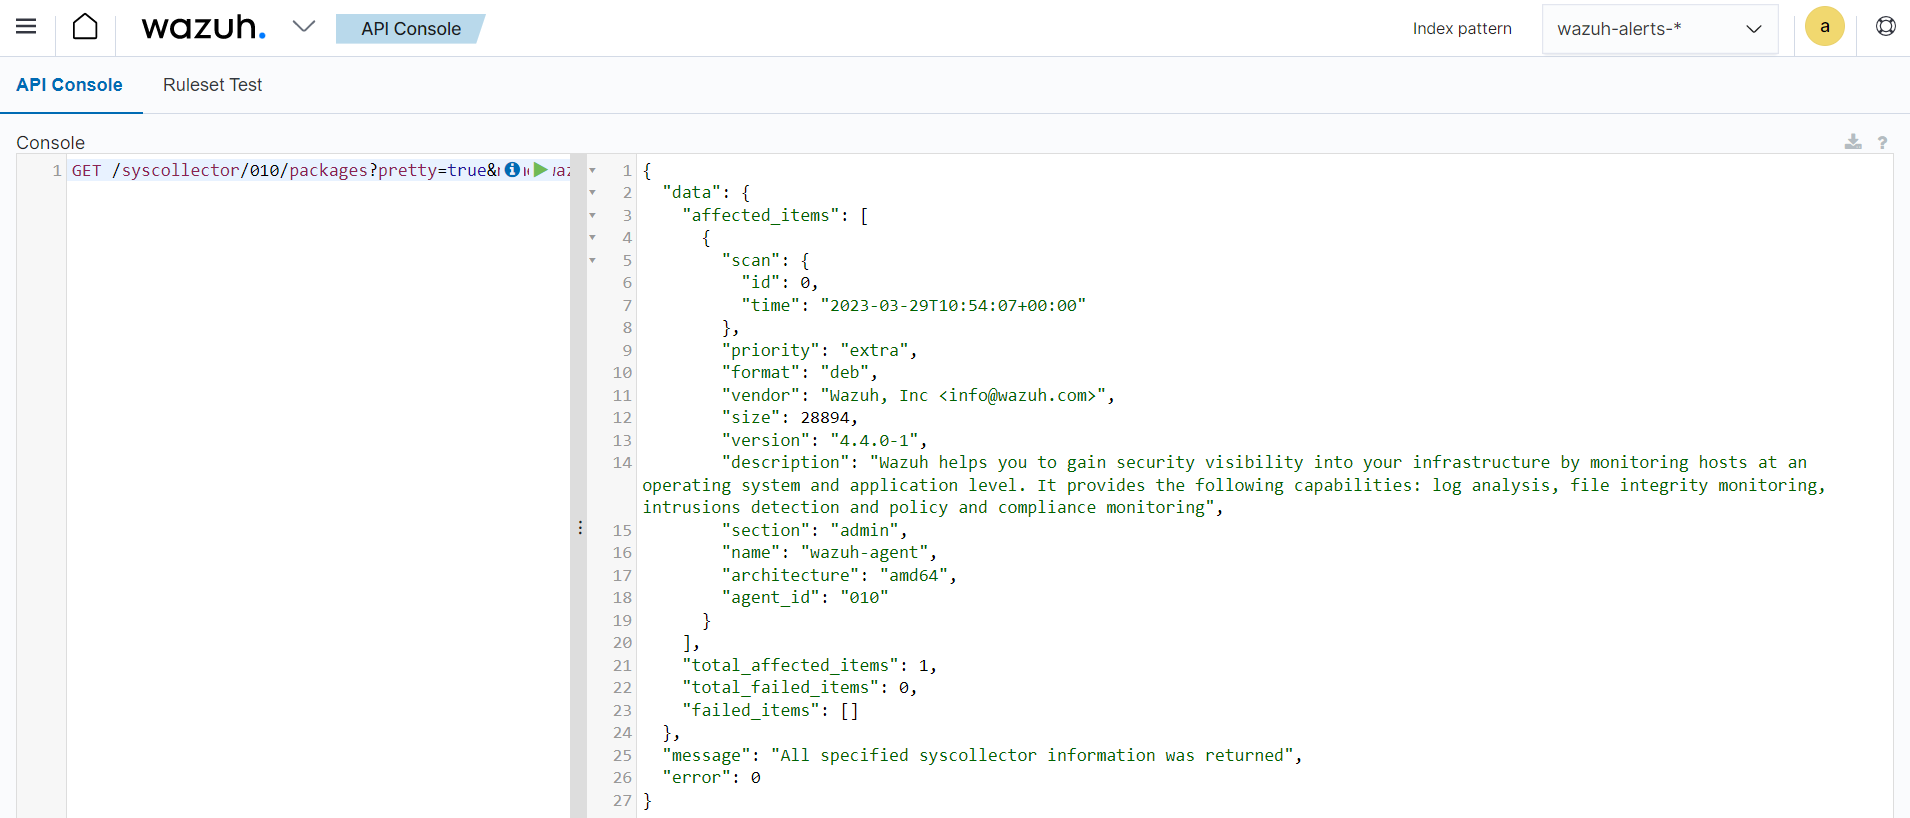
For example, you can use the command GET /syscollector/<AGENT_ID>/packages to query the inventory data for installed packages on the endpoint. After typing, click the play icon to run the query.
Furthermore, you can query the inventory data for specific information about any property. For example, the command below queries the package inventory to check for the wazuh-agent package:
GET /syscollector/<AGENT_ID>/packages?pretty=true&name=wazuh-agent
Where:
packagesreference the package table in the inventory database, which stores information about the currently installed software on an endpoint. You can reference the table of your interest.name=wazuh-agentspecifies thewazuh-agentpackage name. You can use different properties and values.pretty=trueensures the output is properly formatted and easy to read.

cURL
Follow the steps below to query the endpoint database from the command line using cURL:
Generate a JSON Web Token (JWT) for authenticating to the Wazuh server by running the following command. The default API credentials are
wazuh:wazuh. Replace<WAZUH_SERVER_IP>with your Wazuh server IP address.TOKEN=$(curl -u <USER>:<PASSWORD> -k -X GET "https://<WAZUH_SERVER_IP>:55000/security/user/authenticate?raw=true")Run the command
echo $TOKENto confirm that you successfully generated the token. The output should be like this:eyJhbGciOiJFUzUxMiIsInR5cCI6IkpXVCJ9.eyJpc3MiOiJ3YXp1aCIsImF1ZCI6IldhenVoIEFQSSBSRVNUIiwibmJmIjoxNjQzMDExMjQ0LCJleHAiOjE2NDMwMTIxNDQsInN1YiI6IndhenVoIiwicnVuX2FzIjpmYWxzZSwicmJhY19yb2xlcyI6WzFdLCJyYmFjX21vZGUiOiJ3aGl0ZSJ9.Ad6zOZvx0BEV7K0J6s3pIXAXTWB-zdVfxaX2fotLfZMQkiYPMkwDaQHUFiOInsWJ_7KZV3y2BbhEs9-kBqlJAMvMAD0NDBPhEQ2qBd_iutZ7QWZECd6eYfIP83xGqH9iqS7uMI6fXOKr3w4aFV13Q6qsHSUQ1A-1LgDnnDGGaqF5ITYoQuery the endpoint information of interest using a command which takes the following format:
curl -k -X GET "https://<WAZUH_SERVER_IP>:55000/syscollector/<AGENT_ID>/<SYSCOLLECTOR_PROPERTY>?pretty=true" -H "Authorization: Bearer $TOKEN"For example, to retrieve information about the applications installed on an endpoint with agent ID of
010, the command will be:curl -k -X GET "https://<WAZUH_SERVER_IP>:55000/syscollector/010/packages?pretty=true" -H "Authorization: Bearer $TOKEN"The other inventory properties are
hardware,hotfixes,netaddr,netiface,netproto,os,ports, andprocesses. These all correspond to the tables in the inventory database. You can learn more about these options in our API documentation.{ "data": { "affected_items": [ { "scan": { "id": 0, "time": "2022-09-27T09:16:45+00:00" }, "priority": "optional", "multiarch": "foreign", "format": "deb", "vendor": "Ubuntu Developers <ubuntu-devel-discuss@lists.ubuntu.com>", "size": 12219, "version": "0.4.9-2", "description": "encoding data for the poppler PDF rendering library", "section": "misc", "name": "poppler-data", "architecture": "all", "agent_id": "010" }, { "scan": { "id": 0, "time": "2022-09-27T09:16:45+00:00" }, "priority": "optional", "multiarch": "foreign", "format": "deb", "vendor": "Ubuntu Developers <ubuntu-devel-discuss@lists.ubuntu.com>", "size": 31, "version": "3.20-4", "description": "data tables pertaining to HTML", "section": "perl", "name": "libhtml-tagset-perl", "architecture": "all", "agent_id": "010" }, { "scan": { "id": 0, "time": "2022-09-27T09:16:45+00:00" }, "priority": "optional", "multiarch": "same", "format": "deb", "vendor": "Ubuntu Developers <ubuntu-devel-discuss@lists.ubuntu.com>", "size": 426, "version": "1.17-6ubuntu4.1", "description": "MIT Kerberos runtime libraries - krb5 GSS-API Mechanism", "section": "libs", "source": "krb5", "name": "libgssapi-krb5-2", "architecture": "amd64", "agent_id": "010" }, …
Furthermore, you can query the inventory data to find specific information about any property. For example, the command below queries the package inventory to check if the
wazuh-agentpackage is present.curl -k -X GET "https://<WAZUH_SERVER_IP>:55000/syscollector/001/packages?pretty=true&name=wazuh-agent" -H "Authorization: Bearer $TOKEN"{ "data": { "affected_items": [ { "scan": { "id": 0, "time": "2023-08-09T06:49:25+00:00" }, "architecture": "x86_64", "description": "Wazuh helps you to gain security visibility into your infrastructure by monitoring hosts at an operating system and application level. It provides the following capabilities: log analysis, file integrity monitoring, intrusions detection and policy and compliance monitoring", "format": "rpm", "size": 25951010, "install_time": "1691563709", "name": "wazuh-agent", "section": "System Environment/Daemons", "vendor": "Wazuh, Inc <info@wazuh.com>", "version": "4.5.0-1", "agent_id": "001" } ], "total_affected_items": 1, "total_failed_items": 0, "failed_items": [] }, "message": "All specified syscollector information was returned", "error": 0 }
Using SQLite
The location of the database for each monitored endpoint is on the Wazuh server at /var/ossec/queue/db/. You can query each database directly. To connect to the database of an endpoint, use the command below:
$ sqlite3 /var/ossec/queue/db/<AGENT_ID>.db
Where <AGENT_ID> corresponds to the agent ID of the monitored endpoint.
SQLite version 3.7.17 2013-05-20 00:56:22
Enter ".help" for instructions
Enter SQL statements terminated with a ";"
sqlite>
After connecting to the database, you can query the list of tables in it using the command below:
sqlite>.tables
ciscat_results        sca_scan_info         sys_osinfo
fim_entry             scan_info             sys_ports
metadata              sync_info             sys_processes
pm_event              sys_hotfixes          sys_programs
sca_check             sys_hwinfo            vuln_cves
sca_check_compliance  sys_netaddr           vuln_metadata
sca_check_rules       sys_netiface
sca_policy            sys_netproto
You can further query the tables for any information you are interested in. For example, if you want to know if a particular software is present on an endpoint, you can query the sys_programs table using sqlite>select * from sys_programs where name="<SOFTWARE_NAME>";. The command below checks whether the wazuh-agent program is present on a monitored Linux endpoint and shows the captured details:
sqlite>select * from sys_programs where name="wazuh-agent";
0|2023/01/06 13:48:56|rpm|wazuh-agent||System Environment/Daemons|25988677|Wazuh, Inc <info@wazuh.com>|1673012221|4.3.10-1|x86_64|||Wazuh helps you to gain security visibility into your infrastructure by monitoring hosts at an operating system and application level. It provides the following capabilities: log analysis, file integrity monitoring, intrusions detection and policy and compliance monitoring||1|||1cf5a056a0ff5b6201939eba76ef68f6d860af36|5747279dac052d61c6d3ec87b475edddb84e9dd1