Wazuh indexer indices
An index is a collection of documents that relate to each other. The Wazuh indexer uses indices to store and organize security data for fast retrieval. Wazuh uses the following index patterns to store this data:
wazuh‑alerts-*: This is the index pattern for alerts generated by the Wazuh server.
wazuh‑archives-*: This is the index pattern for all events sent to the Wazuh server.
wazuh‑monitoring-*: This is the index pattern for the status of the Wazuh agents.
wazuh‑statistics-*: This is the index pattern for statistical information of the Wazuh server.
You can create a custom index pattern or modify the default index pattern.
Creating custom index pattern
This section describes creating a custom index pattern, my-custom-alerts-*, alongside the default pattern, wazuh-alerts-*. Switch to the root user and perform the steps below.
Stop the Filebeat service:
# systemctl stop filebeat
Download the Wazuh template and save it into a file (for example,
template.json):# curl -so template.json https://raw.githubusercontent.com/wazuh/wazuh/4.7/extensions/elasticsearch/7.x/wazuh-template.json
Open the template file and locate this line at the beginning of the file:
"index_patterns": [
  "wazuh-alerts-4.x-*",
  "wazuh-archives-4.x-*"
],
Add your custom pattern to look like this:
"index_patterns": [
  "wazuh-alerts-4.x-*",
  "wazuh-archives-4.x-*",
  "my-custom-alerts-*"
],
The asterisk character (
*) on the index patterns is important because Filebeat will create indices using a name that follows this pattern, which is necessary to apply the proper format to visualize the alerts on the Wazuh dashboard.Save the modifications and insert the new template into the Wazuh indexer. This will replace the existing template:
# curl -XPUT -k -u <INDEXER_USERNAME>:<INDEXER_PASSWORD> 'https://<INDEXER_IP_ADDRESS>:9200/_template/wazuh' -H 'Content-Type: application/json' -d @template.json
Replace
<INDEXER_USERNAME>and<INDEXER_PASSWORD>with the Wazuh indexer username and password. You can obtain the Wazuh indexer credentials for fresh deployments using the command:Note
If using the Wazuh OVA, use the default credentials
admin:adminor refer to the password management section.# tar -axf wazuh-install-files.tar wazuh-install-files/wazuh-passwords.txt -O | grep -P "\'admin\'" -A 1
{"acknowledged":true}Note
{"acknowledged":true}indicates that the template was inserted correctly.Warning
Perform step 5 only if you want to replace the default alert index pattern
wazuh-alerts-*and/or the default archive index patternwazuh‑archives-*withmy-custom-alerts-*.Open the Wazuh alerts configuration file
/usr/share/filebeat/module/wazuh/alerts/manifest.ymland optionally the archives file/usr/share/filebeat/module/wazuh/archives/manifest.ymland replace the index name.For example, from:
- name: index_prefix
  default: wazuh-alerts-
To this:
- name: index_prefix
  default: my-custom-alerts-
Note
The index name must not contain the characters
#,\,/,*,?,",<,>,|,,, and must not start with_,-, or+. Also, all the letters must be lowercase.(Optional) If you want to use the new index pattern by default, open the
/usr/share/wazuh-dashboard/data/wazuh/config/wazuh.ymlfile and add the below configuration:pattern: my-custom-alerts-*
This will make the Wazuh server automatically create and/or select the new index pattern.
Restart Filebeat and the Wazuh server components:
# systemctl restart filebeat
# systemctl restart wazuh-manager
# systemctl restart wazuh-indexer
# systemctl restart wazuh-dashboard
Warning
If you already have indices created with the previous name, they won't be changed. You can still change to the previous index pattern to see them, or you can perform reindexing to rename the existing indices.
Checking indices information
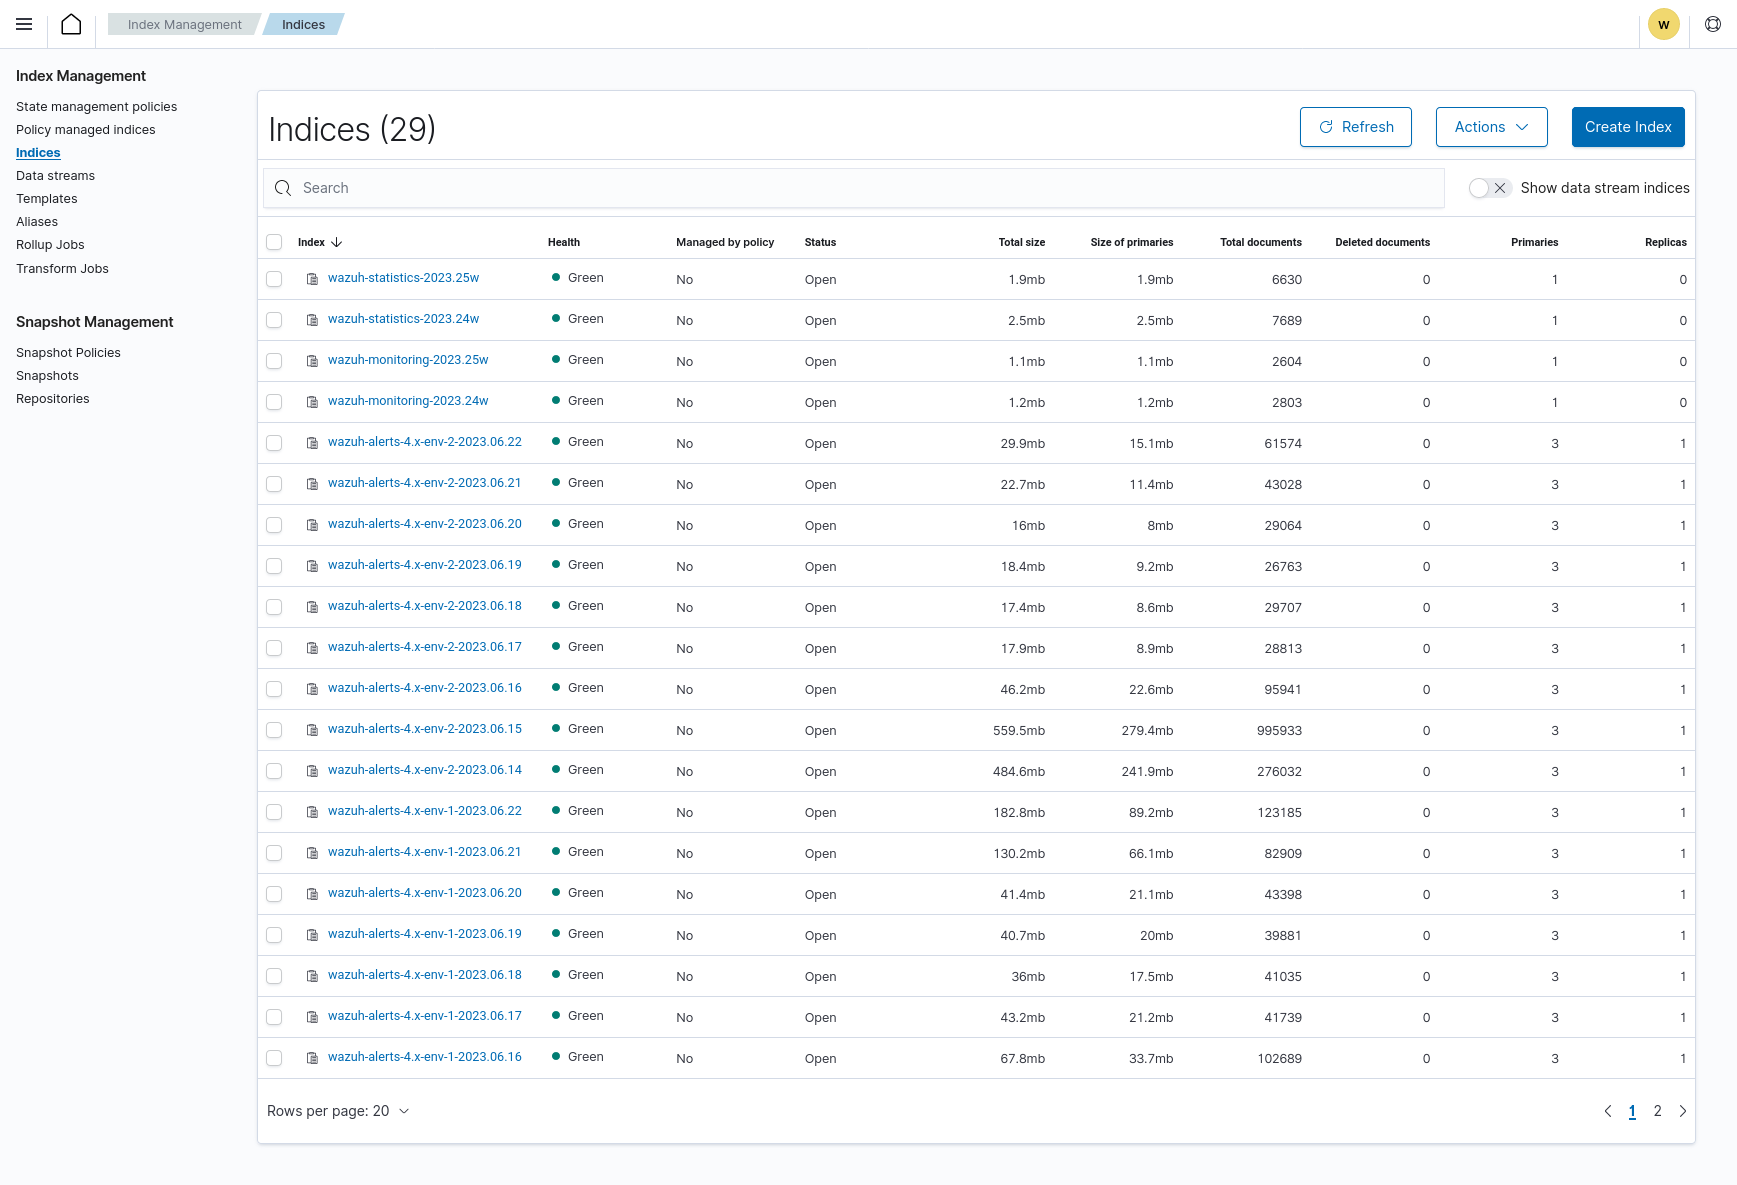
You can check for information about Wazuh indices in two ways.
Using the web user interface.
Making a request to the Wazuh indexer API.
Using the web user interface
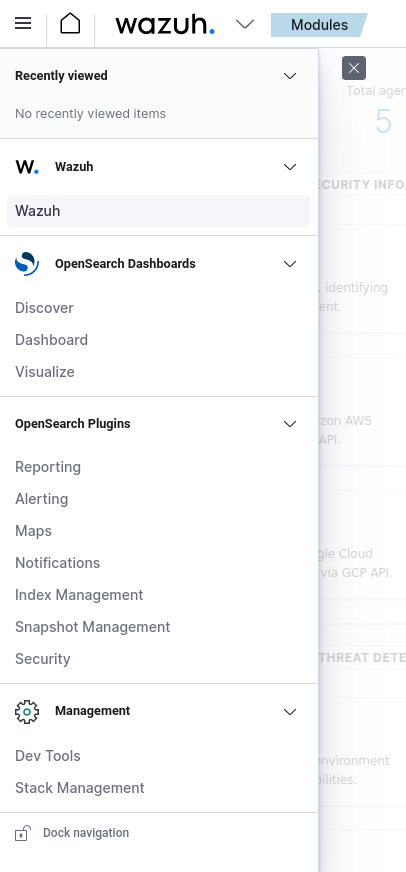
In the Wazuh dashboard upper left menu ☰, go to OpenSearch Plugins > Index Management.
Click on Indices.
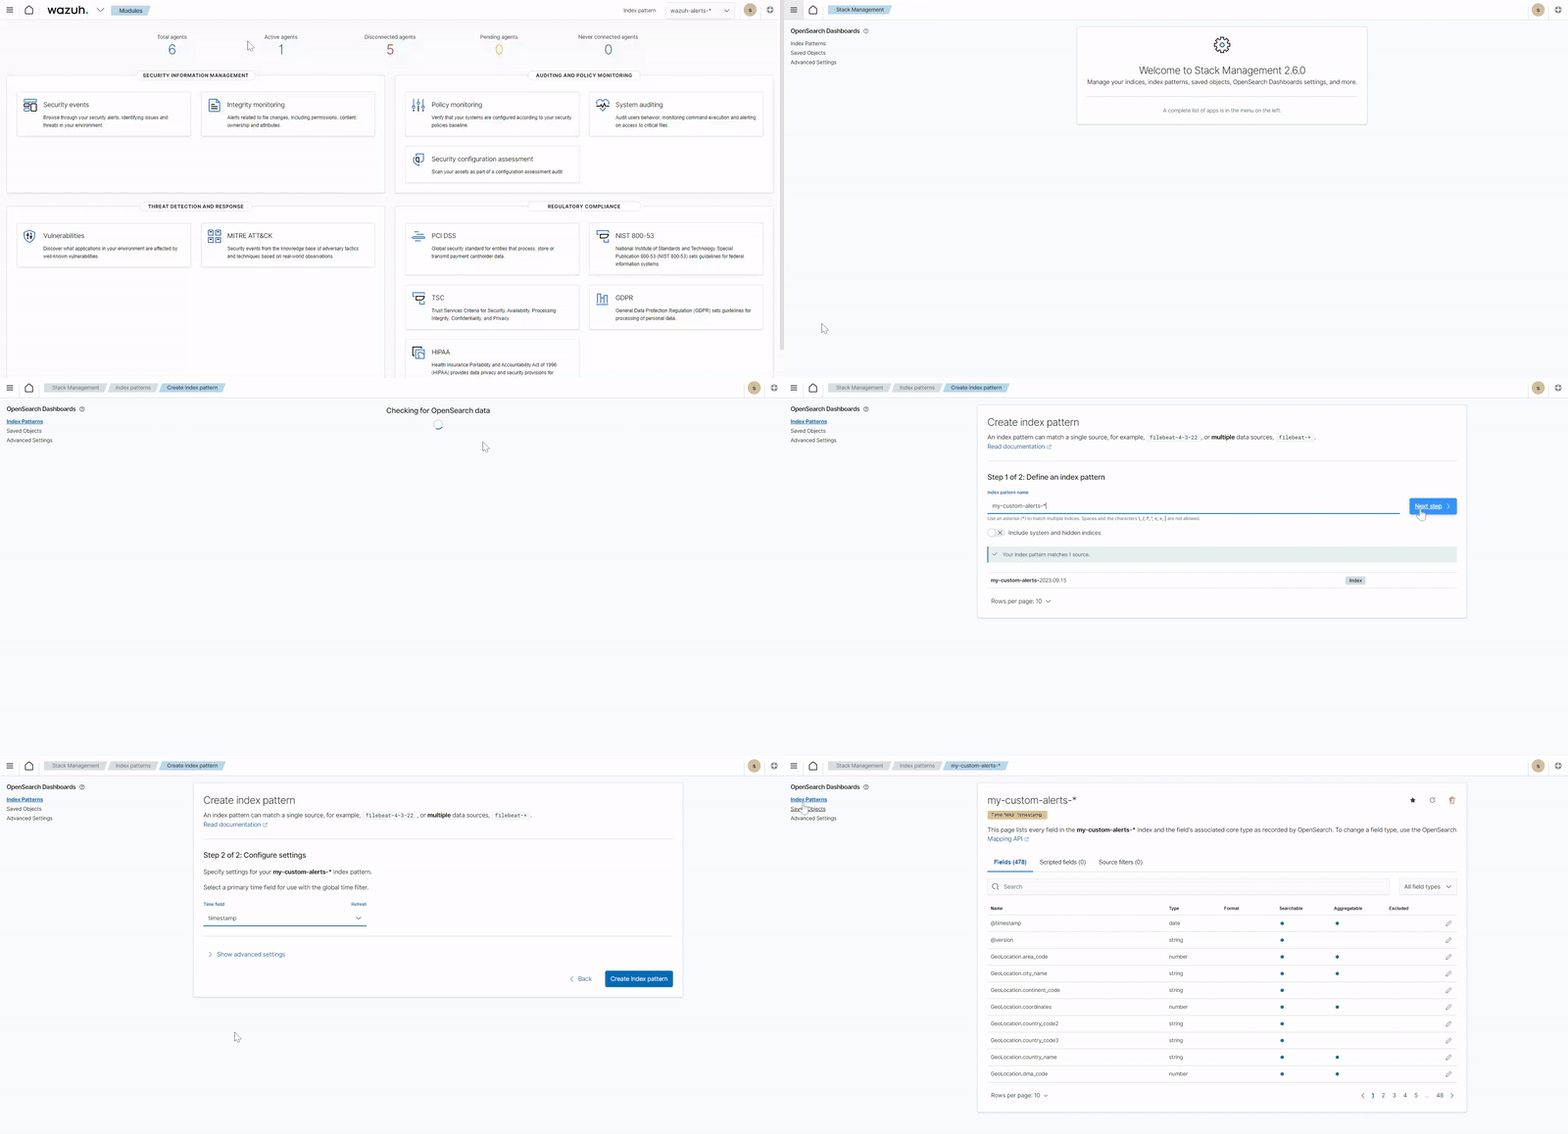
If the pattern is not present in the Wazuh dashboard, create a new one using the index pattern used in the template
my-custom-alerts-*, and make sure to usetimestampas the Time Filter field name.
Using the Wazuh indexer API
You can query the indices information using the Wazuh indexer API from the Wazuh dashboard or the Wazuh server.
Wazuh dashboard
Navigate to ☰ > Management > Dev Tools:
GET /_cat/indices/wazuh-*?v
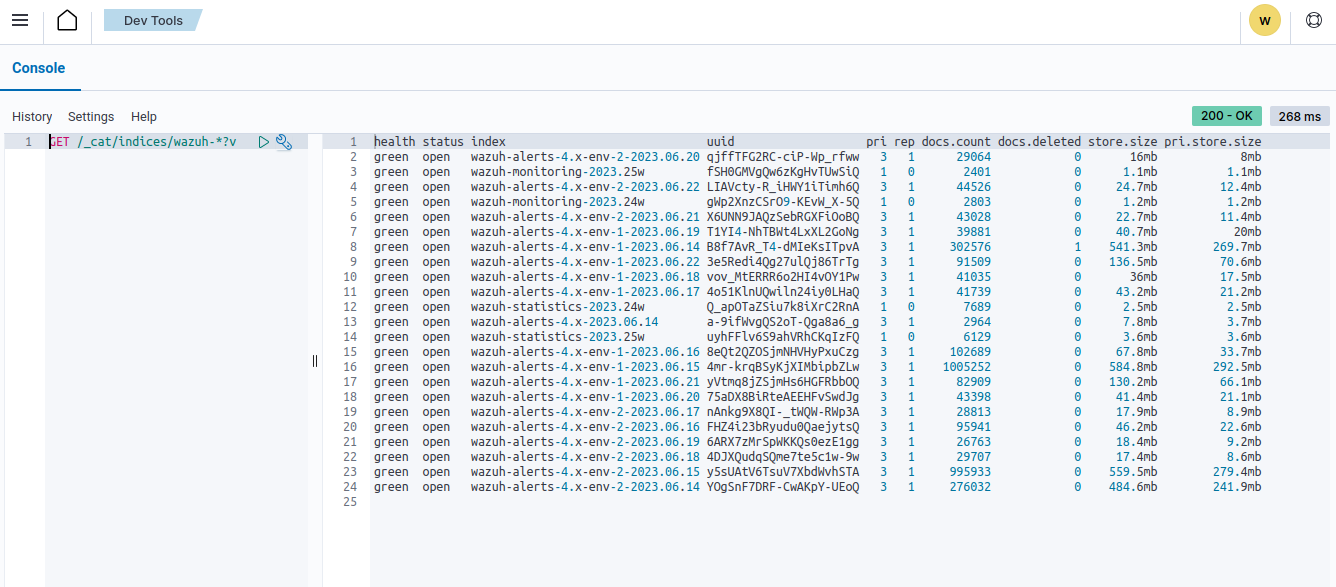
Command line interface
Obtain the Wazuh indexer username and password for fresh deployments using the below command:
# tar -axf wazuh-install-files.tar wazuh-install-files/wazuh-passwords.txt -O | grep -P "\'admin\'" -A 1
Note
If using the Wazuh OVA, use the default credentials admin:admin or refer to the password management section.
Run the following command to query your index status. Replace
<INDEXER_USERNAME>and<INDEXER_PASSWORD>with the username and password obtained. Replace<INDEXER_IP_ADDRESS>with your Wazuh indexer IP address or FQDN. You can replacewazuh-*with a more specific pattern for your query, such aswazuh-alerts-*.# curl -k -u <INDEXER_USERNAME>:<INDEXER_PASSWORD> https://<INDEXER_IP_ADDRESS>:9200/_cat/indices/wazuh-*?v
health status index                       uuid                   pri rep docs.count docs.deleted store.size pri.store.size
green  open   wazuh-statistics-2023.30w   xtHZtGqBR0WNJWbs5sjrnQ   1   0       2394            0      1.2mb          1.2mb
green  open   wazuh-alerts-4.x-2023.07.28 VbBfAasJTsiqw3lwRhY5sg   3   0        513            0      1.9mb          1.9mb
green  open   wazuh-alerts-4.x-2023.07.27 7s2x8INqRVmtz5uqMDuA7Q   3   0        515            0        2mb            2mb
green  open   wazuh-alerts-4.x-2023.07.05 0h4cyLJoQYiMvMnqyLDnag   3   0         49            0    370.4kb        370.4kb
green  open   wazuh-alerts-4.x-2023.07.07 kp_N4c7RRuOE91KkuqPuAw   3   0         98            0    397.7kb        397.7kb
green  open   wazuh-alerts-4.x-2023.07.29 rbAC4befS7epxOjiSzFRQQ   3   0       1717            0      3.9mb          3.9mb
green  open   wazuh-monitoring-2023.31w   1WwxsGQHRfG1_DOIZD-Lag   1   0        954            0    771.9kb        771.9kb
green  open   wazuh-alerts-4.x-2023.07.20 SQbaQC24SgO9eWO_AsBI_w   3   0       1181            0      2.8mb          2.8mb
green  open   wazuh-statistics-2023.28w   jO52bS6eRamtB2YNmfGzIA   1   0        676            0    501.1kb        501.1kb
The wazuh‑alerts-* indices
The Wazuh server analyzes events received from monitored endpoints and generates alerts when the events match a detection rule. These alerts are saved using the wazuh-alerts-* indices.
The Wazuh server logs the alert data into the /var/ossec/logs/alerts/alerts.json and /var/ossec/logs/alerts/alerts.log files by default. Once saved in the /var/ossec/logs/alerts/alerts.json file, it forwards the JSON alert document to the /var/lib/wazuh-indexer/ directory of the Wazuh indexer for indexing.
When forwarding alerts to the Wazuh indexer, the Wazuh server formats the current date into an index name. For example, the Wazuh server will define the index names wazuh-alerts-4.x-2023.03.17 and wazuh-alerts-4.x-2023.03.18 for March 17th and 18th alerts, respectively. The Wazuh indexer then creates alert indices using the defined wazuh‑alerts-* index names.
You can modify the default index name in the /usr/share/filebeat/module/wazuh/alerts/ingest/pipeline.json file of the Wazuh server. To do this, navigate to the date_index_name field and date_rounding key to change the default index name formatting in the /usr/share/filebeat/module/wazuh/alerts/ingest/pipeline.json file:
{
  "description": "Wazuh alerts pipeline",
  "processors": [
     { "json" : { "field" : "message", "add_to_root": true } },
     {
     "geoip": {
     "field": "data.srcip",
     "target_field": "GeoLocation",
     "properties": ["city_name", "country_name", "region_name", "location"],
     "ignore_missing": true,
     "ignore_failure": true
     }
     },
     {
     "geoip": {
     "field": "data.win.eventdata.ipAddress",
     "target_field": "GeoLocation",
     "properties": ["city_name", "country_name", "region_name", "location"],
     "ignore_missing": true,
     "ignore_failure": true
     }
     },
     {
     "geoip": {
     "field": "data.aws.sourceIPAddress",
     "target_field": "GeoLocation",
     "properties": ["city_name", "country_name", "region_name", "location"],
     "ignore_missing": true,
     "ignore_failure": true
     }
     },
     {
     "geoip": {
     "field": "data.gcp.jsonPayload.sourceIP",
     "target_field": "GeoLocation",
     "properties": ["city_name", "country_name", "region_name", "location"],
     "ignore_missing": true,
     "ignore_failure": true
     }
     },
     {
     "geoip": {
     "field": "data.office365.ClientIP",
     "target_field": "GeoLocation",
     "properties": ["city_name", "country_name", "region_name", "location"],
     "ignore_missing": true,
     "ignore_failure": true
     }
     },
     {
     "date": {
     "field": "timestamp",
     "target_field": "@timestamp",
     "formats": ["ISO8601"],
     "ignore_failure": false
     }
     },
     {
     "date_index_name": {
     "field": "timestamp",
     "date_rounding": "d",
     "index_name_prefix": "{{fields.index_prefix}}",
     "index_name_format": "yyyy.MM.dd",
     "ignore_failure": false
     }
     },
     { "remove": { "field": "message", "ignore_missing": true, "ignore_failure": true } },
     { "remove": { "field": "ecs", "ignore_missing": true, "ignore_failure": true } },
     { "remove": { "field": "beat", "ignore_missing": true, "ignore_failure": true } },
     { "remove": { "field": "input_type", "ignore_missing": true, "ignore_failure": true } },
     { "remove": { "field": "tags", "ignore_missing": true, "ignore_failure": true } },
     { "remove": { "field": "count", "ignore_missing": true, "ignore_failure": true } },
     { "remove": { "field": "@version", "ignore_missing": true, "ignore_failure": true } },
     { "remove": { "field": "log", "ignore_missing": true, "ignore_failure": true } },
     { "remove": { "field": "offset", "ignore_missing": true, "ignore_failure": true } },
     { "remove": { "field": "type", "ignore_missing": true, "ignore_failure": true } },
     { "remove": { "field": "host", "ignore_missing": true, "ignore_failure": true } },
     { "remove": { "field": "fields", "ignore_missing": true, "ignore_failure": true } },
     { "remove": { "field": "event", "ignore_missing": true, "ignore_failure": true } },
     { "remove": { "field": "fileset", "ignore_missing": true, "ignore_failure": true } },
     { "remove": { "field": "service", "ignore_missing": true, "ignore_failure": true } }
  ],
  "on_failure" : [{
     "drop" : { }
  }]
}
Where the values:
M - stands for monthw - stands for weekd - stands for dayThe wazuh‑archives-* indices
In addition to logging alerts to the /var/ossec/logs/alerts/alerts.json and /var/ossec/logs/alerts/alerts.log files, you can enable the Wazuh archives to log and index all the events the Wazuh server receives. This includes events that are analyzed by Wazuh and events that do not trigger alerts.
Storing and indexing all events might be useful for later analysis and compliance requirements. However, you must consider that enabling logging and indexing of all events will increase the storage requirement on the Wazuh server.
By default, the Wazuh indexer creates event indices for each unique day. You can modify the default index name in the /usr/share/filebeat/module/wazuh/archives/ingest/pipeline.json file of the Wazuh server. To do this, navigate to the date_index_name field and date_rounding key to change the default index name formatting in the /usr/share/filebeat/module/wazuh/archives/ingest/pipeline.json file.
The sections below provide details on how to enable the wazuh archives and set up the wazuh-archives-* indices.
Enabling Wazuh archives
Edit
/var/ossec/etc/ossec.confon the Wazuh server and set the<logall_json>line toyes. This enables logging to archives.json of all events. Forwarding to the Wazuh indexer requires the logging of all events in JSON format.<logall_json>yes</logall_json>
Restart the Wazuh manager to make the change effective.
# systemctl restart wazuh-manager
or
# service wazuh-manager restart
Edit
/etc/filebeat/filebeat.ymland changeenabledtotruein the archives mapping. This enables events to be forwarded to the Wazuh indexer.filebeat.modules: - module: wazuh alerts: enabled: true archives: enabled: true
Restart the Filebeat service to apply the change:
# systemctl restart filebeat
Test that the Filebeat service works properly:
# filebeat test output
elasticsearch: https://127.0.0.1:9200...
  parse url... OK
  connection...
    parse host... OK
    dns lookup... OK
    addresses: 127.0.0.1
    dial up... OK
  TLS...
    security: server's certificate chain verification is enabled
    handshake... OK
    TLS version: TLSv1.2
    dial up... OK
  talk to server... OK
  version: 7.10.2
Defining the index pattern
Go to Management > Stack Management and click Index Patterns from the Wazuh dashboard upper left menu ☰.
Click on Create index pattern.
Set
wazuh-archives-*as the Index pattern name. This defines the index pattern to match the events being forwarded and indexed. Click on Next step.Select timestamp for the Time field.
Note
Be careful to choose timestamp instead of @timestamp.
Click on Create index pattern.
Viewing the index pattern
Click Discover on the upper left menu ☰.
Select wazuh-archives-* to view the events.
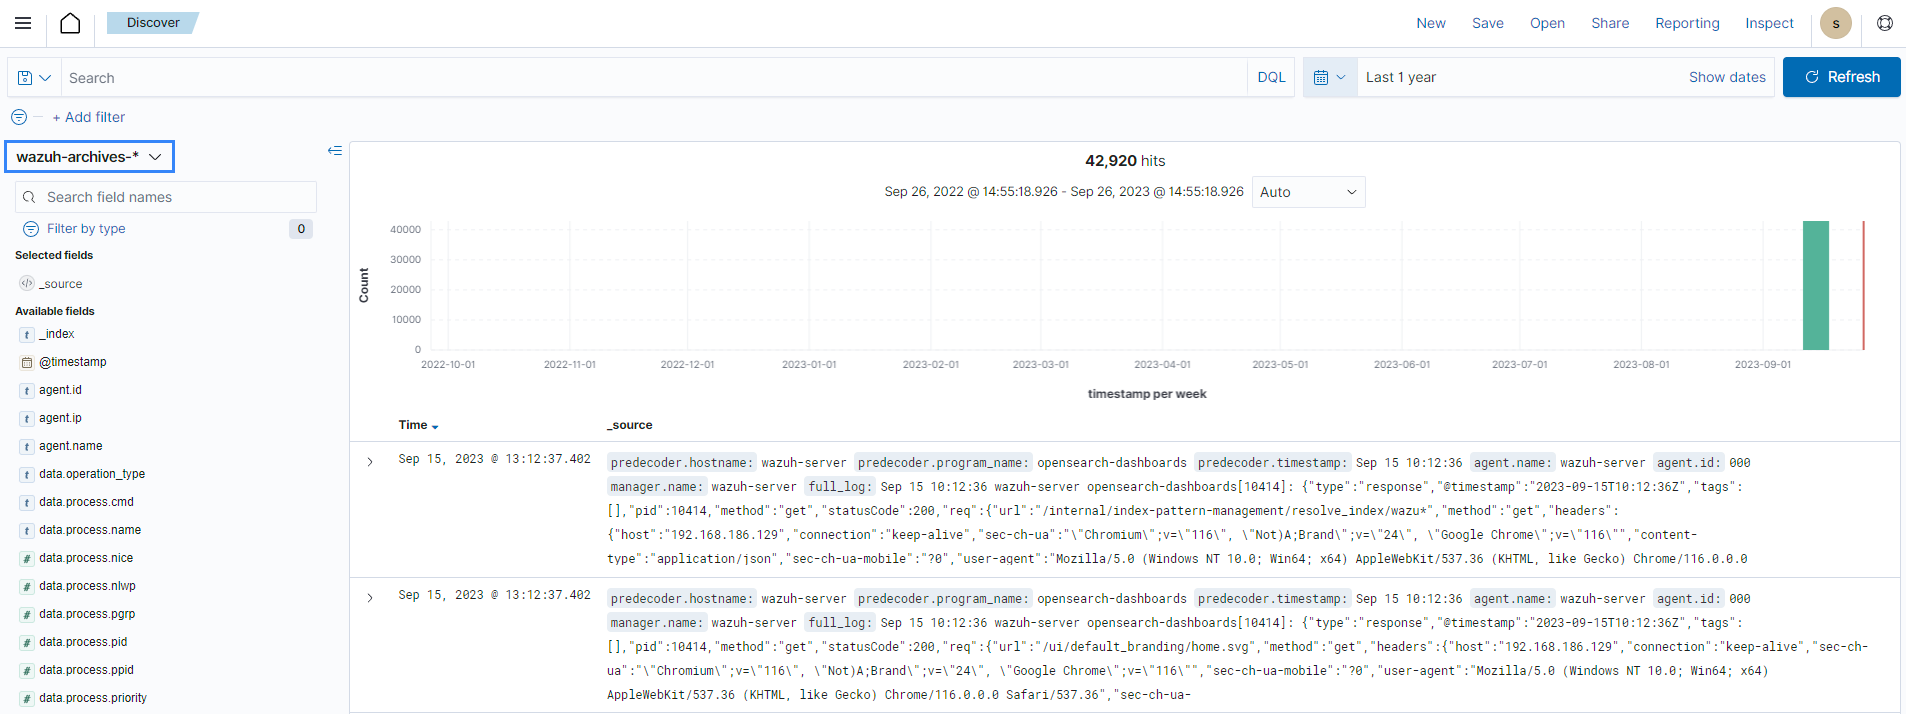
The wazuh-monitoring-* indices
At any moment, the connection status of an enrolled Wazuh agent is one of the following:
Active
Disconnected
Pending
Never connected
Wazuh stores a history of the connection status of all its agents. By default, it indexes the agent connection status using the wazuh‑monitoring-* indices. The Wazuh indexer creates one of these indices per week by default. Check the documentation on custom creation intervals. These indices store the connection status of all the agents every 15 minutes by default. Check the documentation on the frequency of API requests.
The Wazuh dashboard requires these indices to display information about agent status. For example, by clicking Agents, you can see information such as the Wazuh agent's connection status and historical evolution within set timeframes.
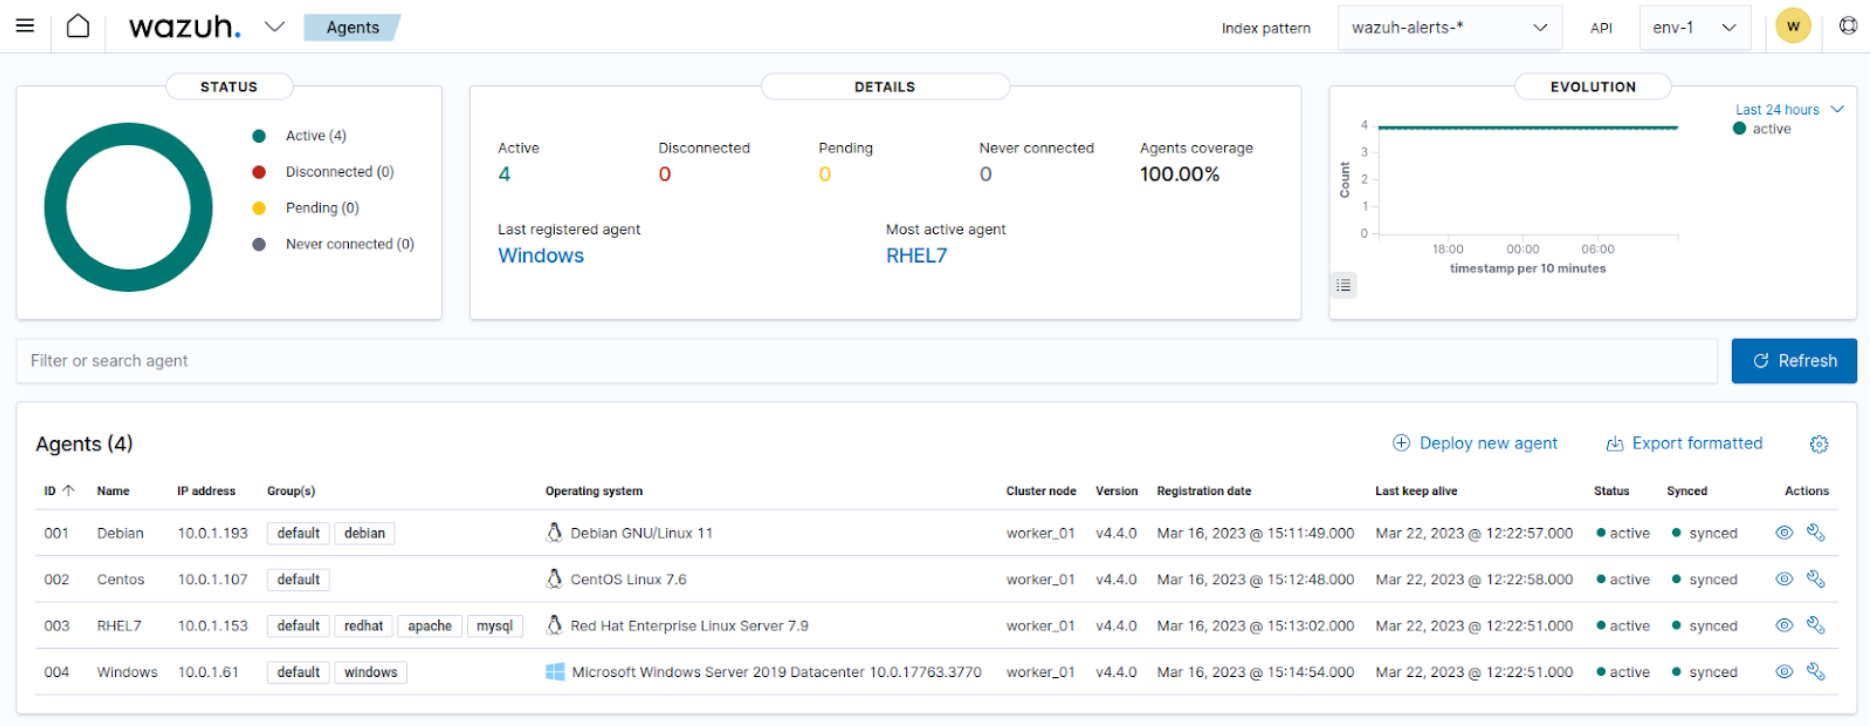
In the Wazuh dashboard configuration file, you can change the settings to do the following:
Disable inserting and showing connection status data for the agents. Change wazuh.monitoring.enabled to accomplish this.
Change the insertion frequency of connection status data for the agents. Change wazuh.monitoring.frequency to accomplish this.
The wazuh‑statistics-* indices
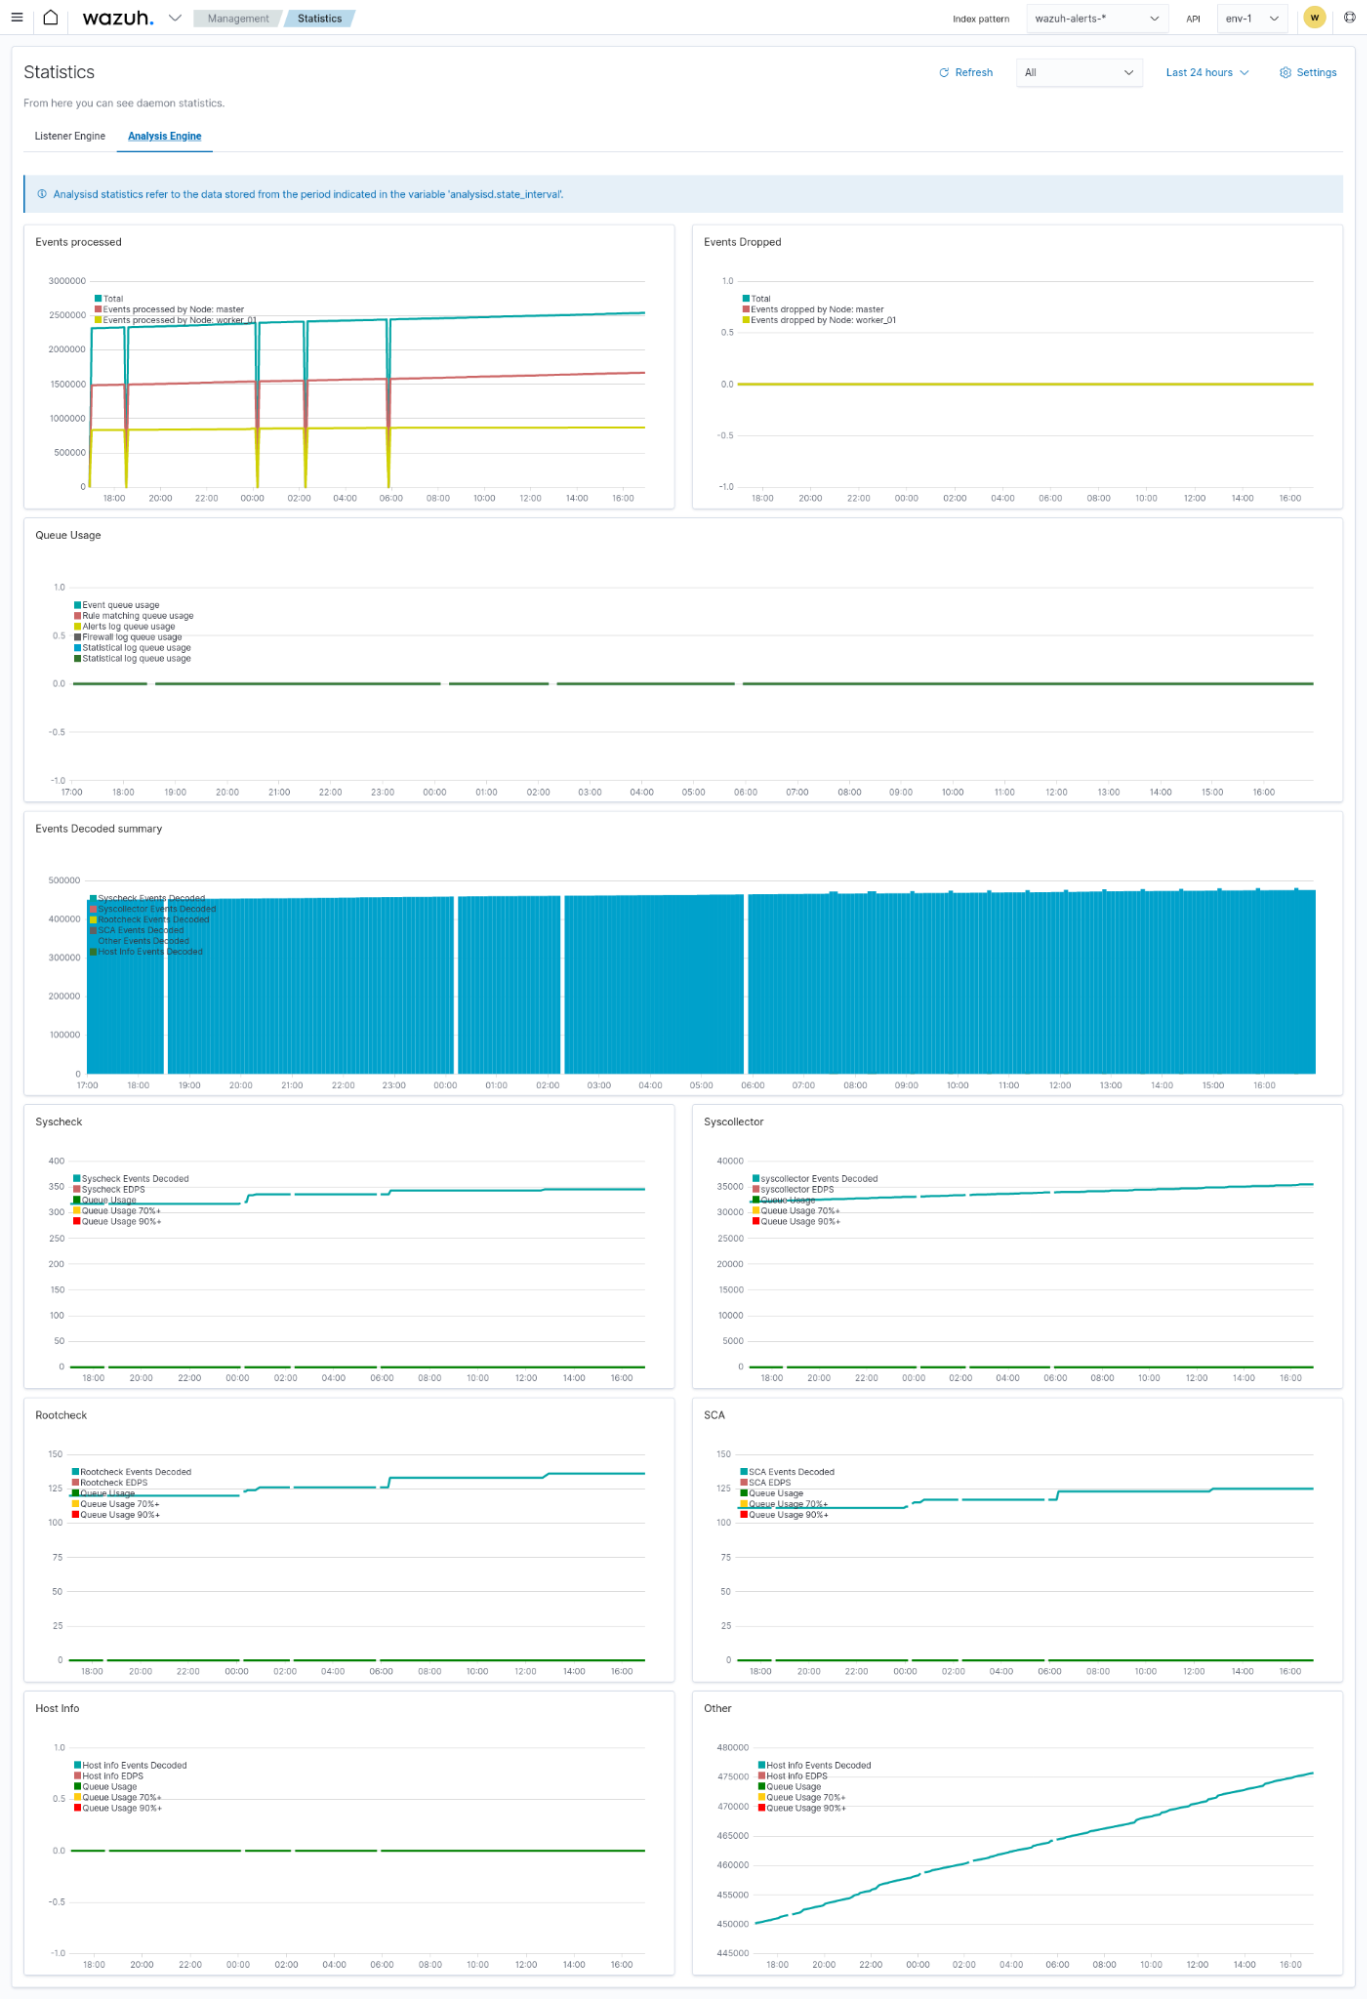
The Wazuh dashboard uses the wazuh‑statistics-* indices to display statistics about the Wazuh server usage and performance. The information displayed includes the number of events decoded, bytes received, and TCP sessions.
The Wazuh dashboard runs requests to the Wazuh manager API to query usage-related information. It inserts data into the wazuh‑statistics-* indices from the information collected. The Wazuh indexer creates a wazuh‑statistics-* index per week by default. Check the documentation on the Statistics creation interval. These indices store Wazuh server statistics every 5 minutes by default. Check the documentation on the Frequency of task execution.
To visualize this information in the Wazuh dashboard, go to Management > Statistics.
