Wazuh archives
The Wazuh archives refer to the storage files created by the Wazuh server that contain logs, alerts, and other security-related data collected from monitored endpoints. Wazuh archives store all events received by the Wazuh server, whether or not they trip a rule. Wazuh archives are useful for threat hunting, as security teams use archived logs to review historical data of security incidents, analyze trends, and generate reports.
By default, Wazuh archives are disabled because they store a large number of logs on the Wazuh server. When enabled, Wazuh archives allow organizations to store and retain security data for compliance and forensic purposes.
Note
Wazuh archives retain logs collected from all monitored endpoints, therefore consuming significant storage resources on the Wazuh server over time. So, it is important to consider the impact on disk space and performance before enabling them.
Enabling the Wazuh archives
Perform the steps below to enable the Wazuh archives on your Wazuh server.
Edit the Wazuh manager configuration file
/var/ossec/etc/ossec.confand set the value of the highlighted fields below toyes:<ossec_config> <global> <jsonout_output>yes</jsonout_output> <alerts_log>yes</alerts_log> <logall>yes</logall> <logall_json>yes</logall_json> ... </ossec_config>
Where:
<logall>option enables or disables archiving of all log messages. When enabled, the Wazuh server stores the logs in a syslog format. The allowed values areyesandno.<logall_json>option enables or disables logging of events. When enabled, the Wazuh server stores the events in a JSON format. The allowed values areyesandno.
Depending on the format you desire, you can set one or both values of the highlighted fields to
yes. However, only the<logall_json>yes</logall_json>option allows you to create an index that can be used to visualize the events on the Wazuh dashboard.Restart the Wazuh manager to apply the configuration changes:
$ sudo systemctl restart wazuh-manager
Depending on your chosen format, the file
archives.log,archives.json, or both will be created in the/var/ossec/logs/archives/directory on the Wazuh server.Wazuh uses a default log rotation policy. It ensures that available disk space is conserved by rotating and compressing logs on a daily, monthly, and yearly basis.
Visualizing the events on the dashboard
You can use the Discover dashboard to view and query events stored in the Wazuh archives. To create the indices and view them in the Wazuh dashboard, follow the steps below.
Wazuh server
Edit the Filebeat configuration file
/etc/filebeat/filebeat.ymland change the value ofarchives: enabledfromfalsetotrue:archives: enabled: trueRestart Filebeat to apply the configuration changes:
$ sudo systemctl restart filebeat
Wazuh dashboard
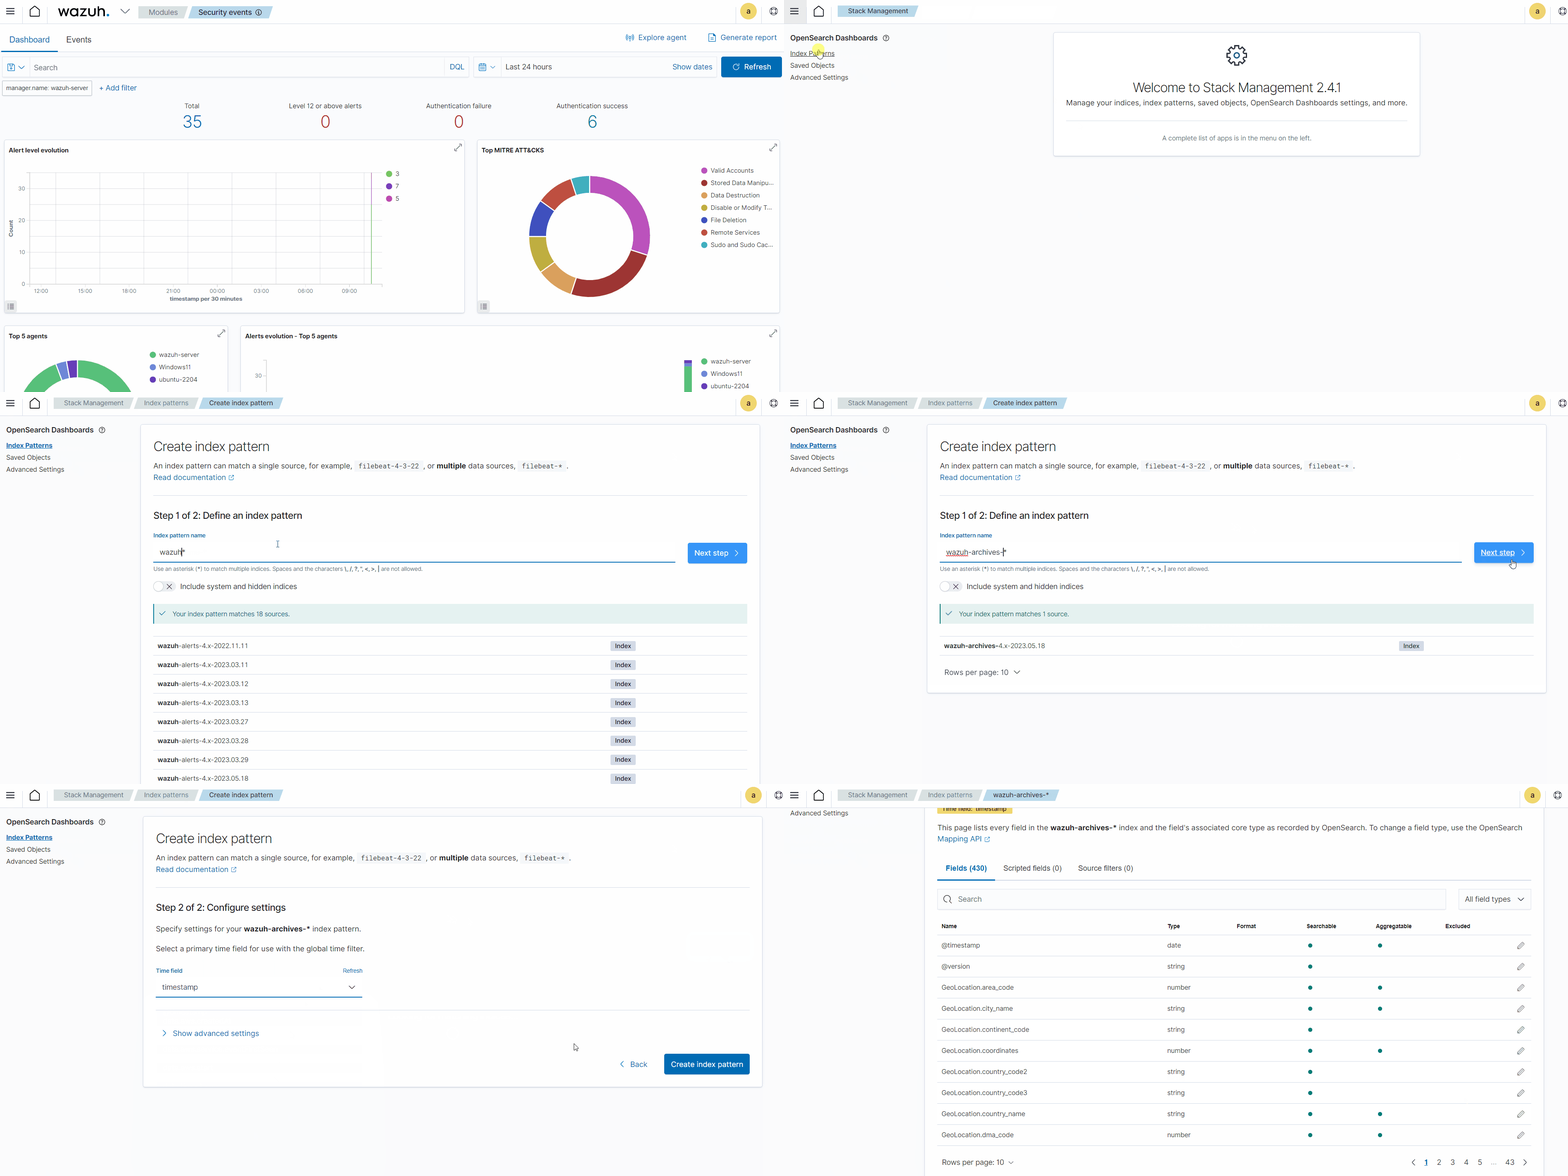
Click the upper-left menu icon and navigate to Stack management > Index patterns > Create index pattern. Use
wazuh-archives-*as the index pattern name, and settimestampin the Time field drop-down list.The GIF below shows how to create the index pattern.
To view the events on the dashboard, click the upper-left menu icon and navigate to Discover. Change the index pattern to
wazuh-archives-*.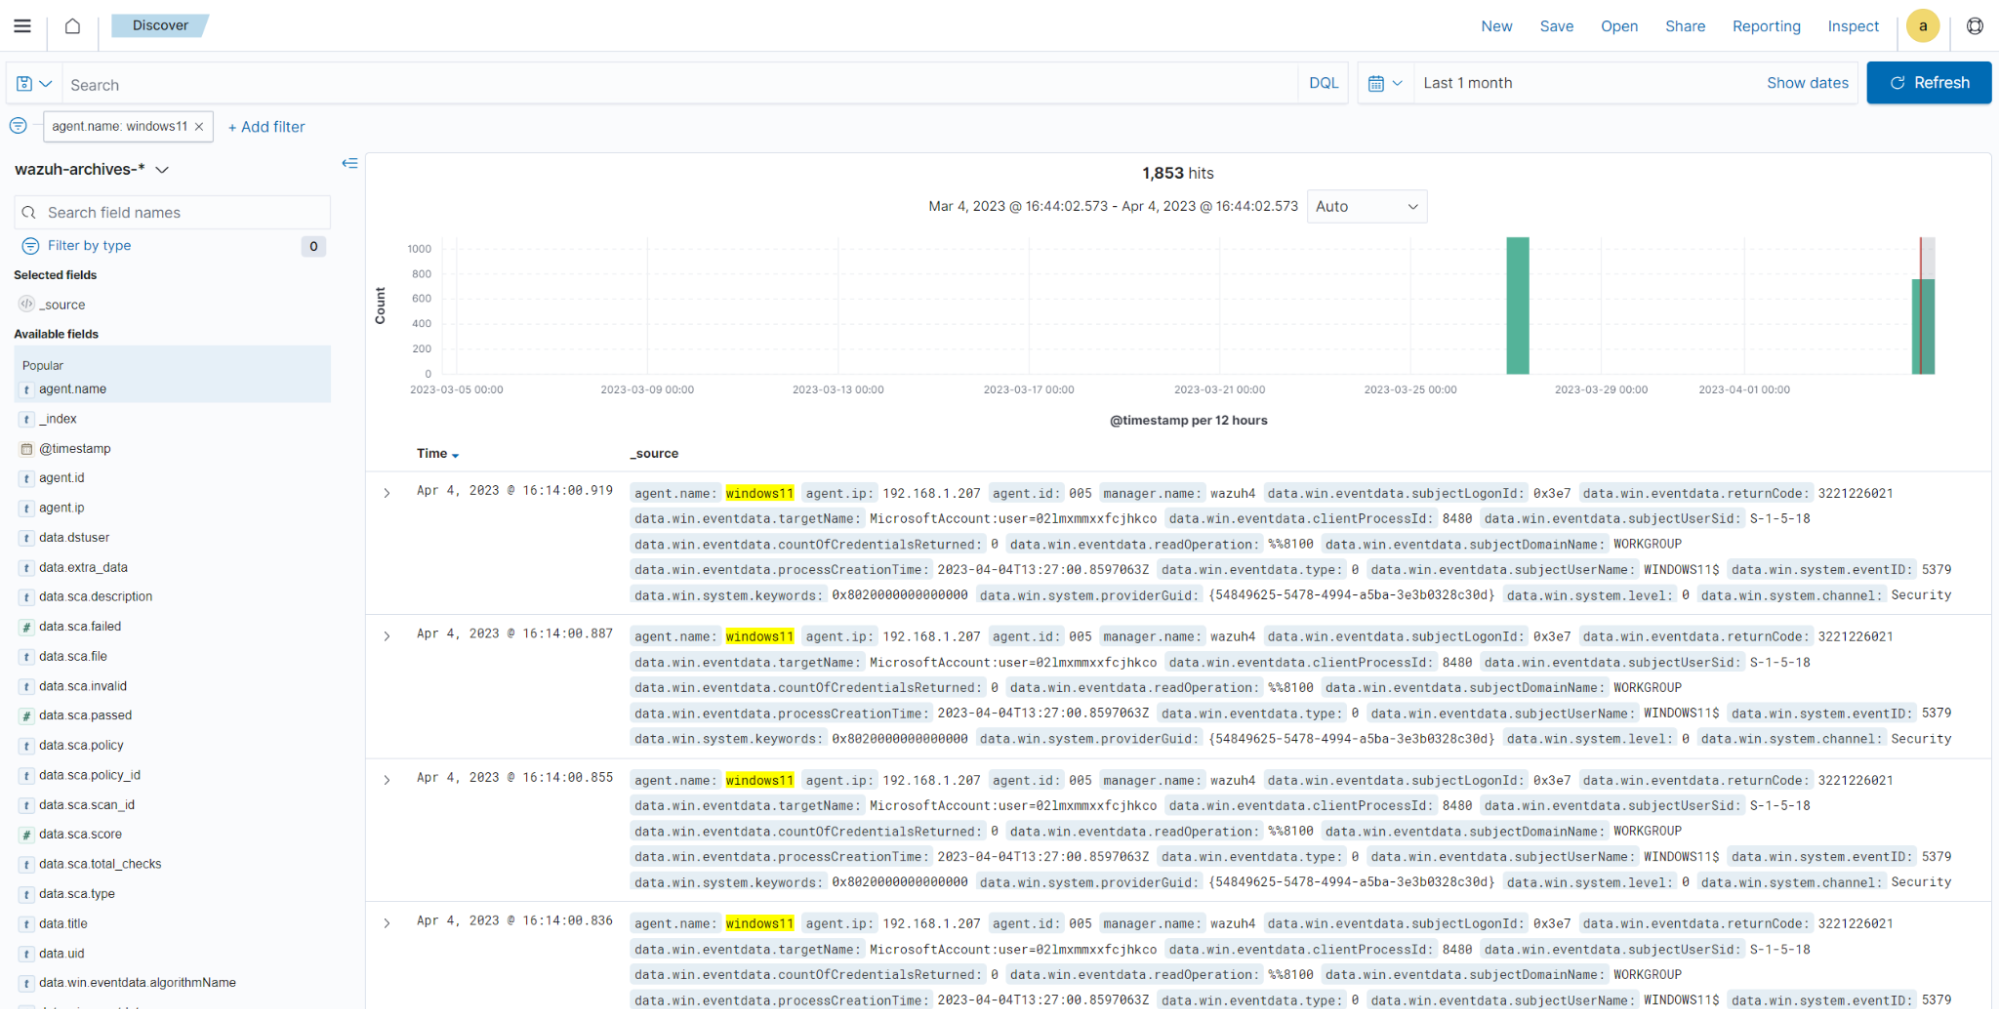
Use case: Detecting signed binary proxy execution
Signed binary proxy execution is a technique threat actors use to bypass application whitelisting by using trusted binaries to run malicious code. This technique is identified as T1218.010 based on the MITRE ATT&CK framework. In this use case, we show how to abuse the Windows utility, regsvr32.exe to bypass application controls. We then analyze events in the Wazuh archives to detect suspicious activity related to this technique.
Windows 11 configuration
Perform the steps below to install Sysmon and Atomic Red Team (ART) on a Windows 11 endpoint and emulate the signed binary proxy execution technique.
Sysmon integration
Perform the steps below to install and configure Sysmon on the Windows 11 endpoint.
Download Sysmon from the Microsoft Sysinternals page.
Download the Sysmon configuration file: sysmonconfig.xml.
Install Sysmon with the downloaded configuration file using PowerShell as an administrator:
> .\sysmon64.exe -accepteula -i .\sysmonconfig.xml
Add the following configuration within the
<ossec_config>block to the Wazuh agent configuration fileC:\Program Files (x86)\ossec-agent\ossec.confto specify the location for collecting Sysmon logs:<localfile> <location>Microsoft-Windows-Sysmon/Operational</location> <log_format>eventchannel</log_format> </localfile>
Restart the Wazuh agent to apply the changes by running the following PowerShell command as an administrator:
> Restart-Service -Name Wazuh
Atomic Red Team installation
Perform the following steps to install the Atomic Red Team PowerShell module on a Windows 11 endpoint using PowerShell as an administrator.
Run the command below to modify the PowerShell default execution policy to
RemoteSigned:> Set-ExecutionPolicy RemoteSigned
Install the ART execution framework:
> IEX (IWR 'https://raw.githubusercontent.com/redcanaryco/invoke-atomicredteam/master/install-atomicredteam.ps1' -UseBasicParsing);
> Install-AtomicRedTeam -getAtomics
Import the ART module to use the
Invoke-AtomicTestfunction:> Import-Module "C:\AtomicRedTeam\invoke-atomicredteam\Invoke-AtomicRedTeam.psd1" -Force
Use the
Invoke-AtomicTestfunction to show details of theT1218.010technique:> Invoke-AtomicTest T1218.010 -ShowDetailsBrief
PathToAtomicsFolder = C:\AtomicRedTeam\atomics

T1218.010-1 Regsvr32 local COM scriptlet execution
T1218.010-2 Regsvr32 remote COM scriptlet execution
T1218.010-3 Regsvr32 local DLL execution
T1218.010-4 Regsvr32 Registering Non DLL
T1218.010-5 Regsvr32 Silent DLL Install Call DllRegisterServer
Attack emulation
Emulate the signed binary proxy execution technique on the Windows 11 endpoint.
Run the command below with Powershell as an administrator to perform the
T1218.010test:> Invoke-AtomicTest T1218.010
PathToAtomicsFolder = C:\AtomicRedTeam\atomics

Executing test: T1218.010-1 Regsvr32 local COM scriptlet execution
Done executing test: T1218.010-1 Regsvr32 local COM scriptlet execution
Executing test: T1218.010-2 Regsvr32 remote COM scriptlet execution
Done executing test: T1218.010-2 Regsvr32 remote COM scriptlet execution
Executing test: T1218.010-3 Regsvr32 local DLL execution
Done executing test: T1218.010-3 Regsvr32 local DLL execution
Executing test: T1218.010-4 Regsvr32 Registering Non DLL
Done executing test: T1218.010-4 Regsvr32 Registering Non DLL
Executing test: T1218.010-5 Regsvr32 Silent DLL Install Call DllRegisterServer
Done executing test: T1218.010-5 Regsvr32 Silent DLL Install Call DllRegisterServer
Several calculator instances will pop up after a successful execution of the exploit.
Wazuh dashboard
Use the Wazuh archives to query and display events related to the technique being hunted. It's important to note that while consulting the archives, some events might already be captured as alerts on the Wazuh dashboard. You can use information from the Wazuh archives, including alerts and events that have no detection to create custom rules based on your specific requirements.
Apply a time range filter to view events that occurred within the last five minutes of when the test was performed. Filter to view logs from the specific Windows endpoint using
agent.id,agent.iporagent.name.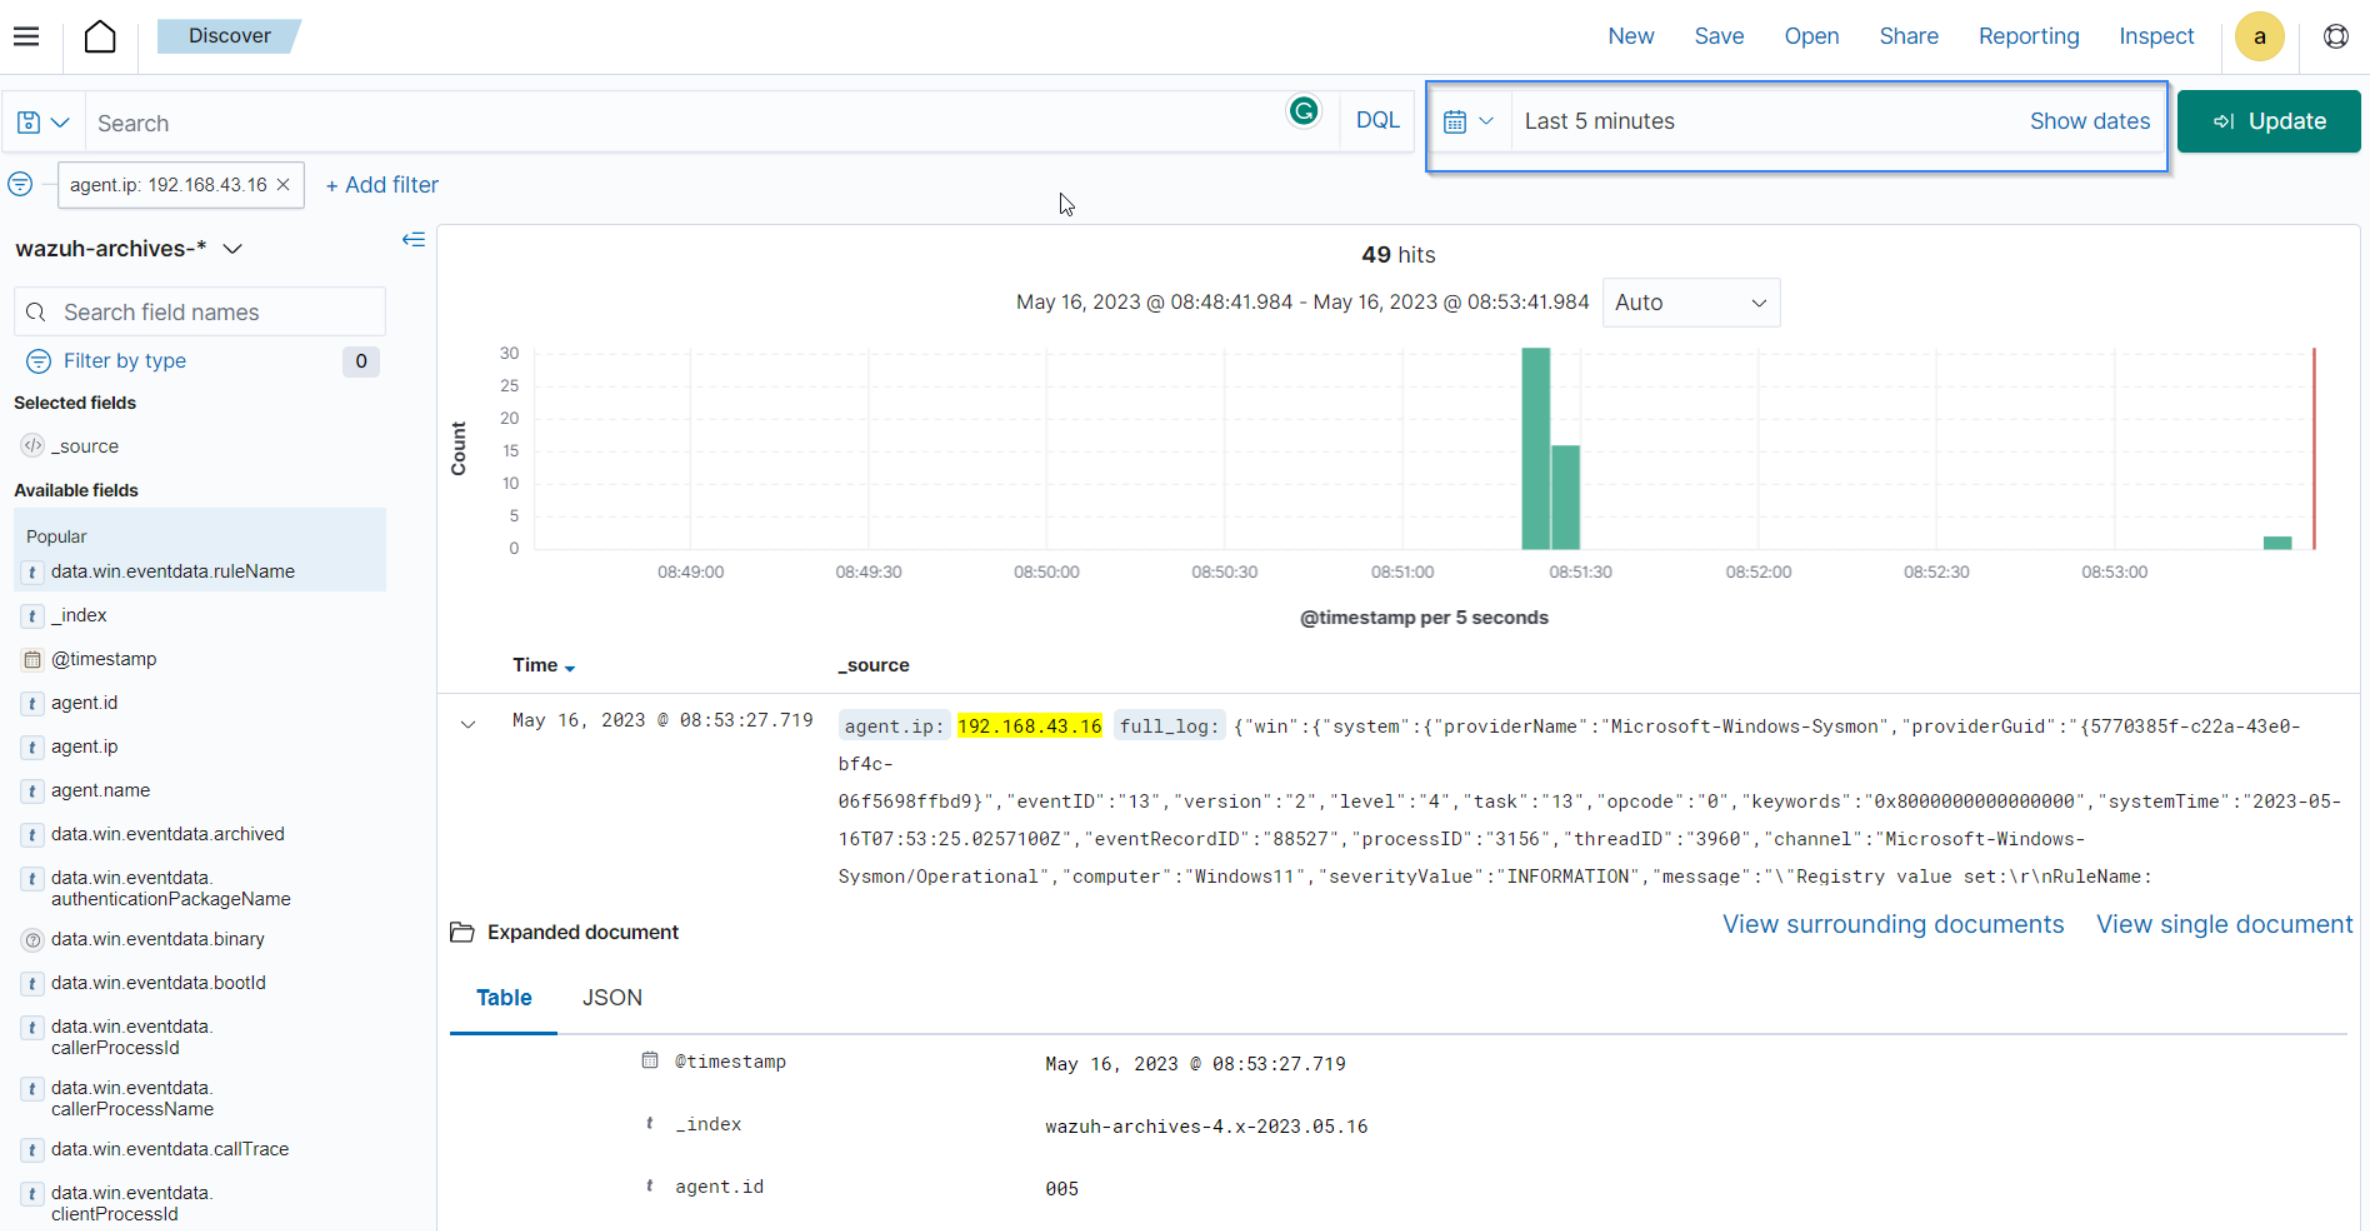
There are multiple hits that you can investigate to determine a correlation with the earlier attack emulation. For instance, you may notice a calculator spawning event similar to the one observed on the Windows endpoint during the test.
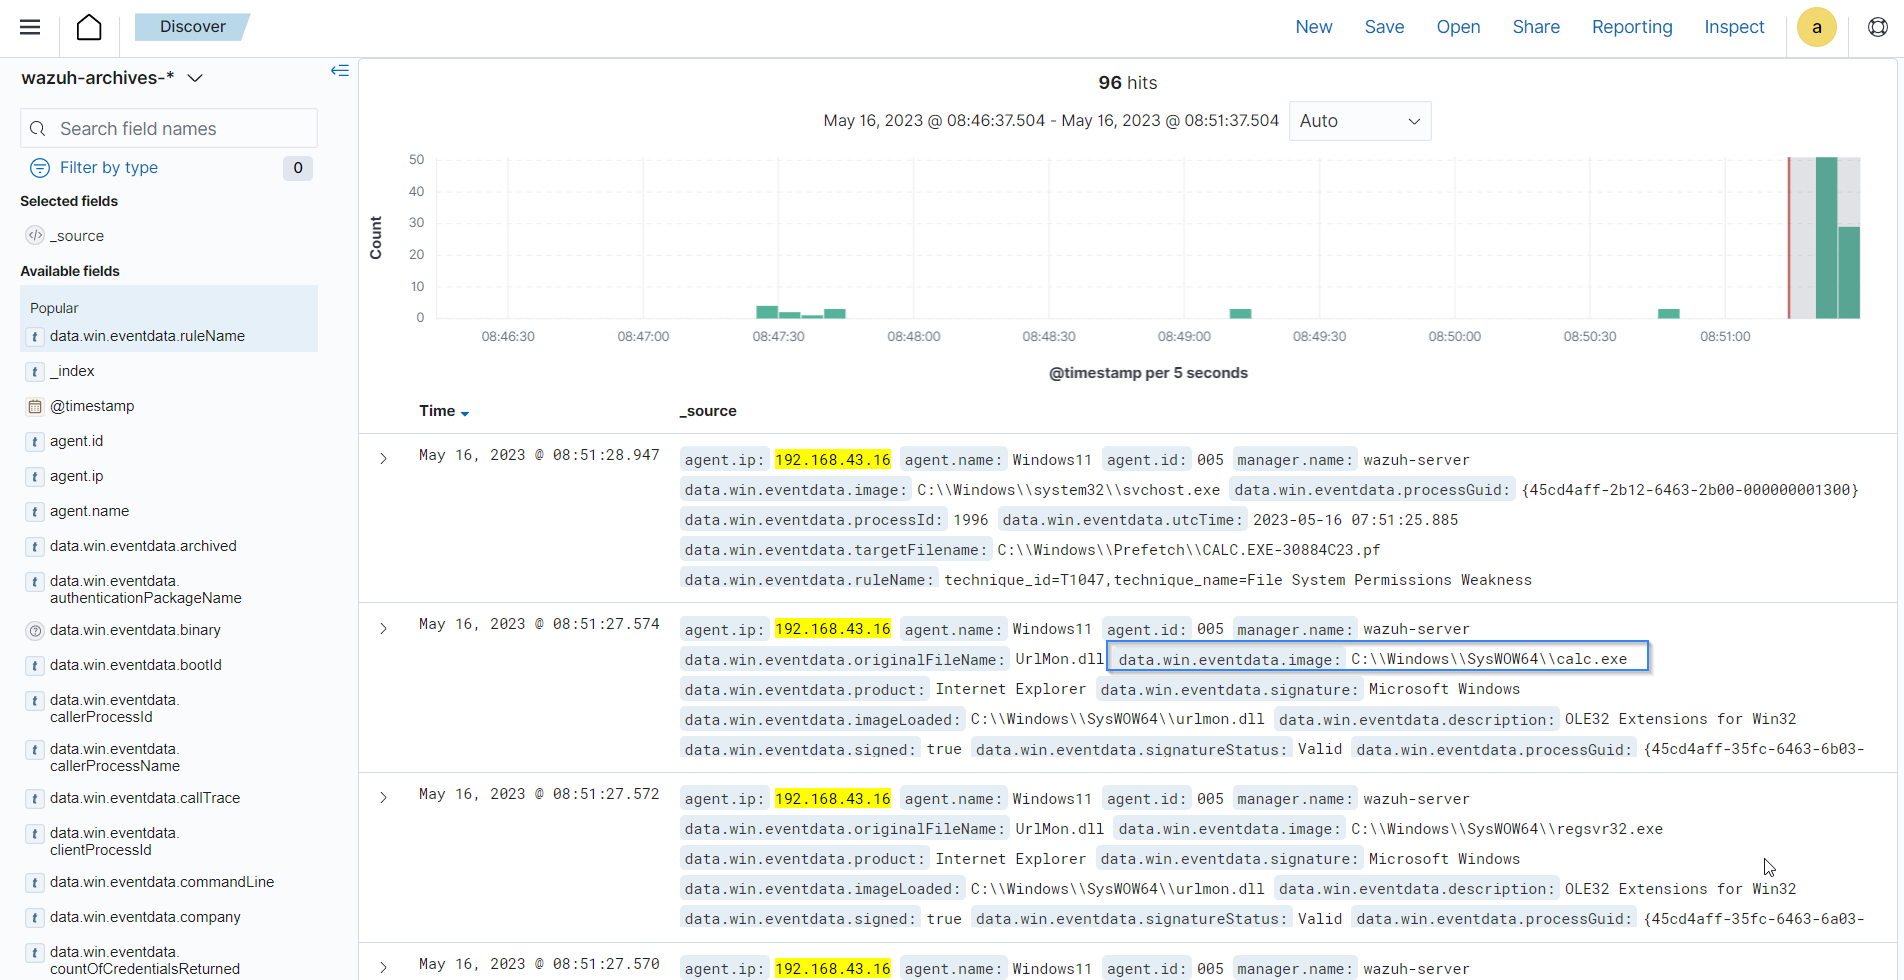
Type
regsvr32in the search bar to streamline and investigate events related to theregsvr32utility.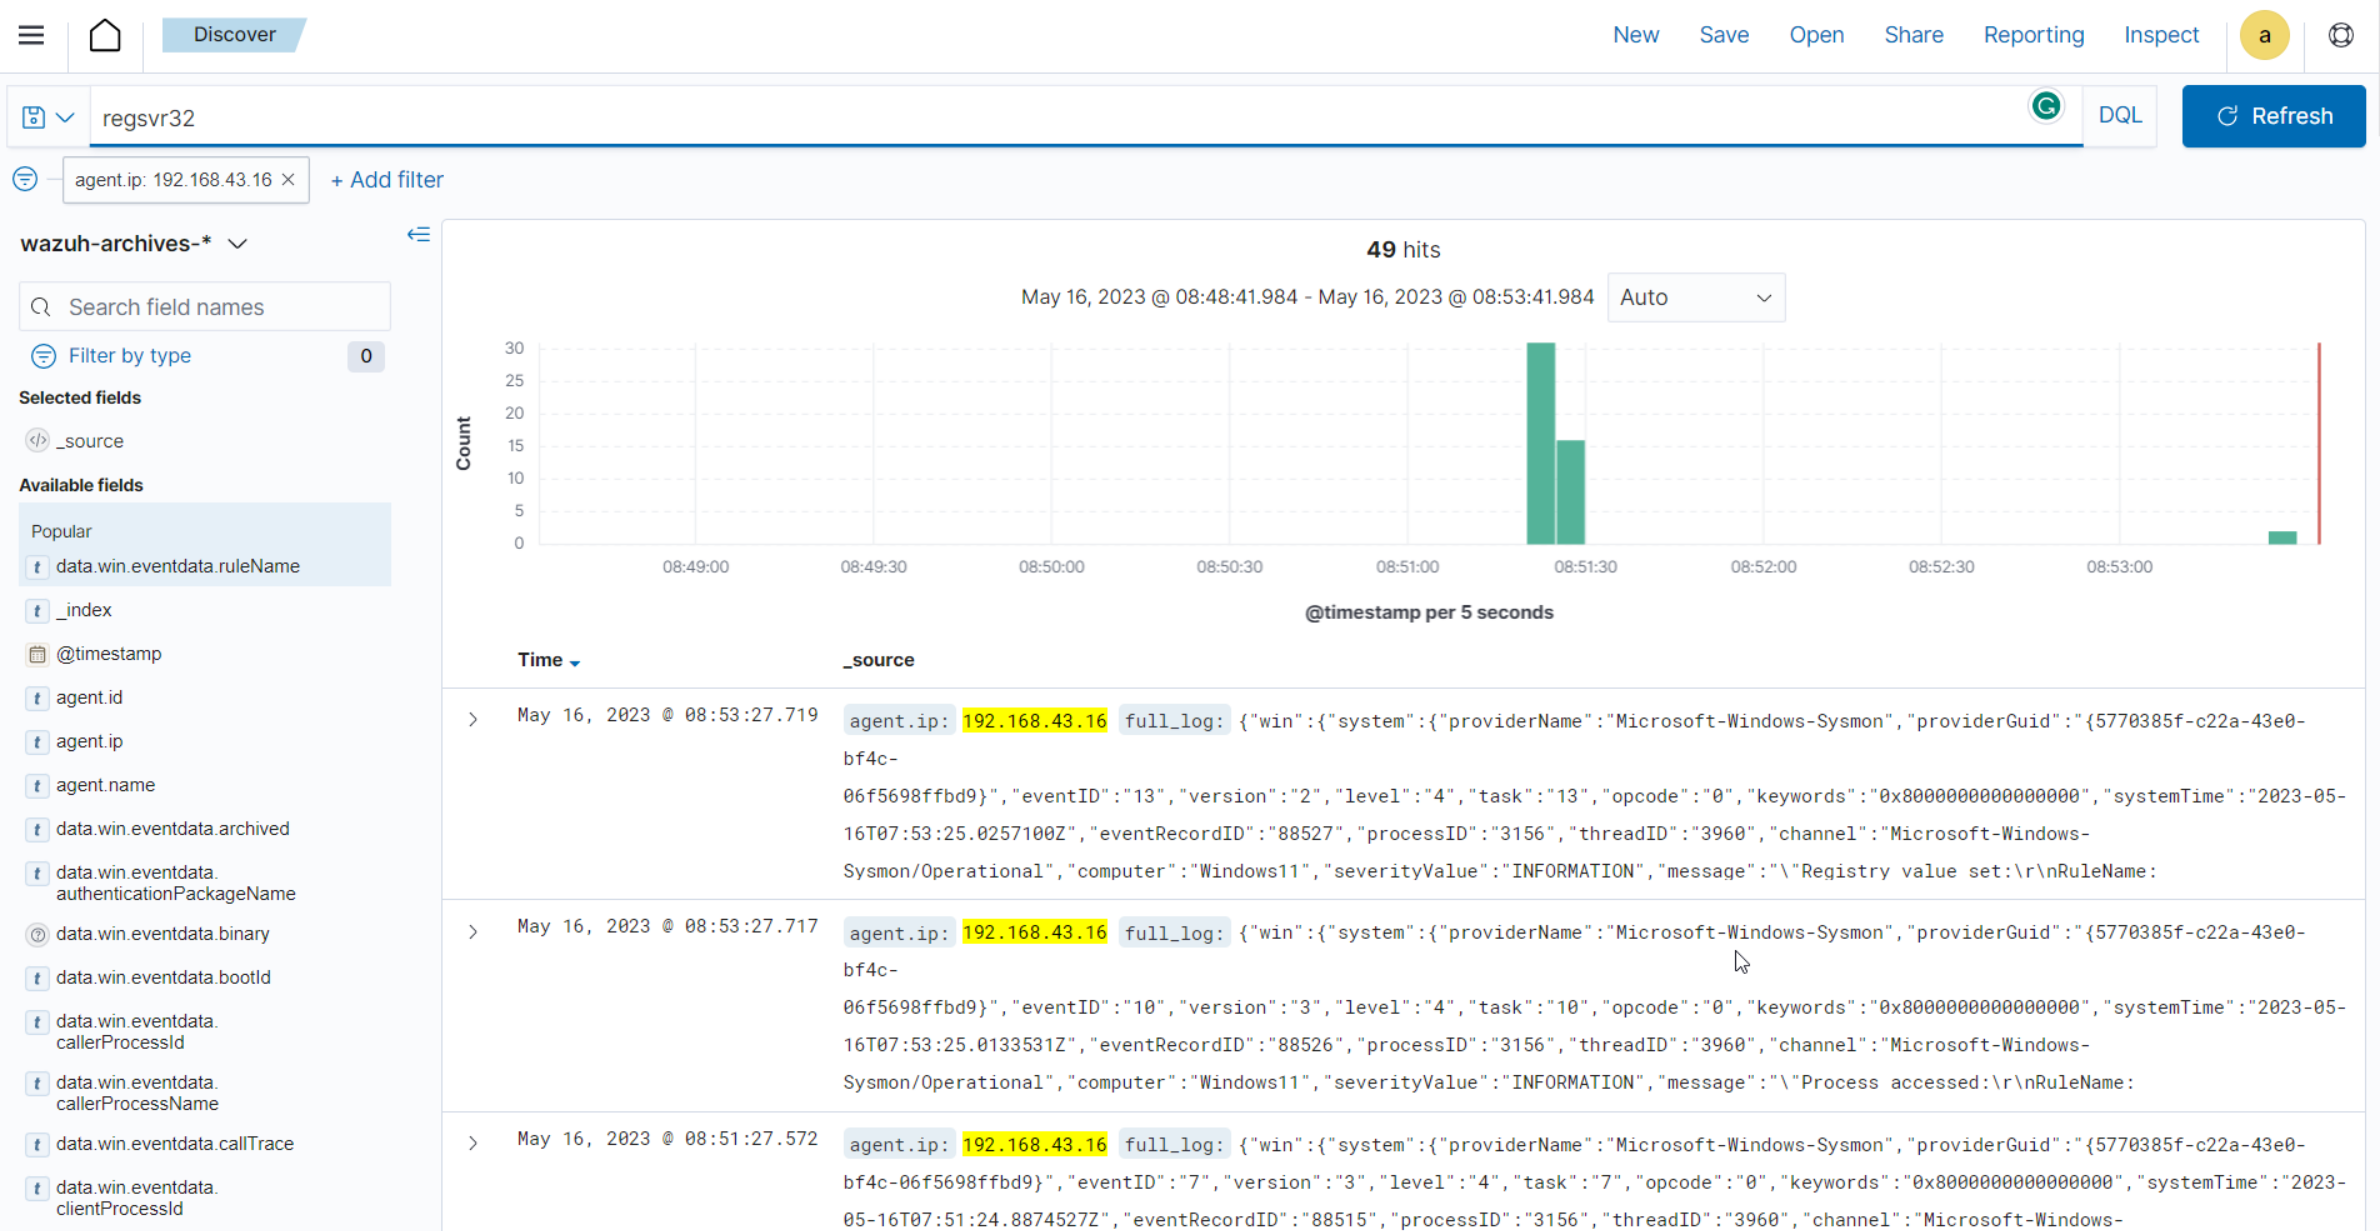
Expand any of the events to view their associated fields.
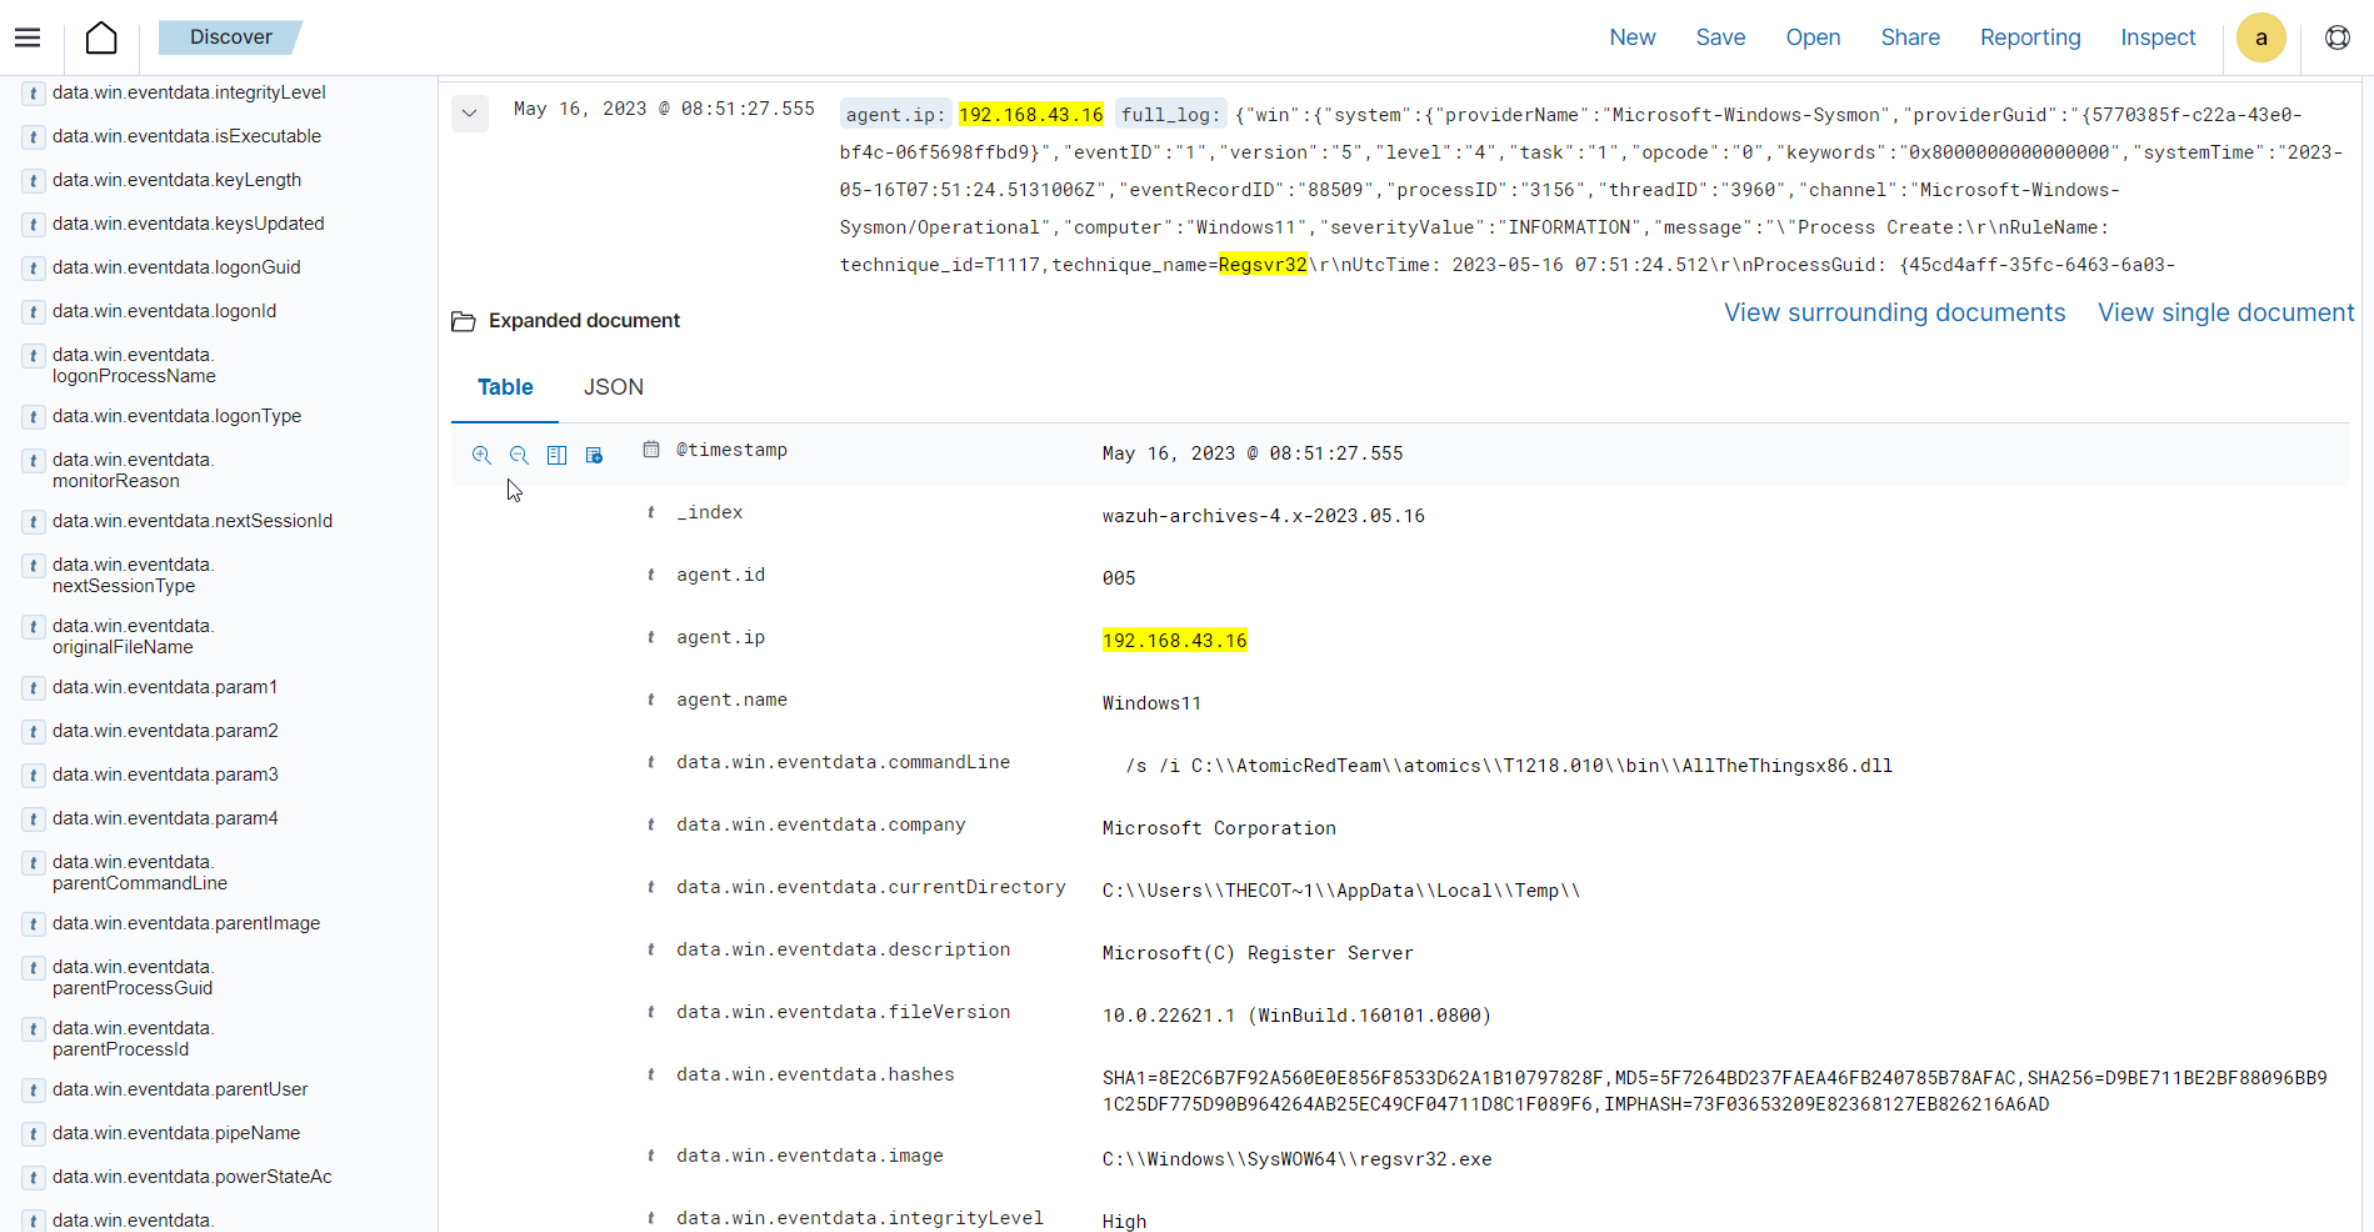
Click on the JSON tab to view the JSON format of the archived logs.
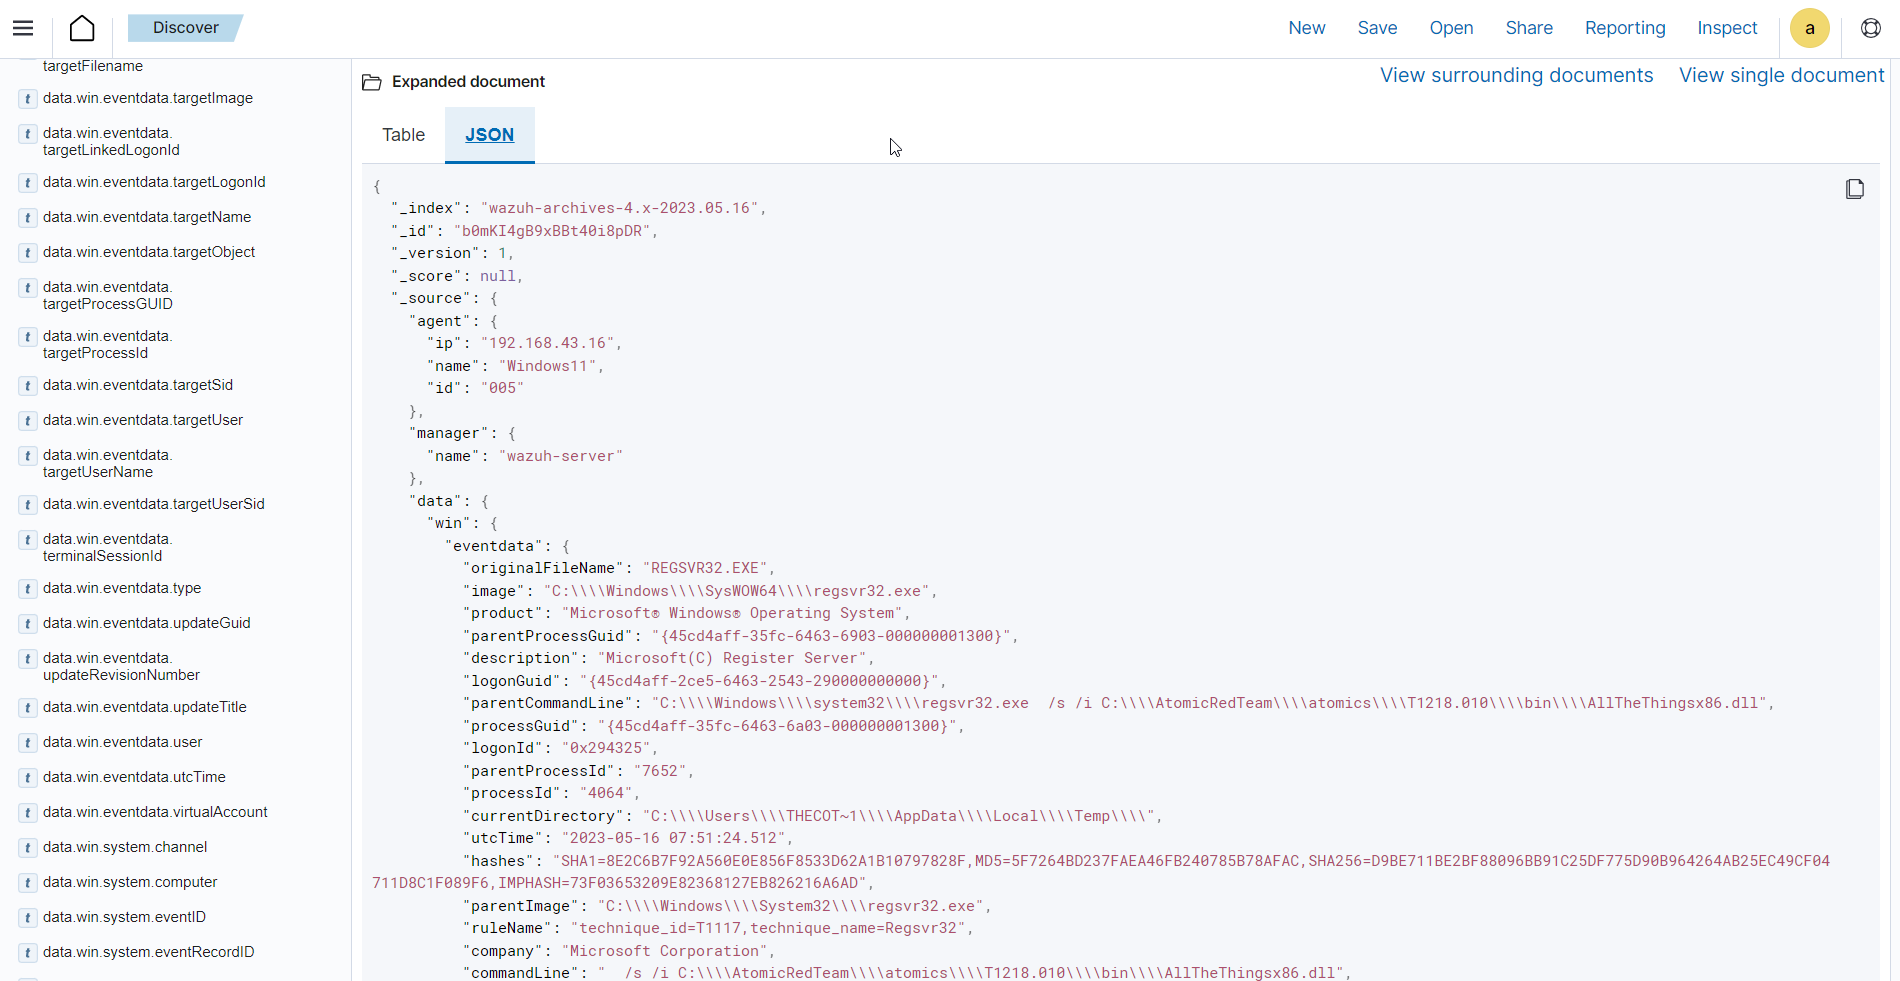
You can extract and verify specific details on the activities such as commands, services, paths, and more from the JSON log. Below, you can identify the initial process creation and the attributes related to the executed command:
"data": {
      "win": {
        "eventdata": {
          "originalFileName": "REGSVR32.EXE",
          "image": "C:\\\\Windows\\\\SysWOW64\\\\regsvr32.exe",
          "product": "Microsoft® Windows® Operating System",
          "parentProcessGuid": "{45cd4aff-35fc-6463-6903-000000001300}",
          "description": "Microsoft(C) Register Server",
          "logonGuid": "{45cd4aff-2ce5-6463-2543-290000000000}",
          "parentCommandLine": "C:\\\\Windows\\\\system32\\\\regsvr32.exe  /s /i C:\\\\AtomicRedTeam\\\\atomics\\\\T1218.010\\\\bin\\\\AllTheThingsx86.dll",
          "processGuid": "{45cd4aff-35fc-6463-6a03-000000001300}",
          "logonId": "0x294325",
          "parentProcessId": "7652",
          "processId": "4064",
          "currentDirectory": "C:\\\\Users\\\\THECOT~1\\\\AppData\\\\Local\\\\Temp\\\\",
          "utcTime": "2023-05-16 07:51:24.512",
          "hashes": "SHA1=8E2C6B7F92A560E0E856F8533D62A1B10797828F,MD5=5F7264BD237FAEA46FB240785B78AFAC,SHA256=D9BE711BE2BF88096BB91C25DF775D90B964264AB25EC49CF04711D8C1F089F6,IMPHASH=73F03653209E82368127EB826216A6AD",
          "parentImage": "C:\\\\Windows\\\\System32\\\\regsvr32.exe",
          "ruleName": "technique_id=T1117,technique_name=Regsvr32",
          "company": "Microsoft Corporation",
          "commandLine": "  /s /i C:\\\\AtomicRedTeam\\\\atomics\\\\T1218.010\\\\bin\\\\AllTheThingsx86.dll",
          "integrityLevel": "High",
          "fileVersion": "10.0.22621.1 (WinBuild.160101.0800)",
          "user": "Windows11\\\\Testuser",
          "terminalSessionId": "2",
          "parentUser": "Windows11\\\\Testuser"
        },
        "system": {
          "eventID": "1",
          "keywords": "0x8000000000000000",
          "providerGuid": "{5770385f-c22a-43e0-bf4c-06f5698ffbd9}",
          "level": "4",
          "channel": "Microsoft-Windows-Sysmon/Operational",
          "opcode": "0",
          "message": "\"Process Create:\r\nRuleName: technique_id=T1117,technique_name=Regsvr32\r\nUtcTime: 2023-05-16 07:51:24.512\r\nProcessGuid: {45cd4aff-35fc-6463-6a03-000000001300}\r\nProcessId: 4064\r\nImage: C:\\Windows\\SysWOW64\\regsvr32.exe\r\nFileVersion: 10.0.22621.1 (WinBuild.160101.0800)\r\nDescription: Microsoft(C) Register Server\r\nProduct: Microsoft® Windows® Operating System\r\nCompany: Microsoft Corporation\r\nOriginalFileName: REGSVR32.EXE\r\nCommandLine:   /s /i C:\\AtomicRedTeam\\atomics\\T1218.010\\bin\\AllTheThingsx86.dll\r\nCurrentDirectory: C:\\Users\\THECOT~1\\AppData\\Local\\Temp\\\r\nUser: Windows11\\Testuser\r\nLogonGuid: {45cd4aff-2ce5-6463-2543-290000000000}\r\nLogonId: 0x294325\r\nTerminalSessionId: 2\r\nIntegrityLevel: High\r\nHashes: SHA1=8E2C6B7F92A560E0E856F8533D62A1B10797828F,MD5=5F7264BD237FAEA46FB240785B78AFAC,SHA256=D9BE711BE2BF88096BB91C25DF775D90B964264AB25EC49CF04711D8C1F089F6,IMPHASH=73F03653209E82368127EB826216A6AD\r\nParentProcessGuid: {45cd4aff-35fc-6463-6903-000000001300}\r\nParentProcessId: 7652\r\nParentImage: C:\\Windows\\System32\\regsvr32.exe\r\nParentCommandLine: C:\\Windows\\system32\\regsvr32.exe  /s /i C:\\AtomicRedTeam\\atomics\\T1218.010\\bin\\AllTheThingsx86.dll\r\nParentUser: Windows11\\Testuser\"",
          "version": "5",
          "systemTime": "2023-05-16T07:51:24.5131006Z",
          "eventRecordID": "88509",
          "threadID": "3960",
          "computer": "Windows11",
          "task": "1",
          "processID": "3156",
          "severityValue": "INFORMATION",
          "providerName": "Microsoft-Windows-Sysmon"
        }
      }
    },
Carrying out further investigations on other related events, you can see a process injection event created by the
regsvr32utility and the image loaded:"data": { "win": { "eventdata": { "originalFileName": "mscoree.dll", "image": "C:\\\\Windows\\\\SysWOW64\\\\regsvr32.exe", "product": "Microsoft® Windows® Operating System", "signature": "Microsoft Windows", "imageLoaded": "C:\\\\Windows\\\\SysWOW64\\\\mscoree.dll", "description": "Microsoft .NET Runtime Execution Engine", "signed": "true", "signatureStatus": "Valid", "processGuid": "{45cd4aff-35fc-6463-6a03-000000001300}", "processId": "4064", "utcTime": "2023-05-16 07:51:24.774", "hashes": "SHA1=52A6AB3E468C4956C00707DF80C7609EEE74D9AD,MD5=BEE4D173DA78E4D3AC9B54A95C6A464A,SHA256=36B0BA10BBB6575CA4A4CBDE585F6E19B86B3A80014B3C3D8335F861D8AEBFAB,IMPHASH=47F306C12509ADBBC266F7DA43529A4D", "ruleName": "technique_id=T1055,technique_name=Process Injection", "company": "Microsoft Corporation", "fileVersion": "10.0.22621.1 (WinBuild.160101.0800)", "user": "Windows11\\\\Testuser" }, "system": { "eventID": "7", "keywords": "0x8000000000000000", "providerGuid": "{5770385f-c22a-43e0-bf4c-06f5698ffbd9}", "level": "4", "channel": "Microsoft-Windows-Sysmon/Operational", "opcode": "0", "message": "\"Image loaded:\r\nRuleName: technique_id=T1055,technique_name=Process Injection\r\nUtcTime: 2023-05-16 07:51:24.774\r\nProcessGuid: {45cd4aff-35fc-6463-6a03-000000001300}\r\nProcessId: 4064\r\nImage: C:\\Windows\\SysWOW64\\regsvr32.exe\r\nImageLoaded: C:\\Windows\\SysWOW64\\mscoree.dll\r\nFileVersion: 10.0.22621.1 (WinBuild.160101.0800)\r\nDescription: Microsoft .NET Runtime Execution Engine\r\nProduct: Microsoft® Windows® Operating System\r\nCompany: Microsoft Corporation\r\nOriginalFileName: mscoree.dll\r\nHashes: SHA1=52A6AB3E468C4956C00707DF80C7609EEE74D9AD,MD5=BEE4D173DA78E4D3AC9B54A95C6A464A,SHA256=36B0BA10BBB6575CA4A4CBDE585F6E19B86B3A80014B3C3D8335F861D8AEBFAB,IMPHASH=47F306C12509ADBBC266F7DA43529A4D\r\nSigned: true\r\nSignature: Microsoft Windows\r\nSignatureStatus: Valid\r\nUser: Windows11\\Testuser\"", "version": "3", "systemTime": "2023-05-16T07:51:24.7768916Z", "eventRecordID": "88510", "threadID": "3960", "computer": "Windows11", "task": "7", "processID": "3156", "severityValue": "INFORMATION", "providerName": "Microsoft-Windows-Sysmon" } } },
Apply the
data.win.eventdata.ruleName:technique_id=T1218.010,technique_name=Regsvr32filter to see the technique ID as shown below.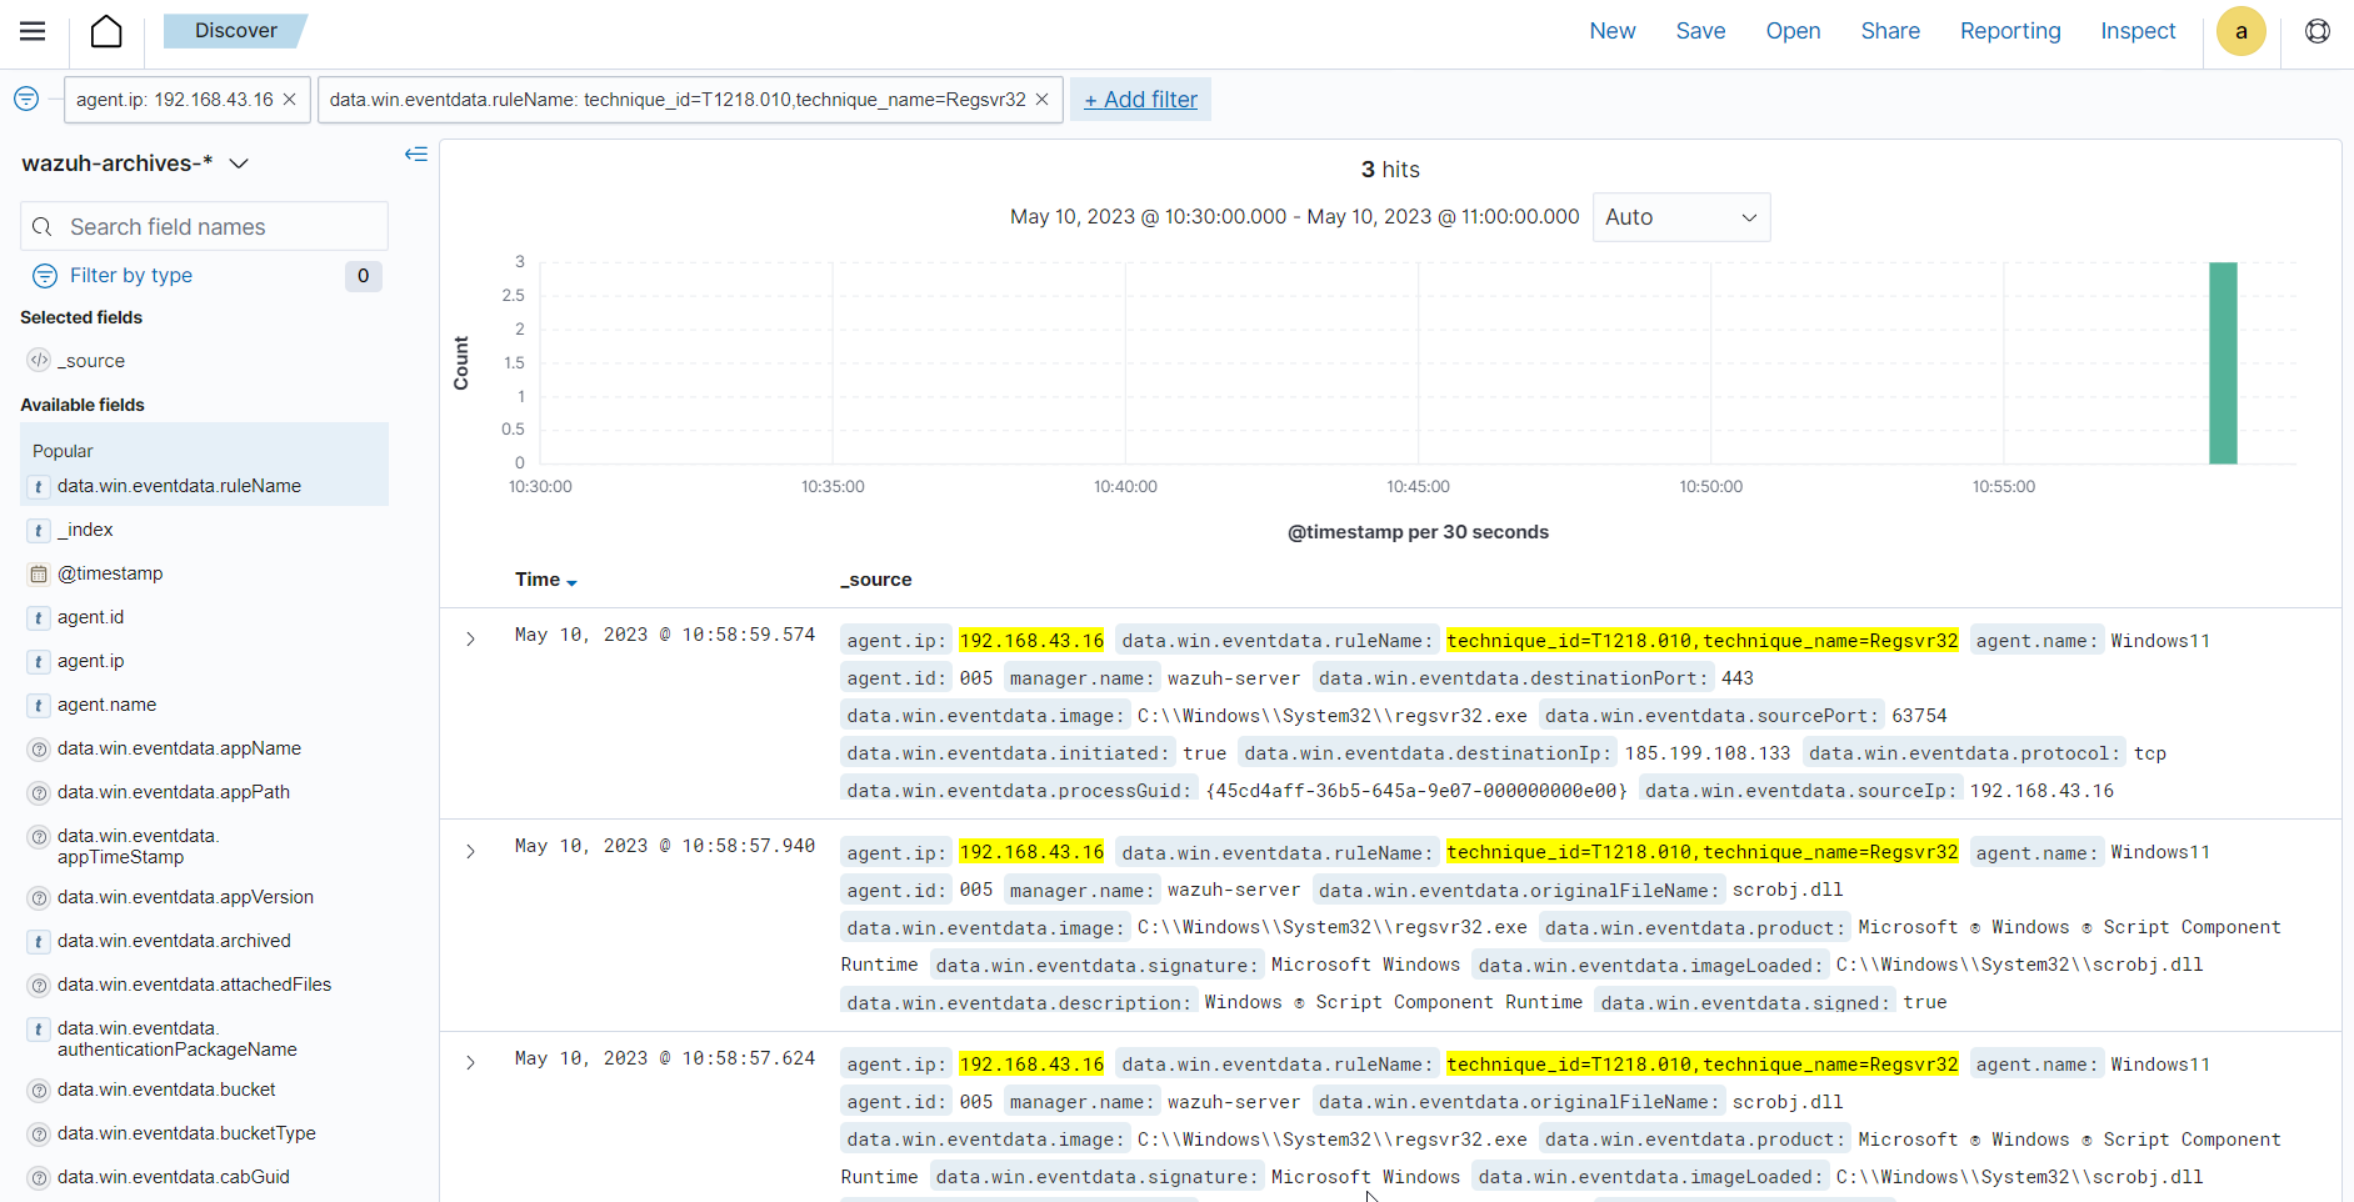
Expand the event to view its associated fields.
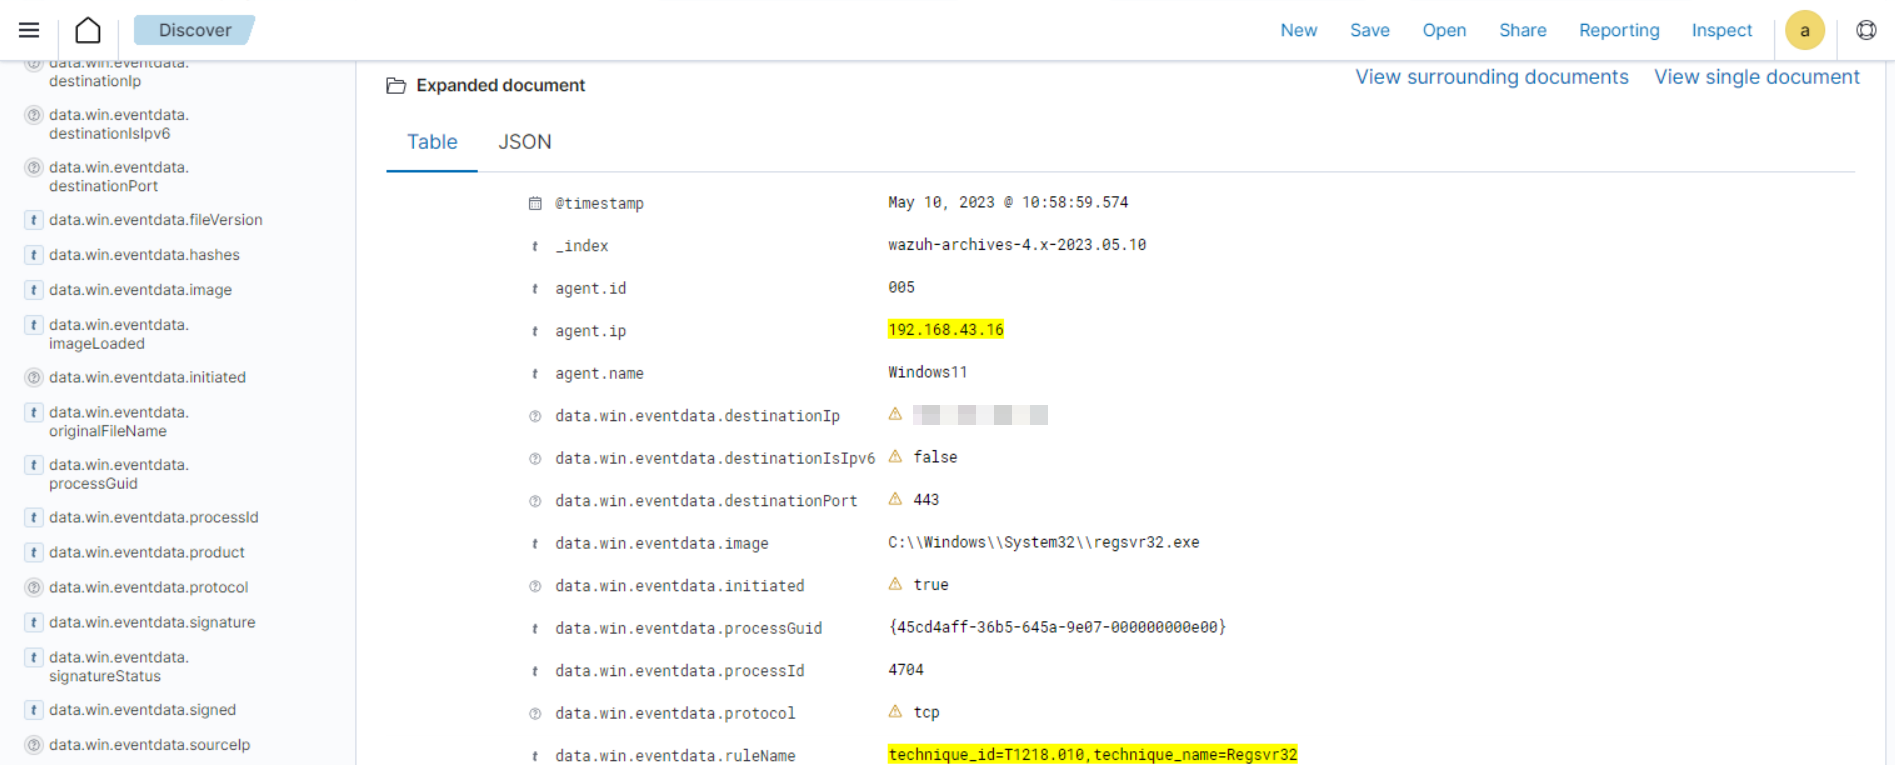
Click on the JSON tab to view the JSON format of the archived logs.
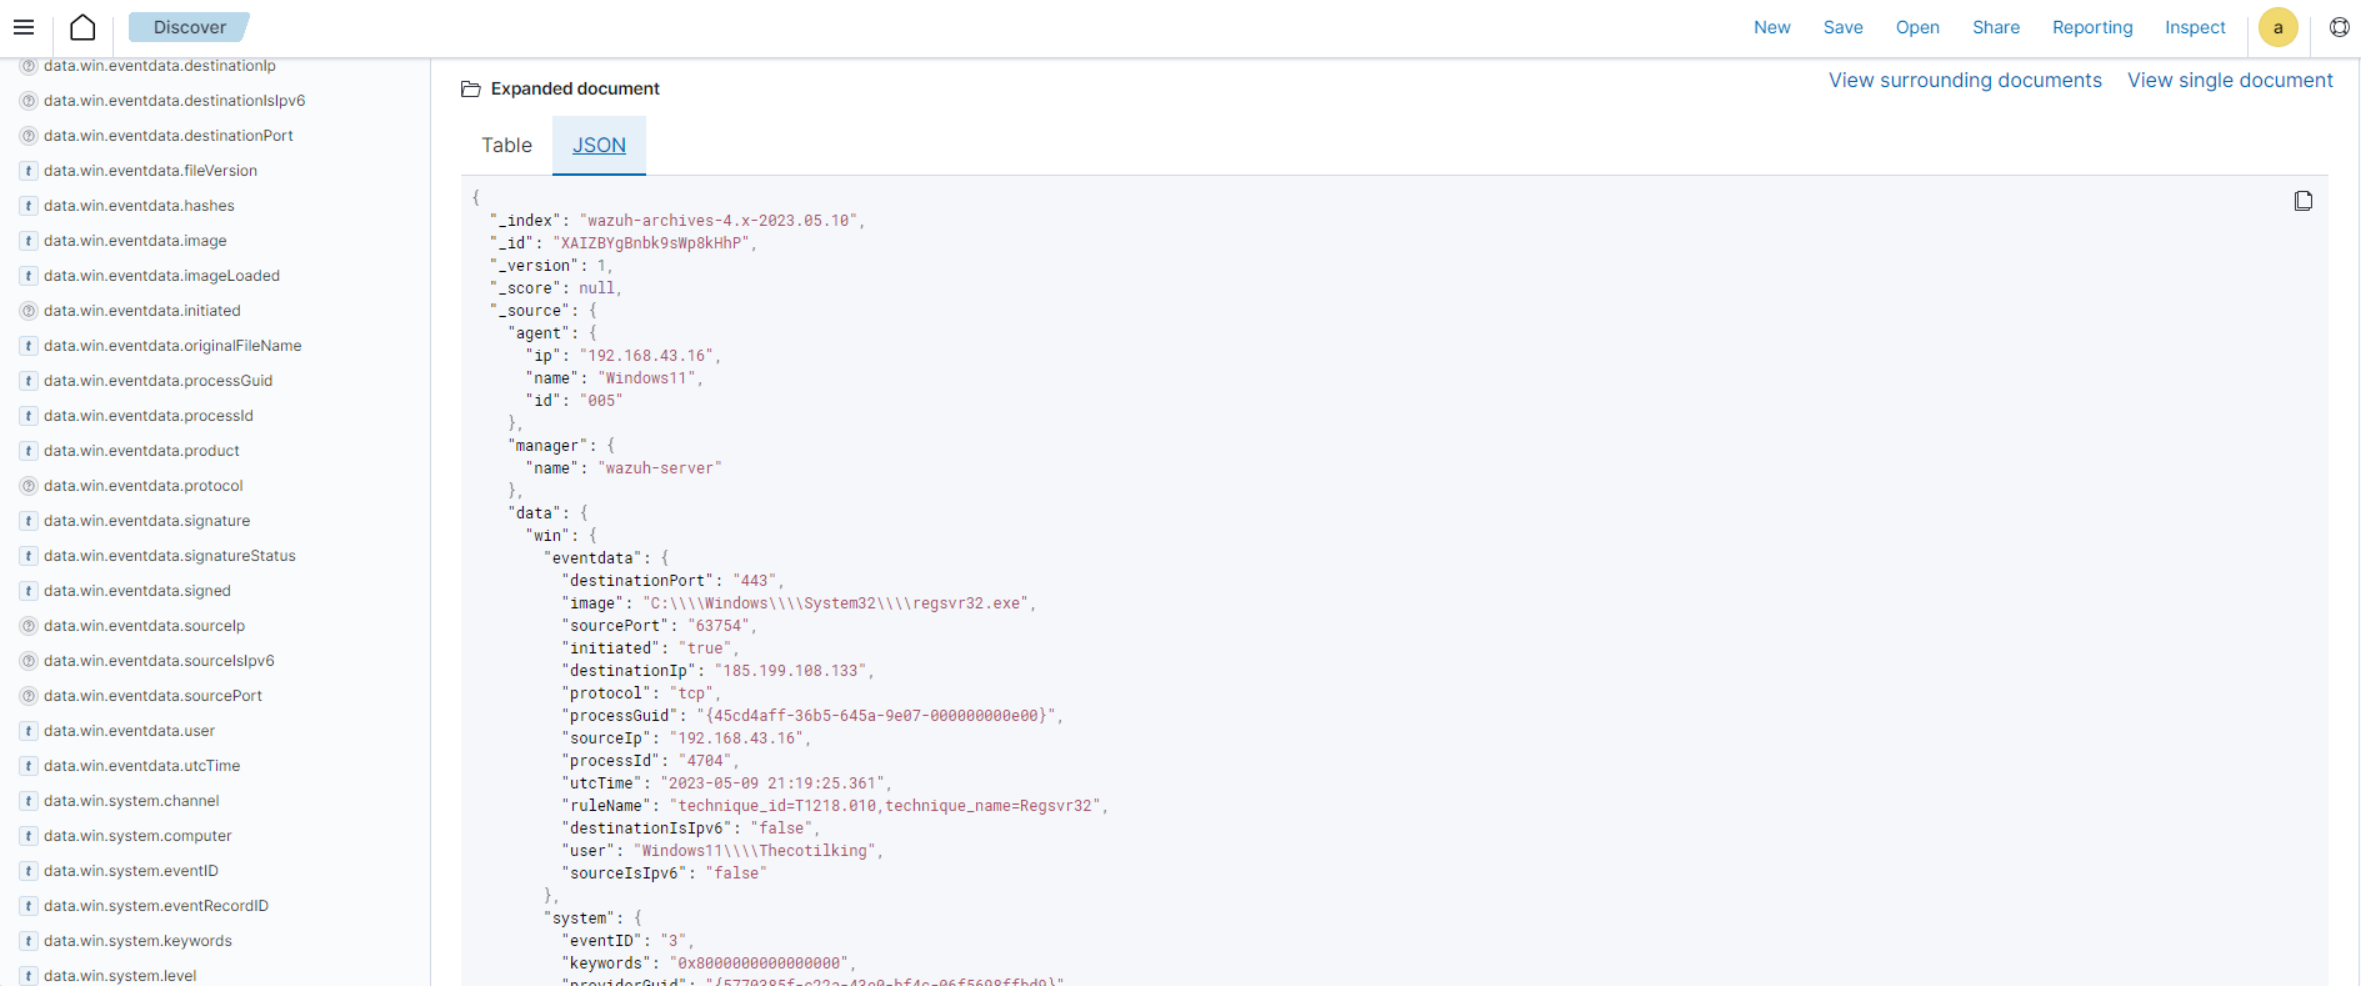
From the below log, you can extract more structured details which makes it easier to analyze the event:
"data": {
      "win": {
        "eventdata": {
          "destinationPort": "443",
          "image": "C:\\\\Windows\\\\System32\\\\regsvr32.exe",
          "sourcePort": "63754",
          "initiated": "true",
          "destinationIp": "1.1.123.23",
          "protocol": "tcp",
          "processGuid": "{45cd4aff-36b5-645a-9e07-000000000e00}",
          "sourceIp": "192.168.43.16",
          "processId": "4704",
          "utcTime": "2023-05-09 21:19:25.361",
          "ruleName": "technique_id=T1218.010,technique_name=Regsvr32",
          "destinationIsIpv6": "false",
          "user": "Windows11\\\\Testuser",
          "sourceIsIpv6": "false"
        },
        "system": {
          "eventID": "3",
          "keywords": "0x8000000000000000",
          "providerGuid": "{5770385f-c22a-43e0-bf4c-06f5698ffbd9}",
          "level": "4",
          "channel": "Microsoft-Windows-Sysmon/Operational",
          "opcode": "0",
          "message": "\"Network connection detected:\r\nRuleName: technique_id=T1218.010,technique_name=Regsvr32\r\nUtcTime: 2023-05-09 21:19:25.361\r\nProcessGuid: {45cd4aff-36b5-645a-9e07-000000000e00}\r\nProcessId: 4704\r\nImage: C:\\Windows\\System32\\regsvr32.exe\r\nUser: Windows11\\Testuser\r\nProtocol: tcp\r\nInitiated: true\r\nSourceIsIpv6: false\r\nSourceIp: 192.168.43.16\r\nSourceHostname: -\r\nSourcePort: 63754\r\nSourcePortName: -\r\nDestinationIsIpv6: false\r\nDestinationIp: 185.199.108.133\r\nDestinationHostname: -\r\nDestinationPort: 443\r\nDestinationPortName: -\"",
          "version": "5",
          "systemTime": "2023-05-09T12:04:07.0231156Z",
          "eventRecordID": "63350",
          "threadID": "3096",
          "computer": "Windows11",
          "task": "3",
          "processID": "3156",
          "severityValue": "INFORMATION",
          "providerName": "Microsoft-Windows-Sysmon"
        }
      }
    },
You can use events from the Wazuh archives to develop detection logic and write custom decoders and rules. You can use the out-of-the-box wazuh-logtest tool to test and verify rules against provided logs. For more information, see the Custom rules and decoders and the wazuh-logtest documentation.