Wazuh dashboard
The Wazuh dashboard is a flexible and intuitive web interface for visualizing security data. It queries the Wazuh indexer to visualize alerts, events, and security analytics. It enables users to perform the following tasks.
Investigate events and alerts.
Configure the Wazuh manager and Wazuh indexer.
Enforce role-based access control (RBAC) and single sign-on (SSO).
Manage Wazuh agents and enrollment workflows.
Health checks, notifications, and alerting integrations.
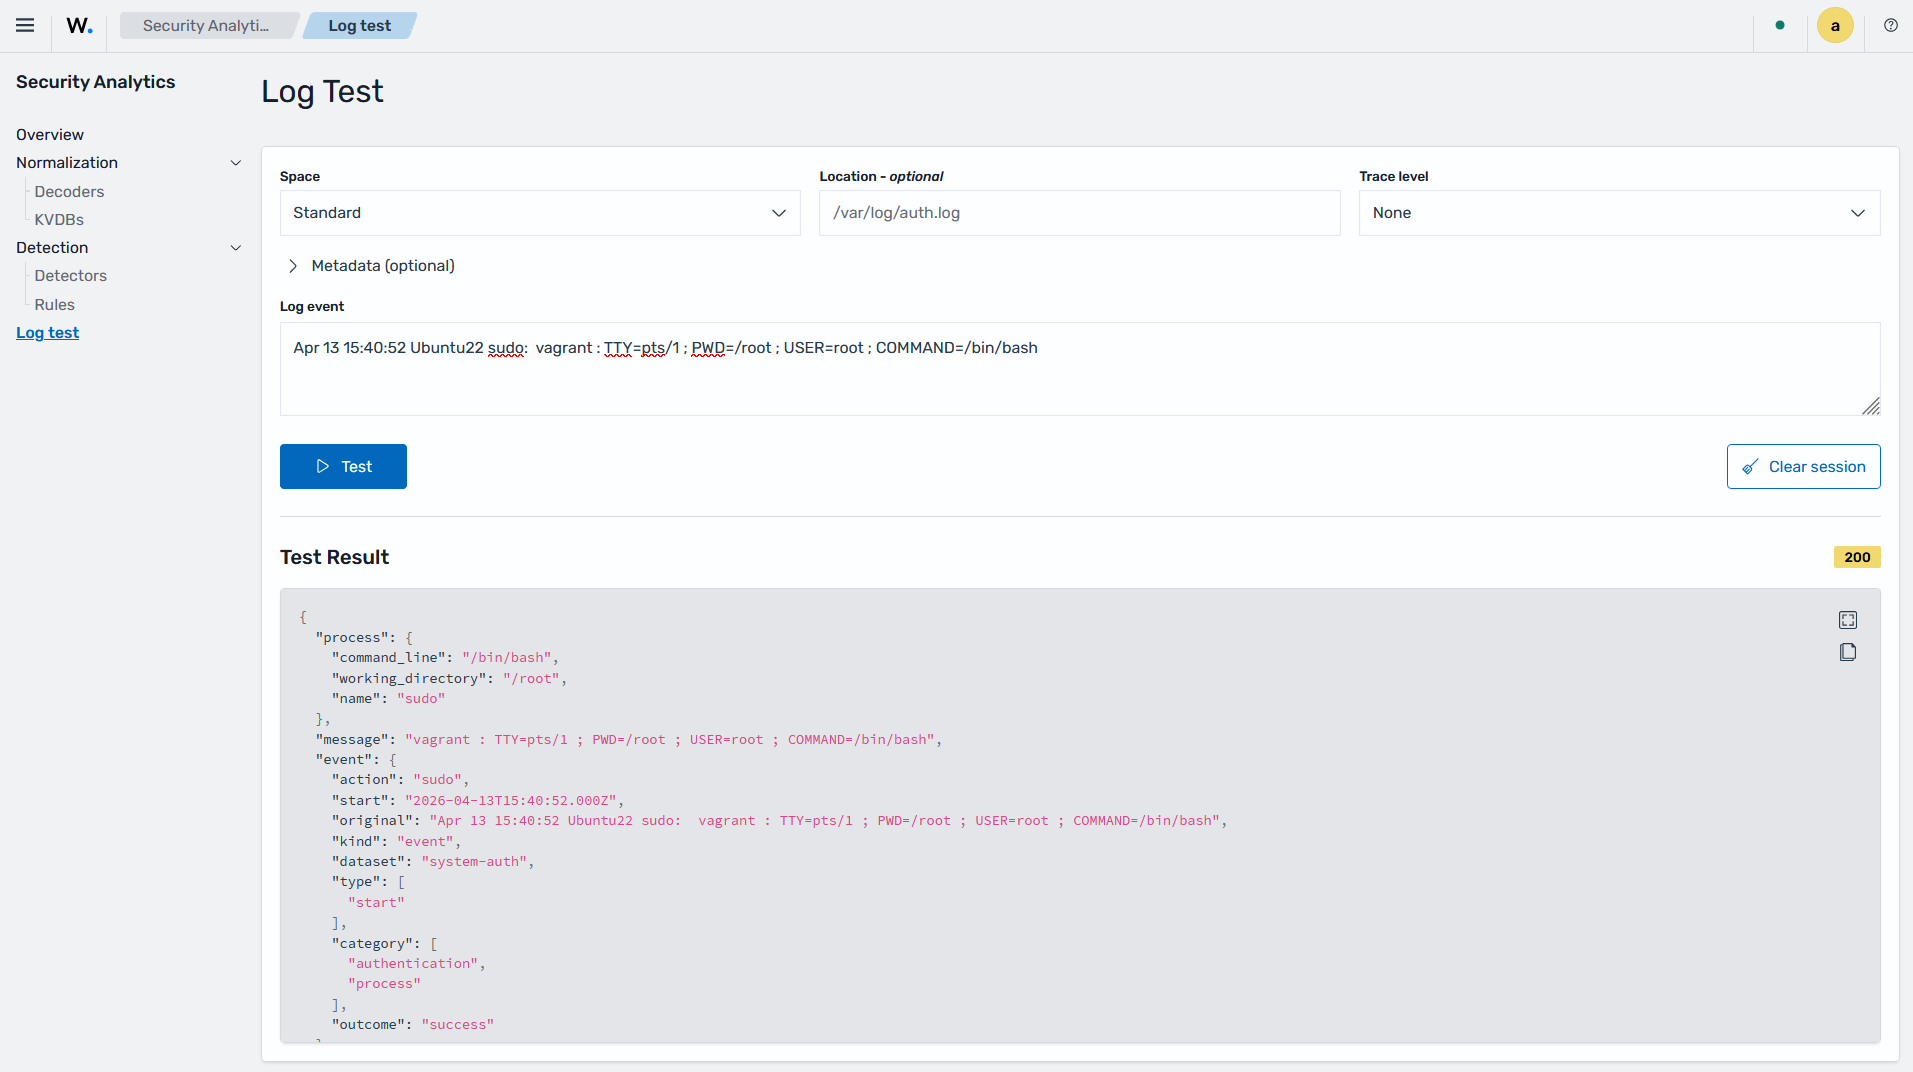
Test custom rules and decoders (Developer tools).
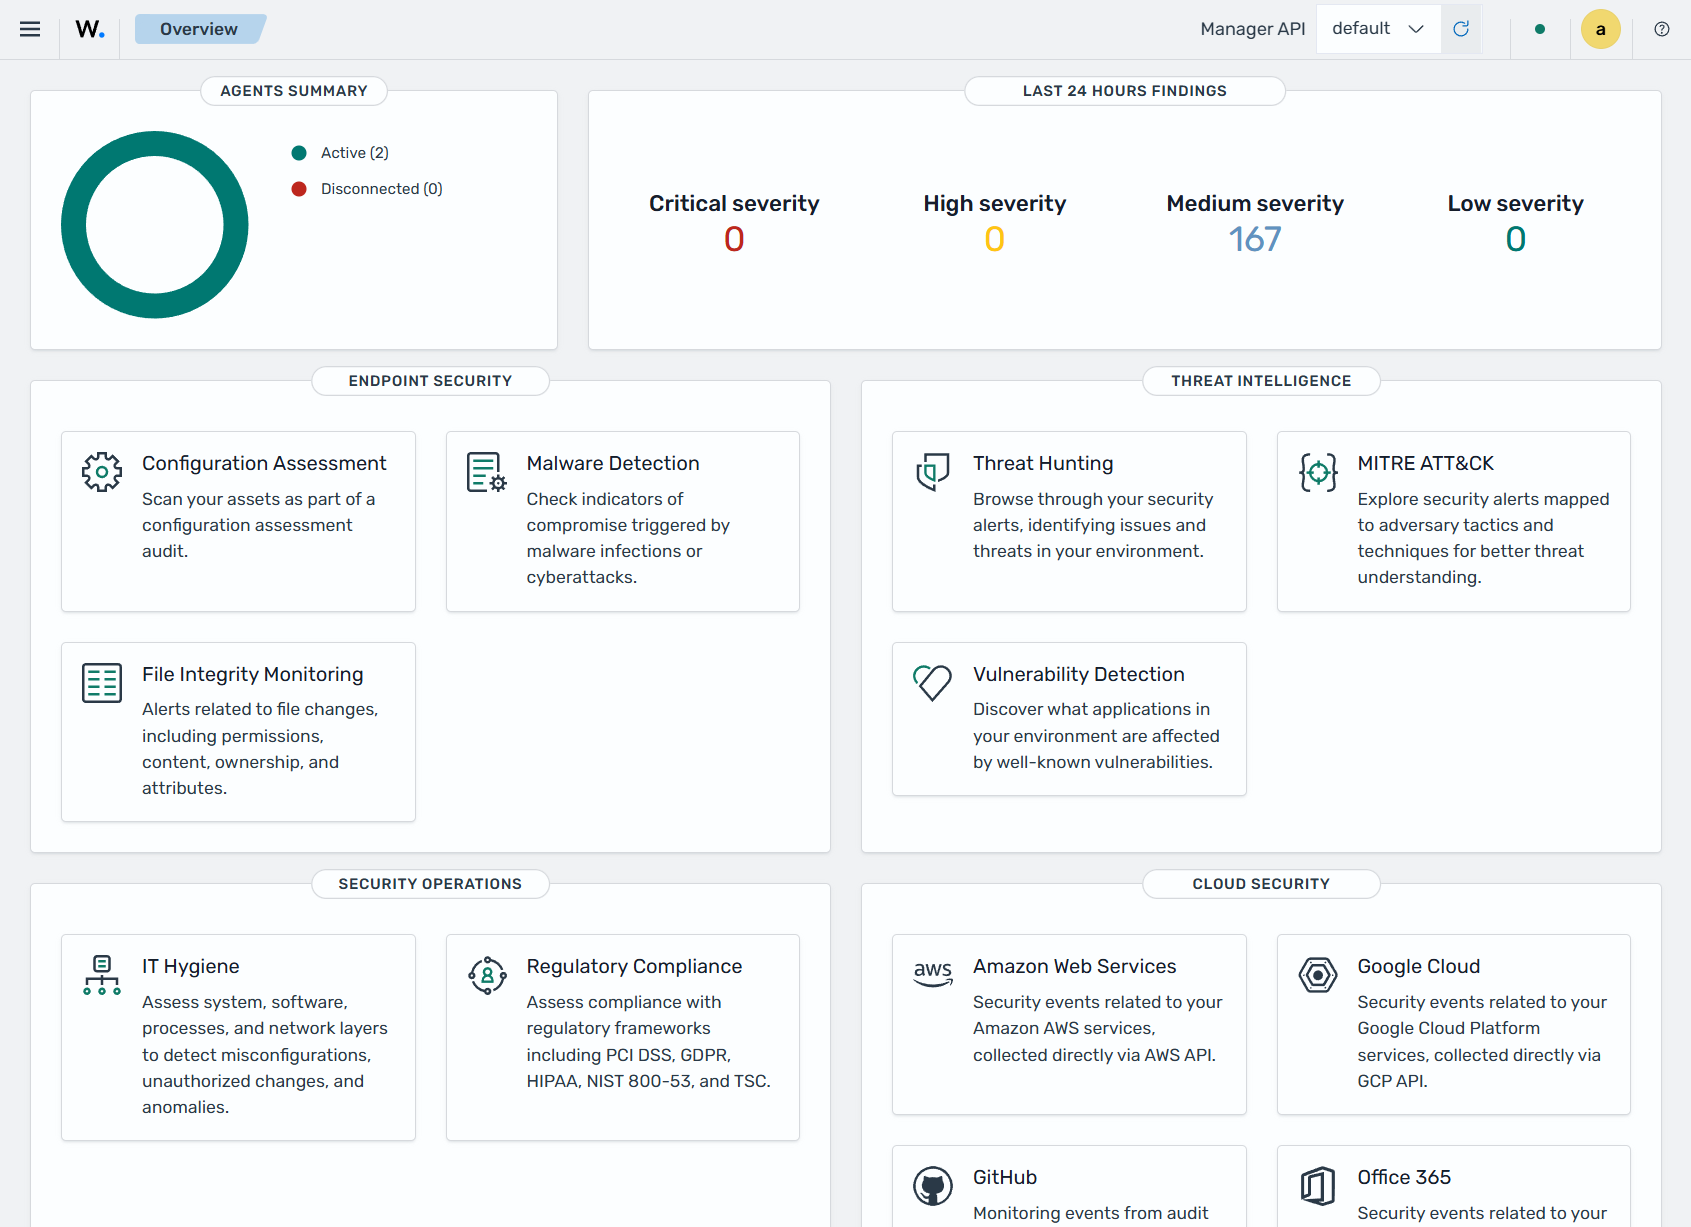
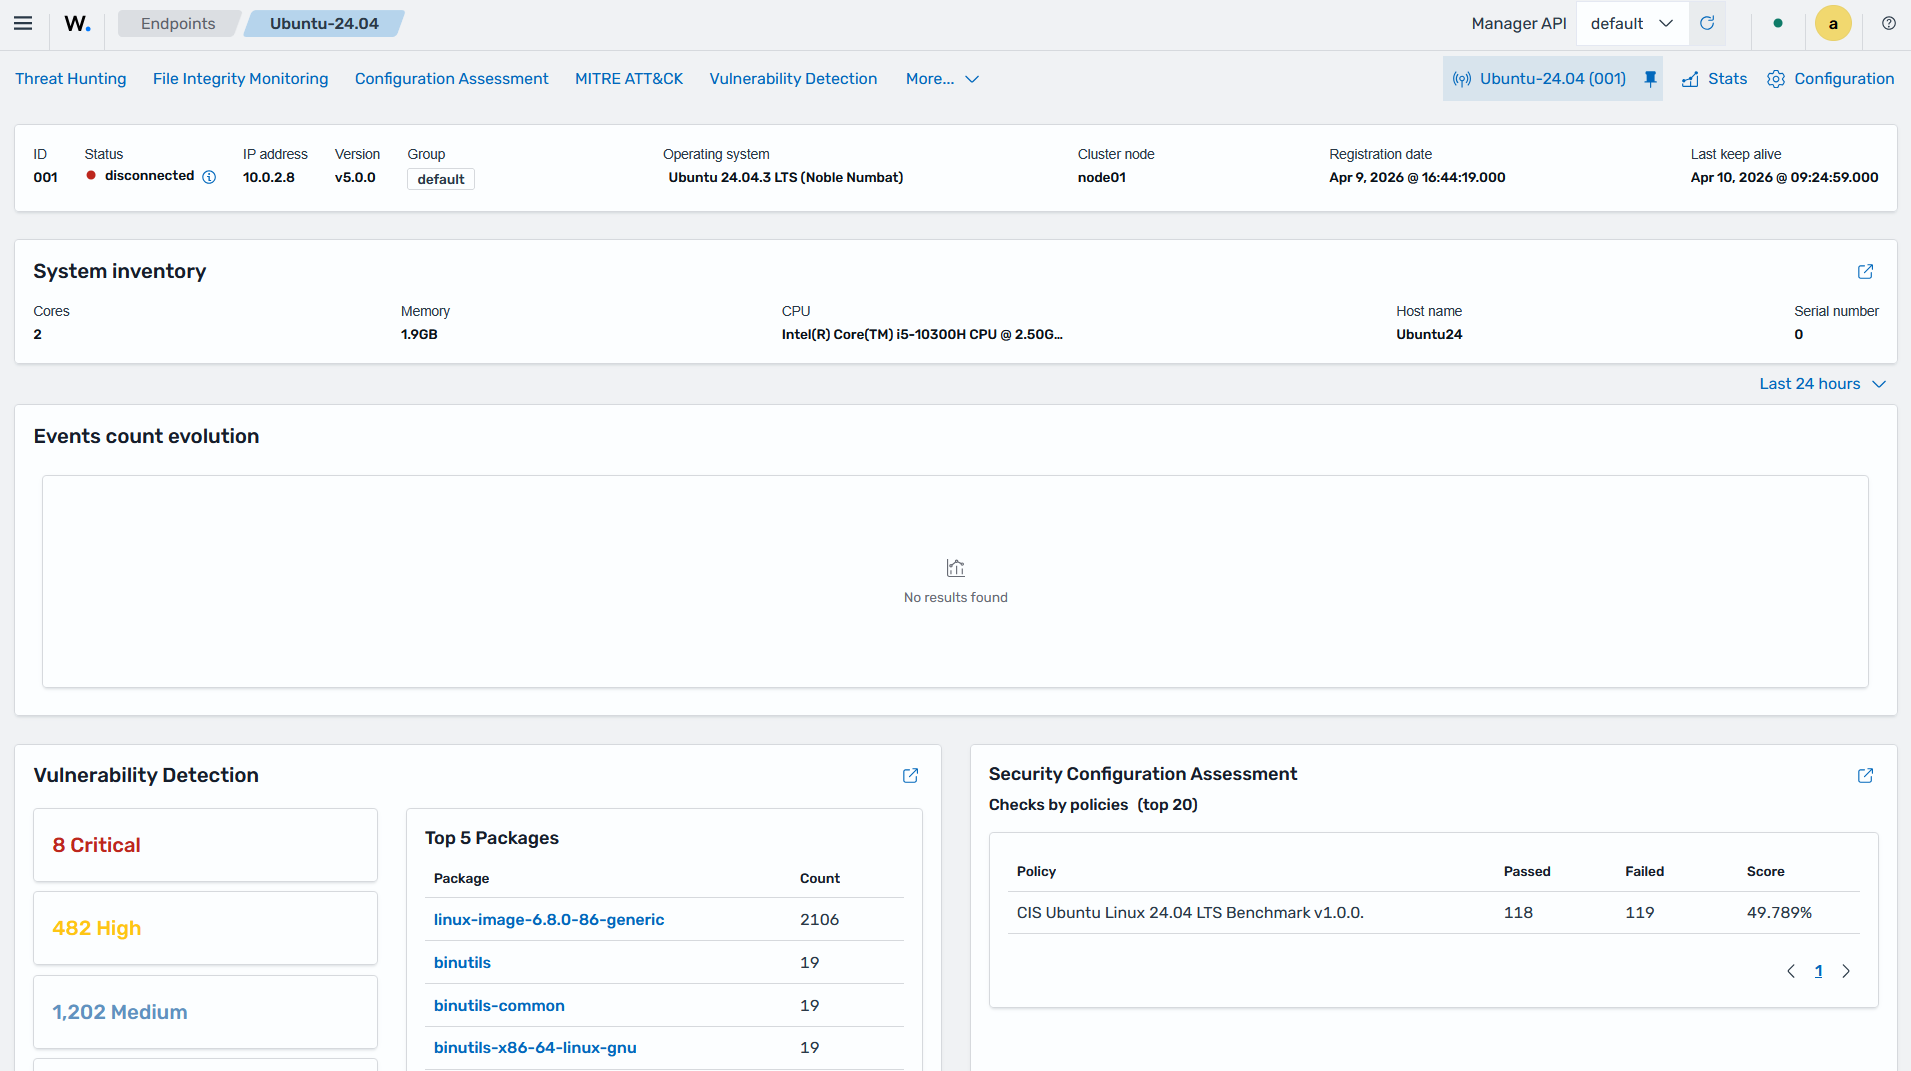
Data visualization and analysis
The Wazuh dashboard enables users to navigate security data collected from Wazuh agents and agentless devices. It includes dashboards for configuration assessment, threat hunting, malware detection, file integrity monitoring, IT hygiene, and regulatory compliance (for example, PCI DSS, GDPR, HIPAA, and NIST 800-53), among others. You can generate reports and create custom visualizations and dashboards.
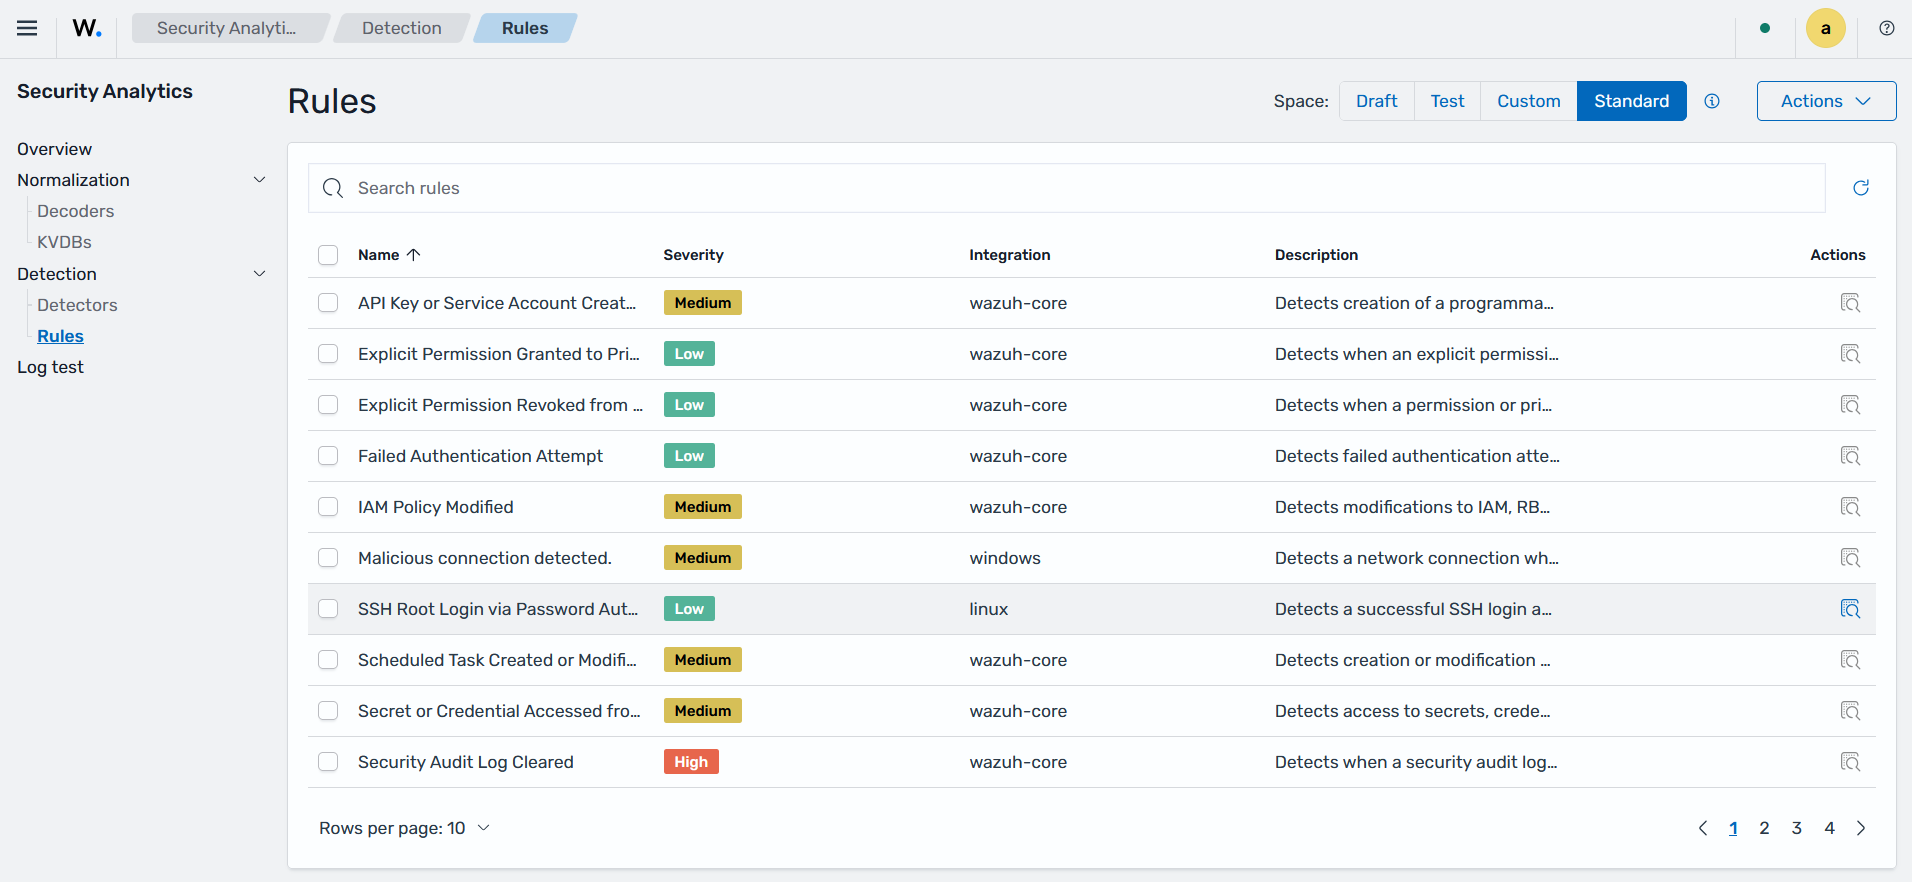
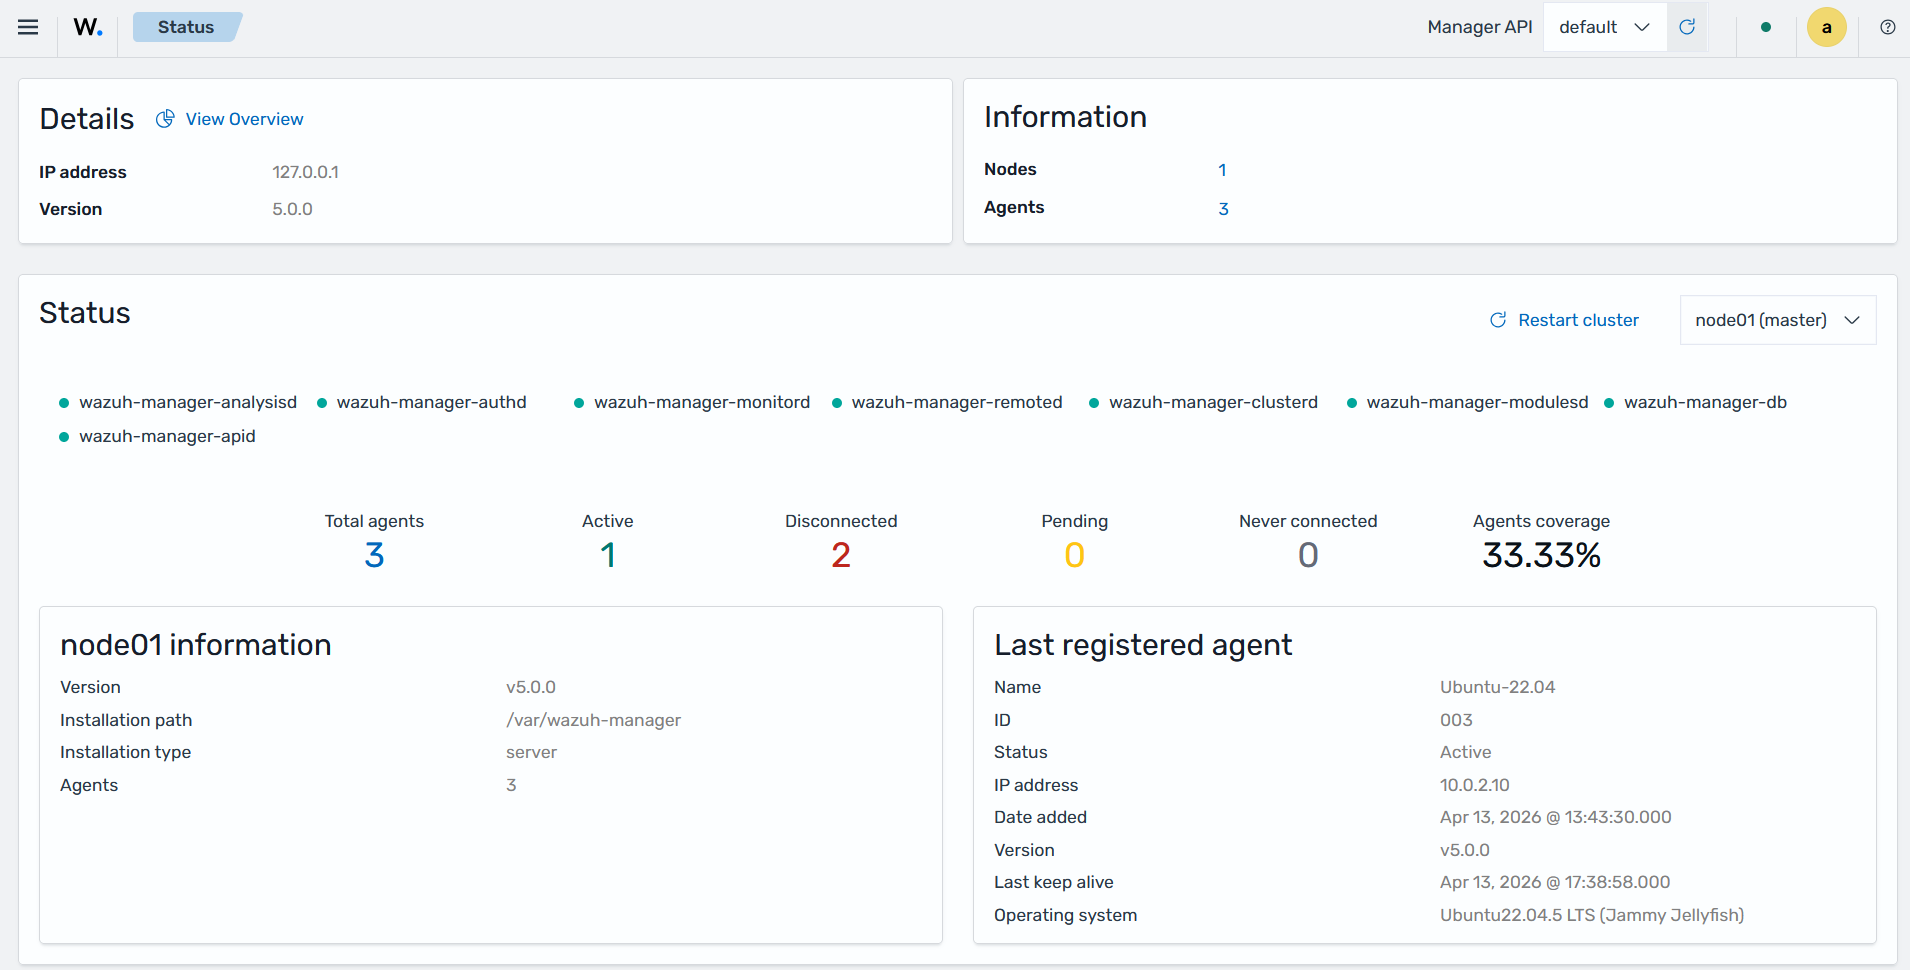
Wazuh manager and Wazuh indexer management
The Wazuh dashboard provides a user interface to manage a Wazuh deployment. This includes monitoring the status, logs, and statistics of Wazuh components, configuring the Wazuh manager, and creating custom rules and decoders for log analysis and threat detection.
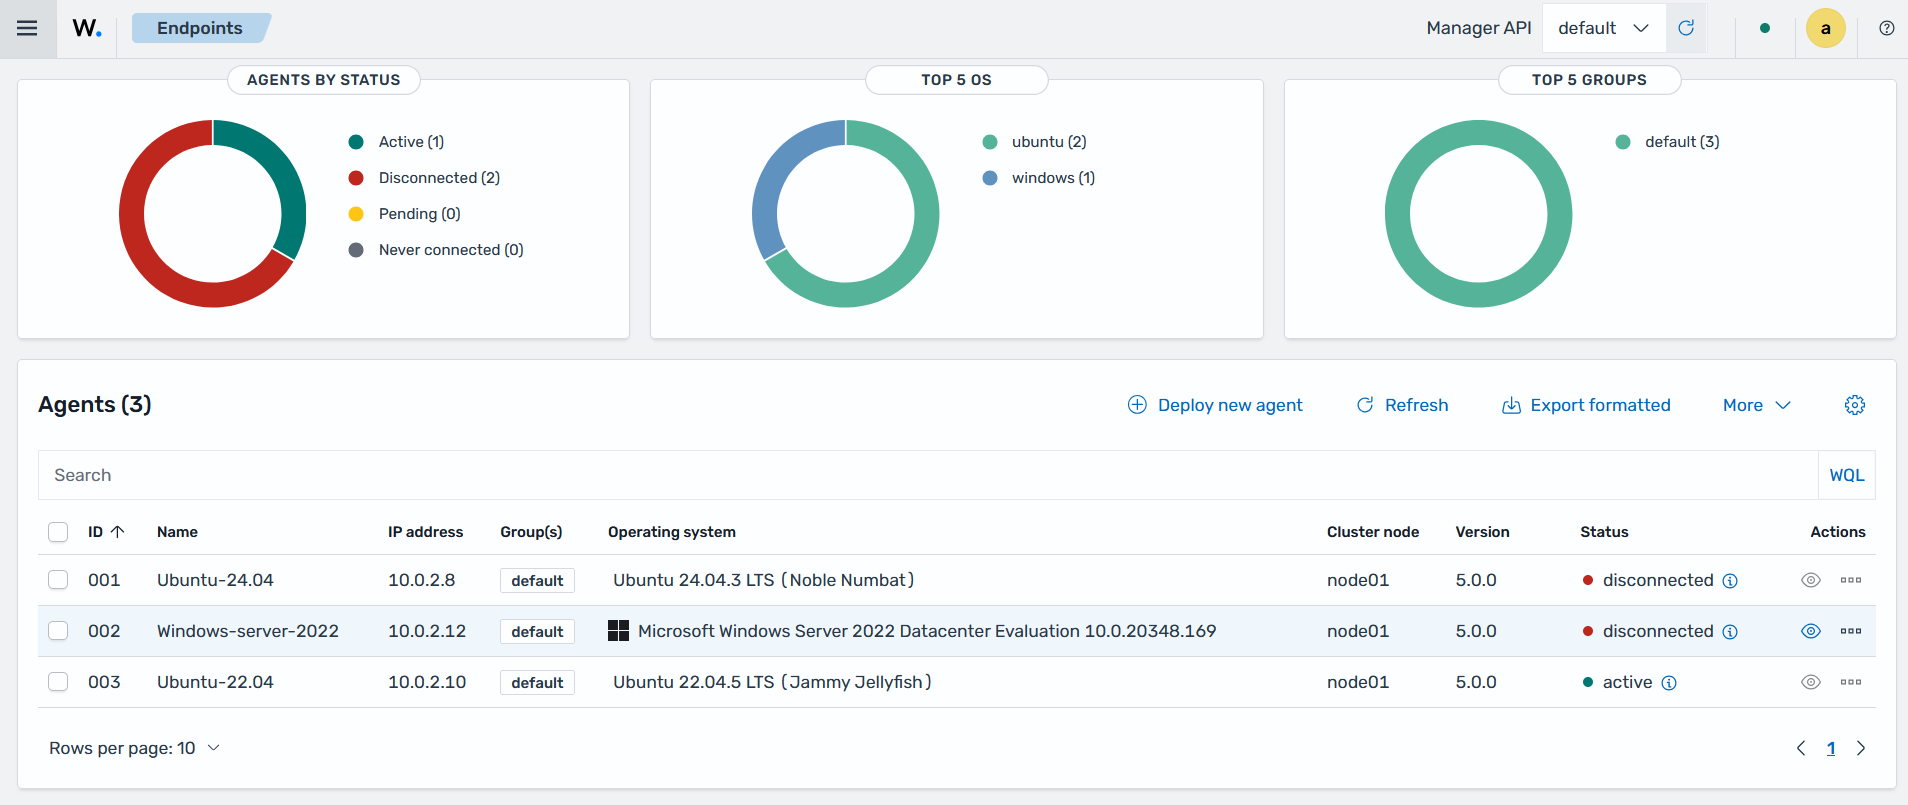
Wazuh agents management
The Wazuh dashboard allows users to manage Wazuh agents in several ways including:
Deployment and registration
Centralized configuration
Grouping Wazuh agents
Monitoring and troubleshooting Wazuh agent status
Wazuh agent upgrades
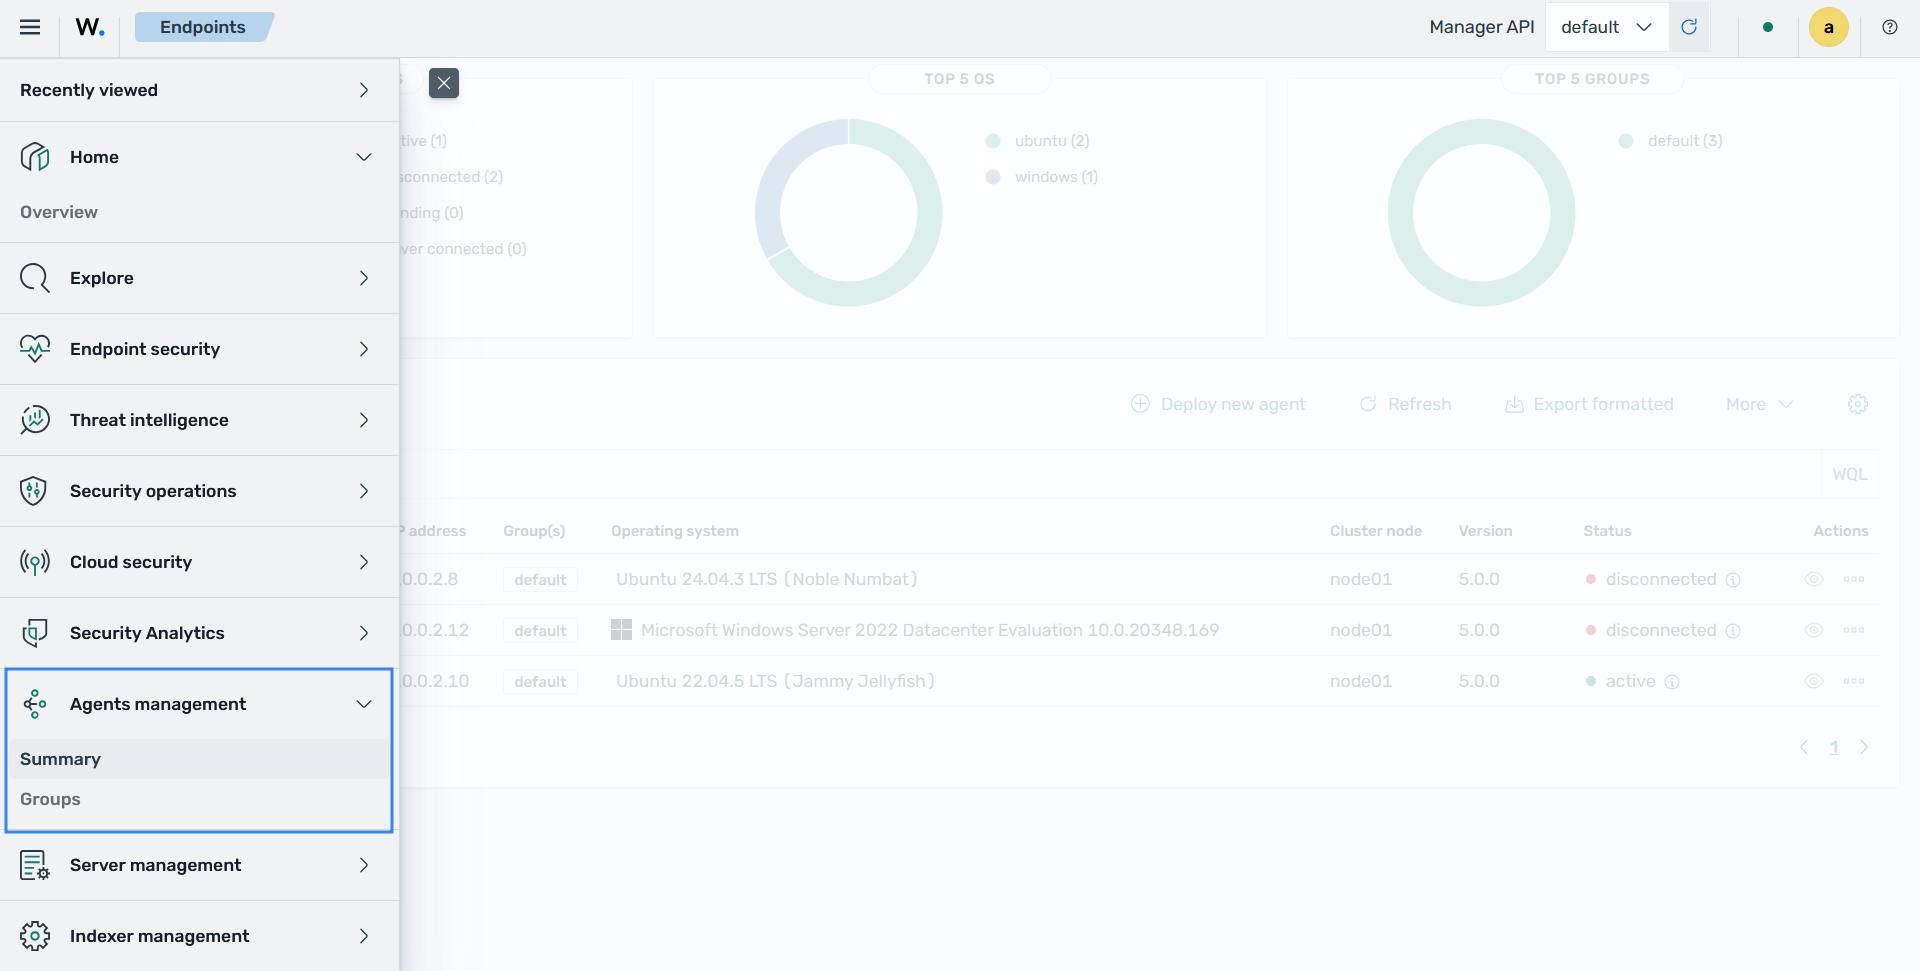
For each monitored endpoint, users can define which Wazuh agent modules are enabled, which log files are read, which files are monitored for integrity changes, and which configuration checks are performed.
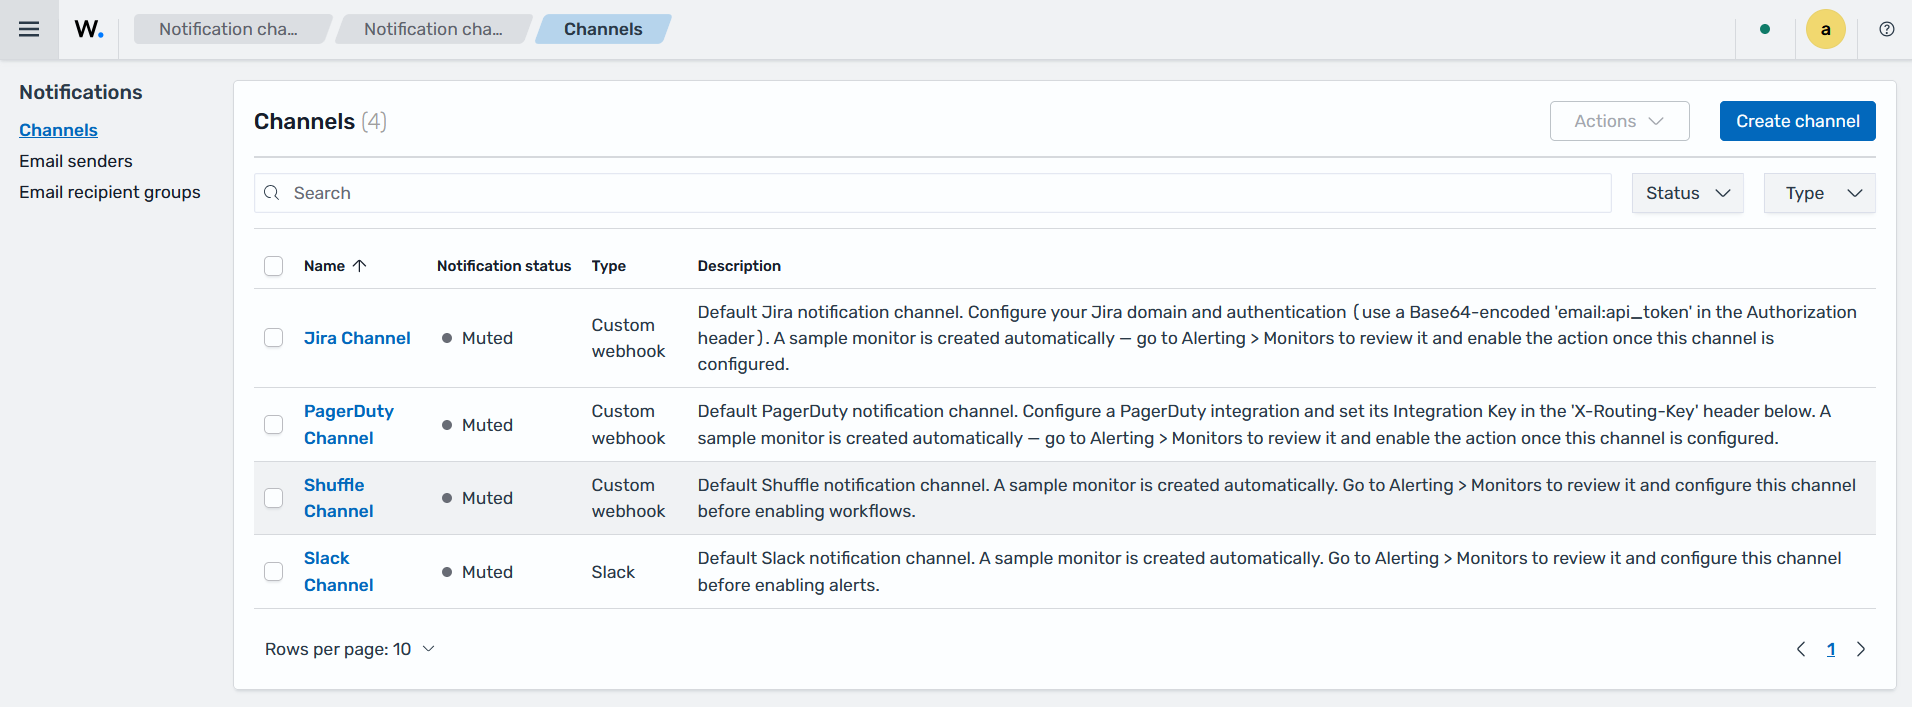
Health checks, notifications and alerting integrations
The Wazuh dashboard provides the ability to monitor performance and cluster health of the Wazuh components.
The Wazuh dashboard provides the ability to integrate external APIs and services for enhanced alerting, incident management, and threat intelligence capabilities. It supports integration with Slack, PagerDuty, Shuffle, and others.
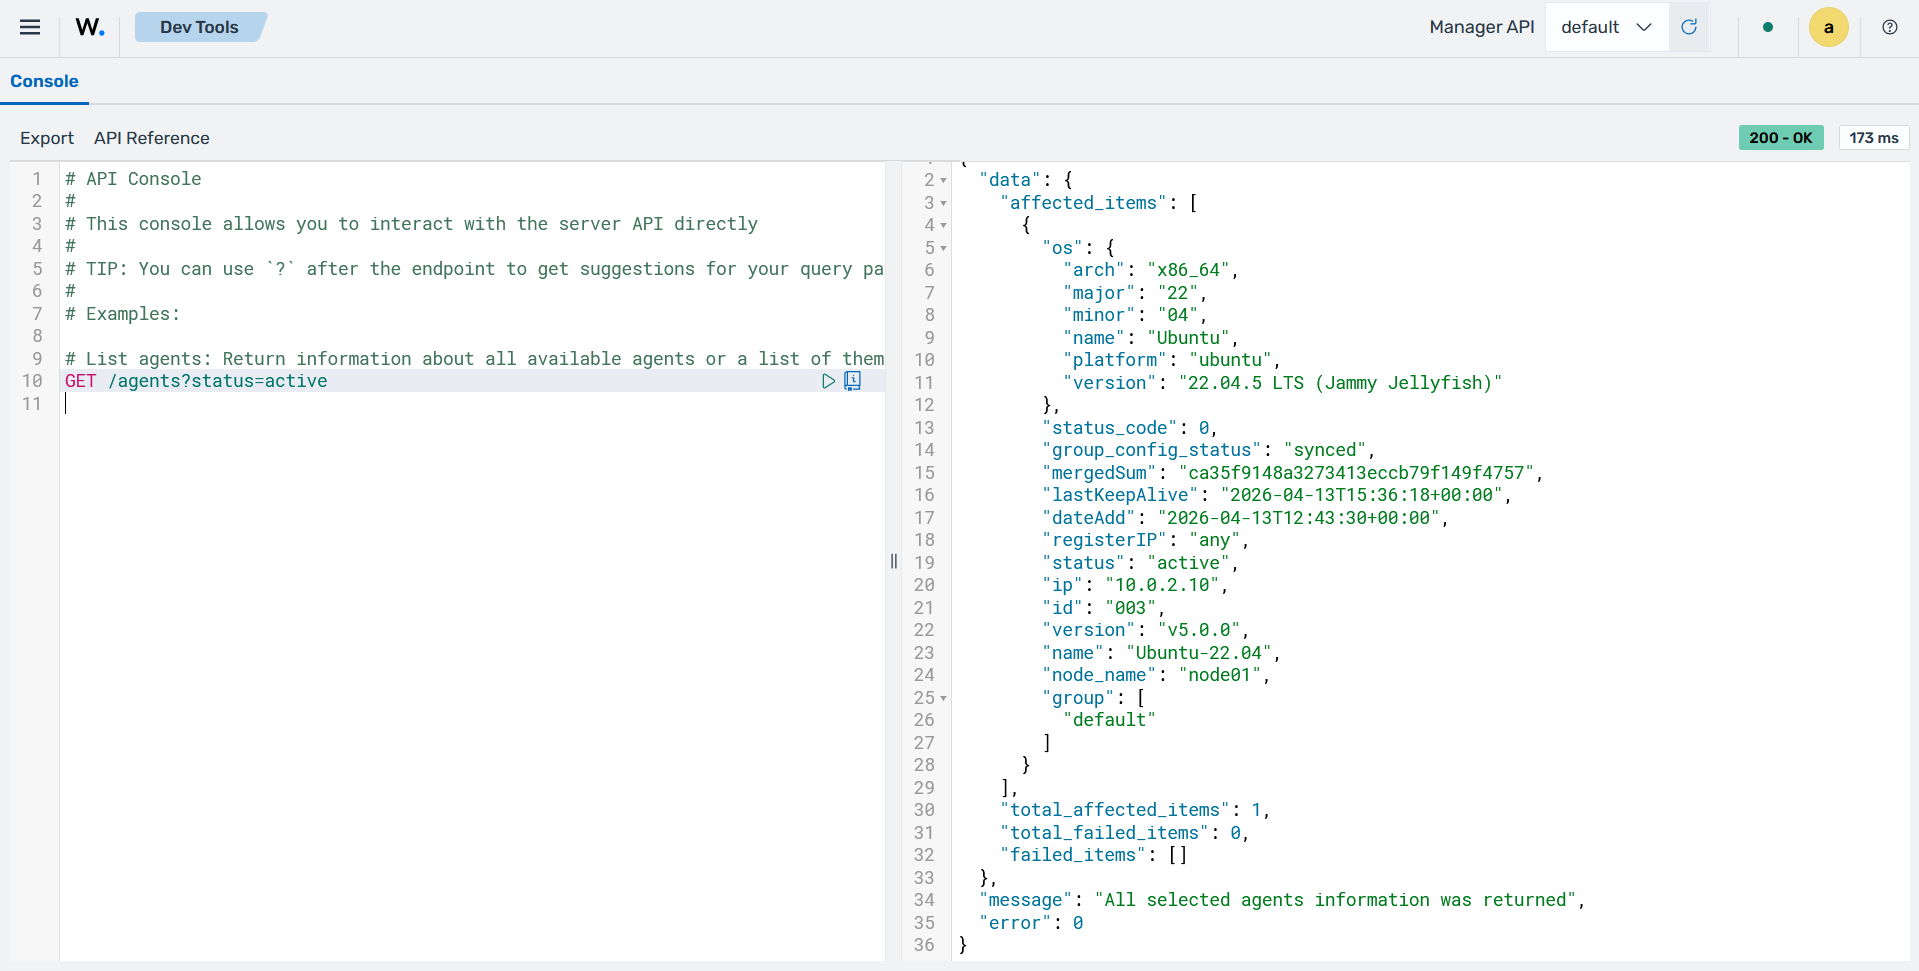
Developer tools
The Wazuh dashboard includes a ruleset testing tool (Log Test) that processes log messages to show how they are decoded by the Wazuh normalization engine and whether they match a detection rule. This tool is useful for testing custom decoders and rules.
The Wazuh dashboard also provides API consoles for interacting with the Wazuh manager API and the Wazuh indexer API. These consoles are used to manage Wazuh manager capabilities and interact with Wazuh indexer indices.