Network IDS integration
Wazuh integrates with a network-based intrusion detection system (NIDS) to enhance threat detection by monitoring and analyzing network traffic.
In this use case, we demonstrate how to integrate Suricata with Wazuh. Suricata can provide additional insights into your network's security with its network traffic inspection capabilities.
Infrastructure
Endpoint |
Description |
|---|---|
Ubuntu 24.04 |
This is the endpoint where you install Suricata. In this use case, Wazuh monitors and analyzes the network traffic generated on this endpoint. |
Configuration
Take the following steps to configure Suricata on the Ubuntu endpoint and send the generated logs to the Wazuh manager.
Install Suricata on the Ubuntu endpoint. We tested this process with version 8.0.6:
$ sudo add-apt-repository ppa:oisf/suricata-stable
$ sudo apt-get update
$ sudo apt-get install suricata -y
Download and extract the Emerging Threats Suricata ruleset:
$ cd /tmp/ && curl -LO https://rules.emergingthreats.net/open/suricata-6.0.8/emerging.rules.tar.gz
$ sudo tar -xvzf emerging.rules.tar.gz && sudo mkdir /etc/suricata/rules && sudo mv rules/*.rules /etc/suricata/rules/
$ sudo chown root:suricata /etc/suricata/rules/*.rules
$ sudo chmod 664 /etc/suricata/rules/*.rules
Modify Suricata settings in the
/etc/suricata/suricata.yamlfile and set the following variables:HOME_NET: "<UBUNTU_IP>" EXTERNAL_NET: "any" default-rule-path: /etc/suricata/rules rule-files: - "*.rules" # Global stats configuration stats: enabled: yes # Linux high speed capture support af-packet: - interface: enp0s3
interfacerepresents the network interface you want to monitor. Replace the value with the interface name of the Ubuntu endpoint. For example,enp0s3.# ifconfigenp0s3: flags=4163<UP,BROADCAST,RUNNING,MULTICAST> mtu 1500 inet 10.0.2.15 netmask 255.255.255.0 broadcast 10.0.2.255 inet6 fe80::9ba2:9de3:57ad:64e5 prefixlen 64 scopeid 0x20<link> ether 08:00:27:14:65:bd txqueuelen 1000 (Ethernet) RX packets 6704315 bytes 1268472541 (1.1 GiB) RX errors 0 dropped 0 overruns 0 frame 0 TX packets 4590192 bytes 569730548 (543.3 MiB) TX errors 0 dropped 0 overruns 0 carrier 0 collisions 0Restart the Suricata service:
# sudo systemctl restart suricata
Add the following configuration to the
/var/ossec/etc/ossec.conffile of the Wazuh agent. This allows the Wazuh agent to read the Suricata logs file:<ossec_config> <localfile> <log_format>json</log_format> <location>/var/log/suricata/eve.json</location> </localfile> </ossec_config>
Restart the Wazuh agent to apply the changes:
$ sudo systemctl restart wazuh-agent
Attack emulation
Wazuh automatically parses data from /var/log/suricata/eve.json and generates related alerts on the Wazuh dashboard.
Run the command below on the Ubuntu endpoint to simulate malicious traffic:
$ curl -s http://testmynids.org/uid/index.html
Visualize the alerts
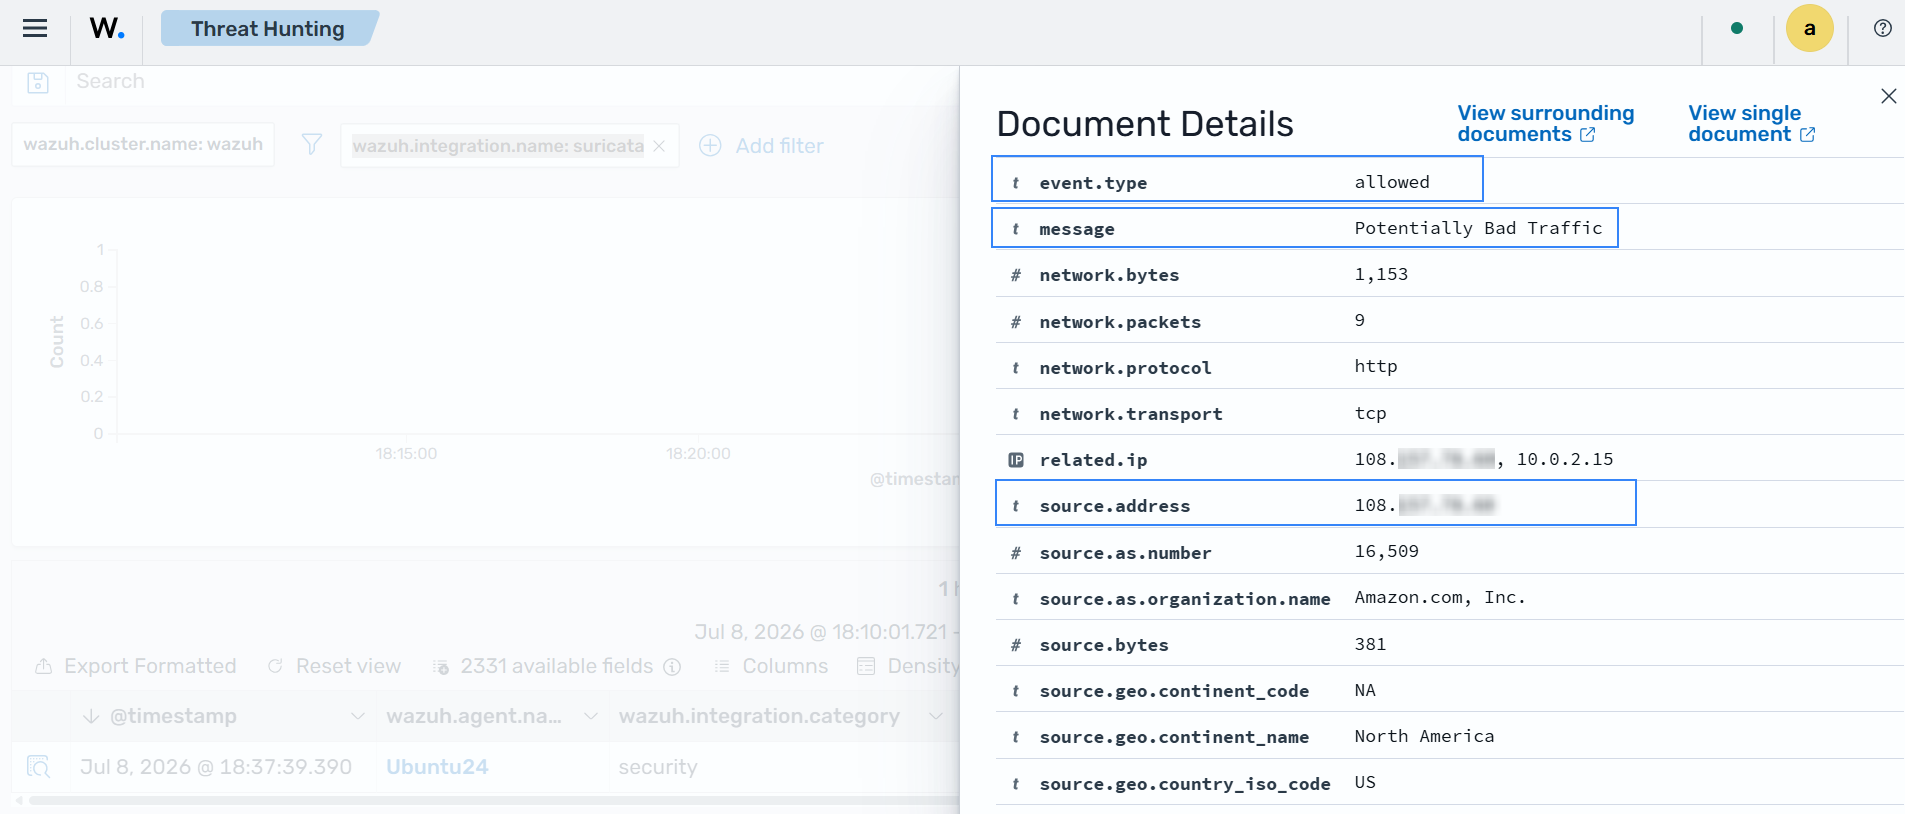
You can visualize the alert data in the Wazuh dashboard. Go to Threat intelligence > Threat Hunting > Findings then filter for wazuh.integration.name: suricata.
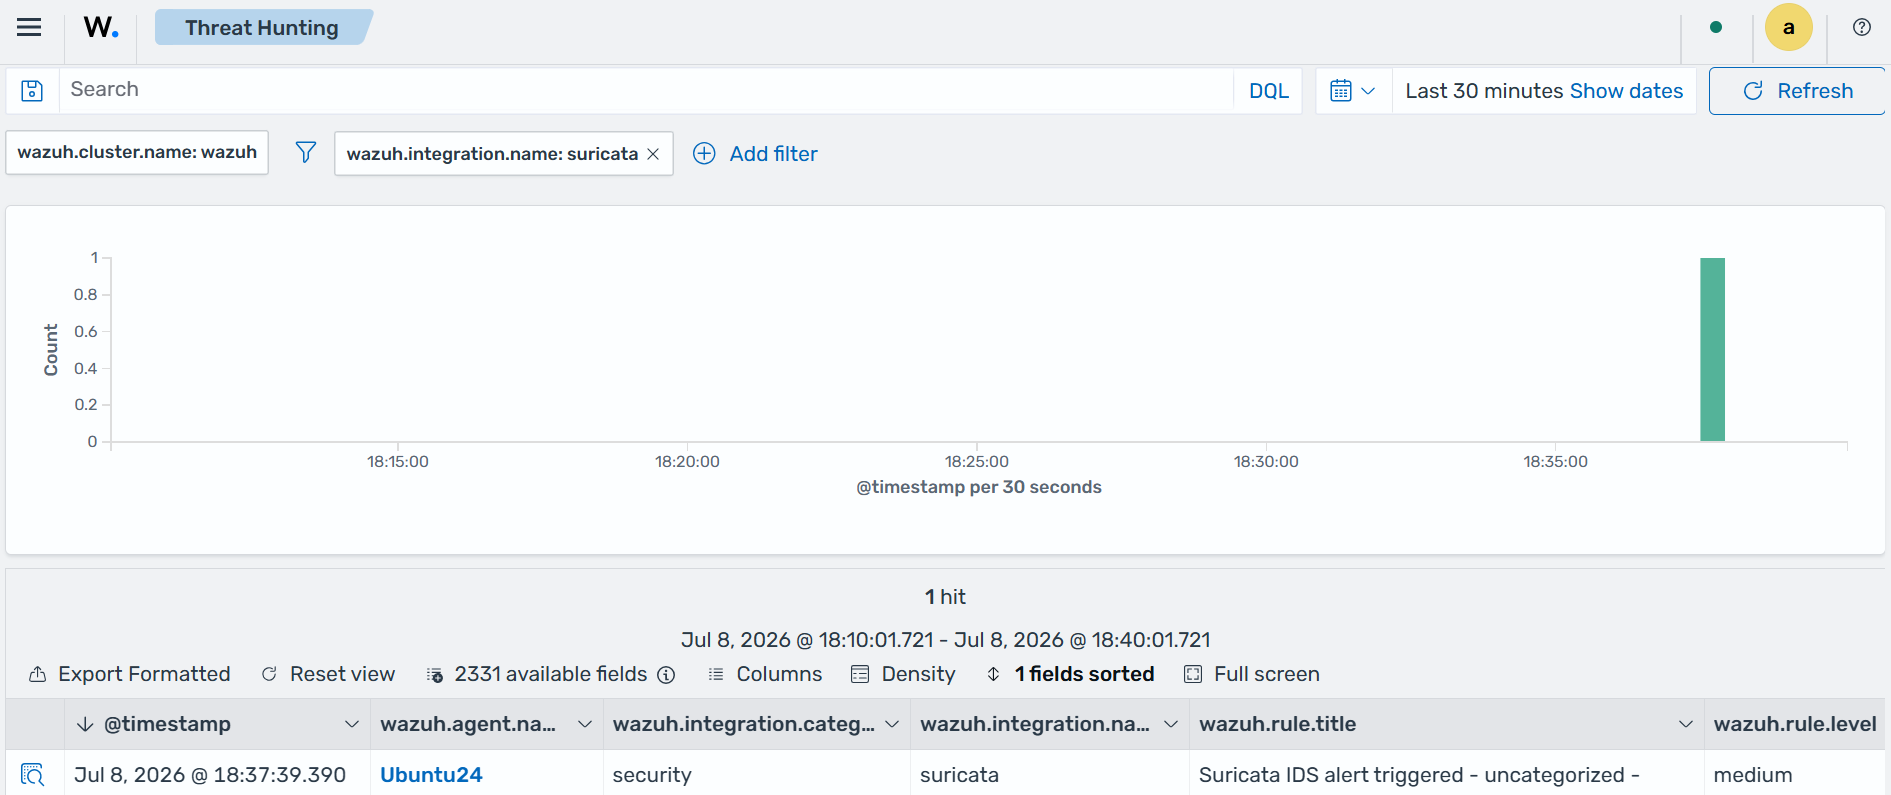
Click on the magnifying glass icon to see details of the alert including the source IP address of the attacker machine.