Create a security analytics detection workflow
This guide walks you through creating a custom Wazuh security analytics policy. You will create a custom integration, add decoders to parse raw logs, write a rule to identify suspicious events, validate the content with the Wazuh Log test tool, create a detector, and promote the content into production. You will also view the generated security findings in the Wazuh dashboard.
The example used throughout is based on Apache HTTP Server error logs. A few concepts make the rest of this guide easier to follow.
Integration. A logical grouping of decoders, rules, and optional key-value databases (KVDBs) that belong to the same log source or product. Every decoder must belong to exactly one integration.
Decoder. Parses raw, unstructured log lines into a structured format that follows the Wazuh Common Schema, so the analysis engine can work with consistent fields.
Rule. Defines detection logic that inspects the structured fields produced by decoders and generates a finding when a condition is met.
Detector. A scheduled job that applies selected rules to incoming events and generates findings.
Finding. A security record is created when an event matches a rule. This was previously called alert in Wazuh 4.x.
Note
Security analytics organizes content into a three-stage pipeline: Draft, Test, and Custom. Content is created in Draft, validated in Test, and promoted to Custom for production use. Each stage serves as a controlled step in the promotion flow, ensuring changes are validated before affecting live data. Use the space selector in the top-right corner to confirm you are working in the correct stage.
You will complete the following steps in order:
Create a custom integration
Custom Wazuh security policies are managed through an integration on the Ruleset Management dashboard. Each custom decoder, KVDB, or rule is managed from within an integration.
Make sure the space selector reads Draft and follow these steps to create a custom integration.
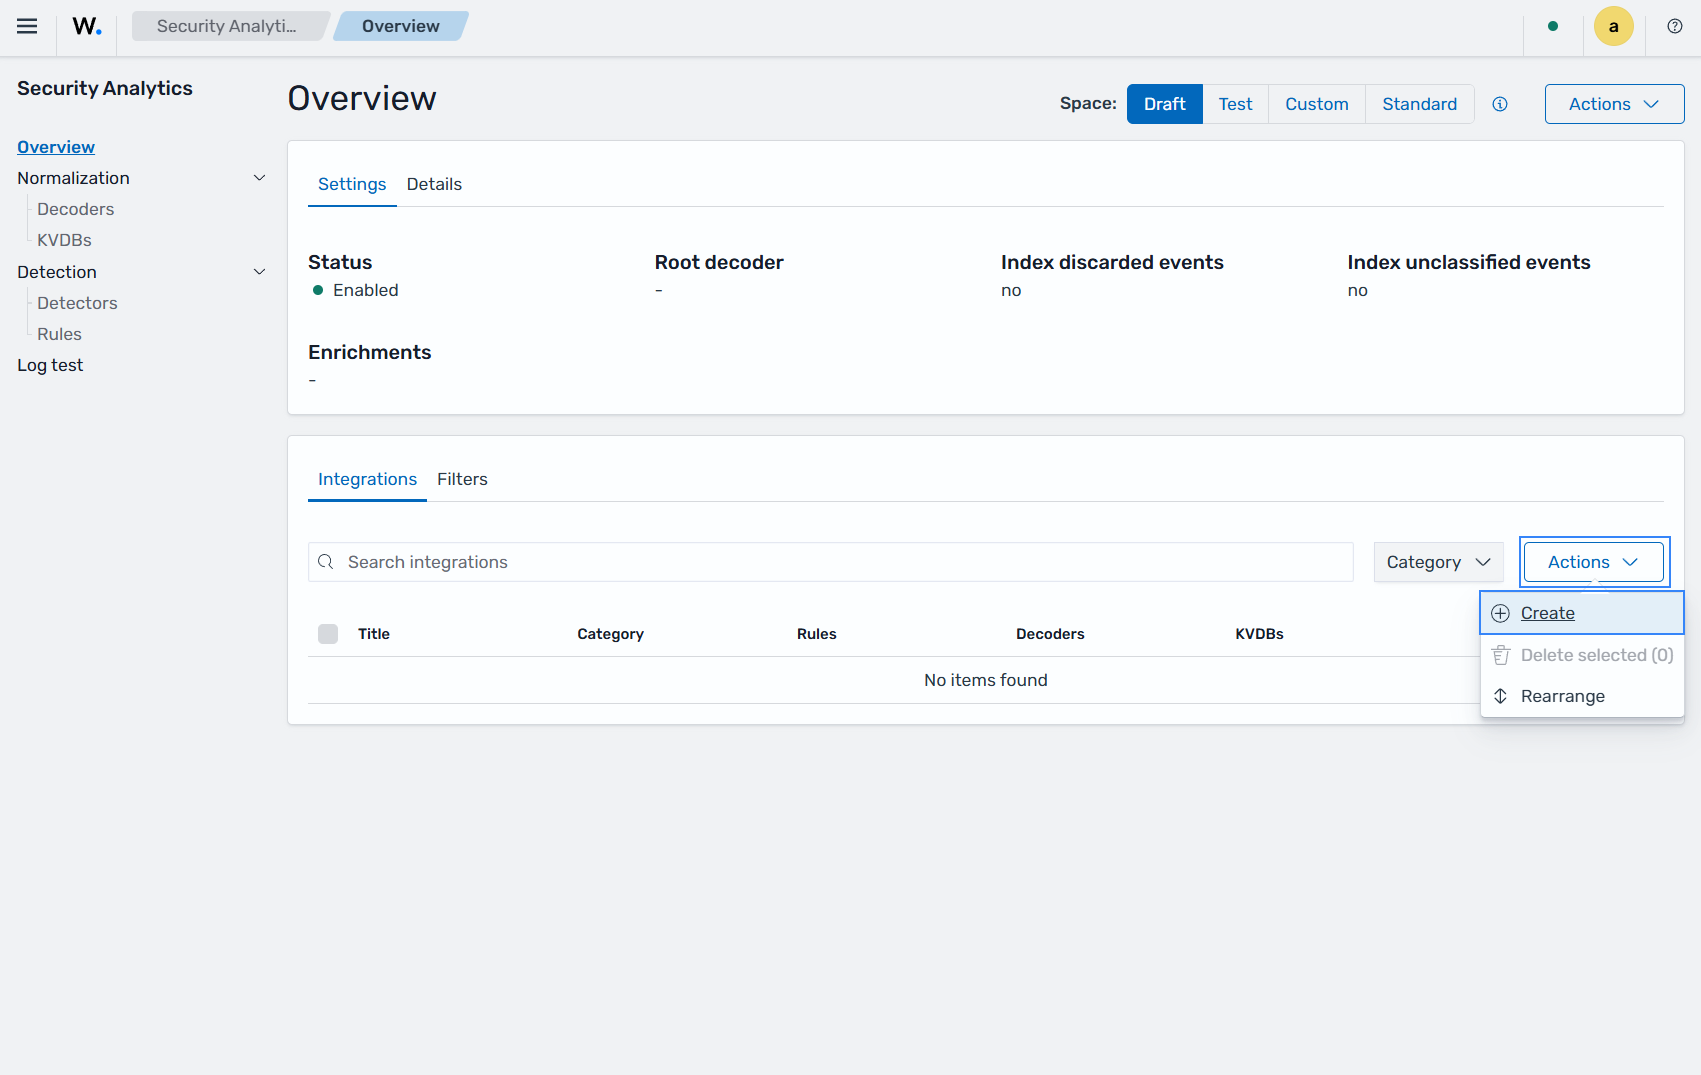
Go to Ruleset management > Overview > Integrations > Actions > Create.
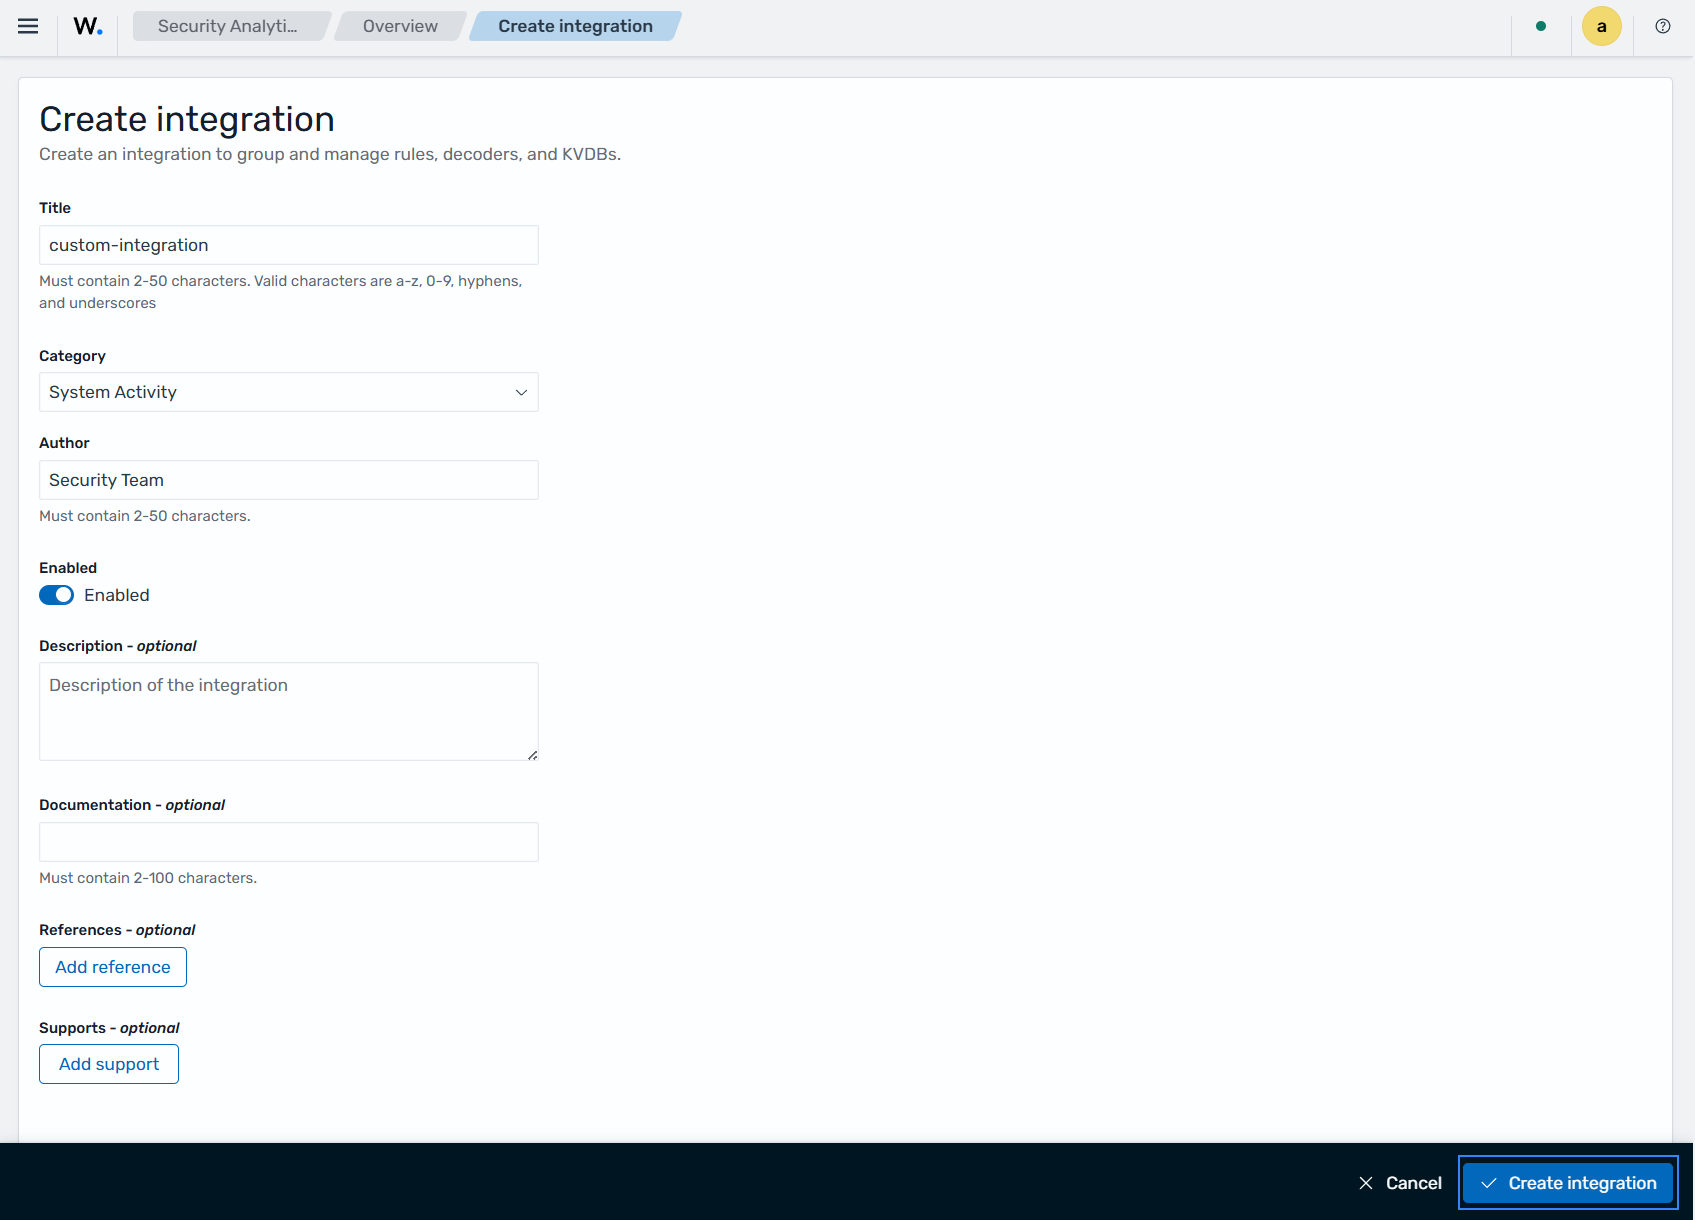
In the form, enter the following values that we use in this example, make sure the integration is Enabled, then click Create integration:
Title: custom-integration
Category: System Activity
Author: Security Team
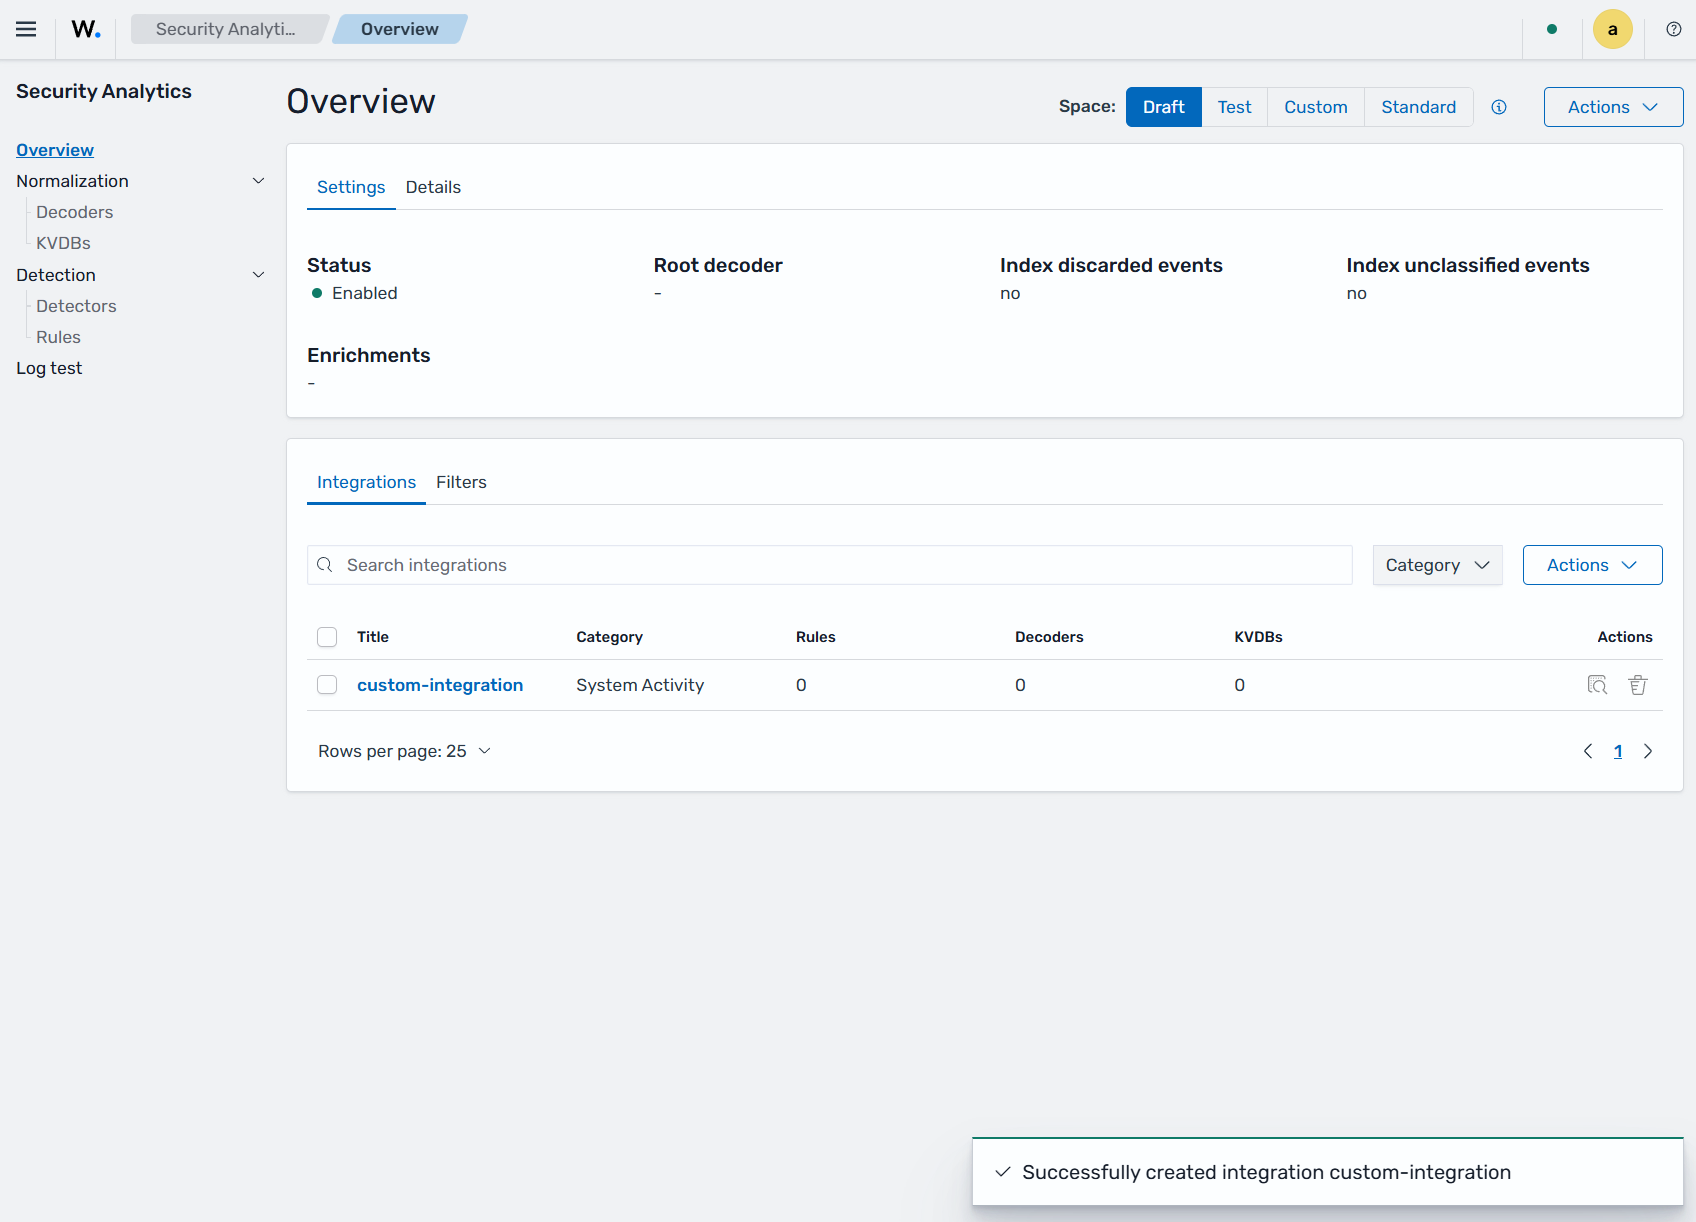
After creating the integration, it will appear in the integrations list.
Create custom decoders
Configure two decoders: a root decoder that processes all incoming events before any source-specific analysis, and a child decoder that receives matching events from the root decoder to perform detailed parsing of Apache error logs.
Make sure the space selector reads Draft and follow the steps below to create custom decoders using the Ruleset Management dashboard.
Go to Ruleset management > Normalization > Decoders > Actions > Create.
Select the integration you created (
custom-integration), then use the two decoders below.Root decoder
name: "decoder/core-wazuh-message/0"
metadata:
  author: "Wazuh, Inc."
  date: "2026-06-10T19:32:11Z"
  description: "Base decoder to process Wazuh message format, parses location part\
    \ and enriches the events that comes from a Wazuh agent with the host information."
  documentation: ""
  modified: "2026-06-10T19:32:11Z"
  references:
  - "https://documentation.wazuh.com/"
  supports: []
  title: "Wazuh message decoder"
normalize:
- map:
  - _tmp_json: "parse_json($event.original)"
enabled: true
The
decoder/core-wazuh-message/0is a root decoder that parses the raw event as JSON and stores the result in a temporary field for child decoders to use. Other decoders inherit from it to handle specific log sources.Child decoder
name: "decoder/apache-error/0"
metadata:
  date: "2026-06-10T20:04:08Z"
  title: "Apache HTTP Server error logs decoder"
  author: "Wazuh, Inc."
  modified: "2026-06-10T20:04:08Z"
  supports: []
  references:
  - "https://httpd.apache.org/docs/2.4/logs.html"
  - "https://httpd.apache.org/docs/2.4/custom-error.html"
  description: "Decoder for Apache HTTP Server error logs."
  documentation: ""
parents:
- "decoder/core-wazuh-message/0"
parse|event.original:
- "[<event.start/ANSIC>] [<log.logger>:<log.level>] [pid <process.pid>(?:tid <process.thread.id>)]\
  \ [client <source.address>(?:<source.port>)] <message>"
- "[<event.start/ANSIC>] [<log.logger>:<log.level>] [pid <process.pid>(?:tid <process.thread.id>)]\
  \ <message>"
- "[<event.start/ANSIC>] [<log.level>] [client <source.address>(?:<source.port>)]\
  \ <message>"
- "[<event.start/ANSIC>] [<log.level>] <message>"
normalize:
- map:
  - event.category: "array_append(web)"
  - event.dataset: "apache-error"
  - event.kind: "event"
  - service.type: "apache"
  - source.ip: "$source.address"
- map:
  - event.type: "array_append(error)"
  - event.outcome: "failure"
  check:
  - log.level: "regex_match(^(?:emerg|alert|crit|error|warn\\)$)"
- map:
  - event.type: "array_append(info)"
  - event.outcome: "unknown"
  check:
  - log.level: "regex_not_match(^(?:emerg|alert|crit|error|warn\\)?$)"
- parse|message:
  - "File does not exist: <file.path>(?, referer: <http.request.referrer>)"
- map:
  - source.domain: "$source.address"
  check:
  - source.ip: "not_exists()"
enabled: true
The
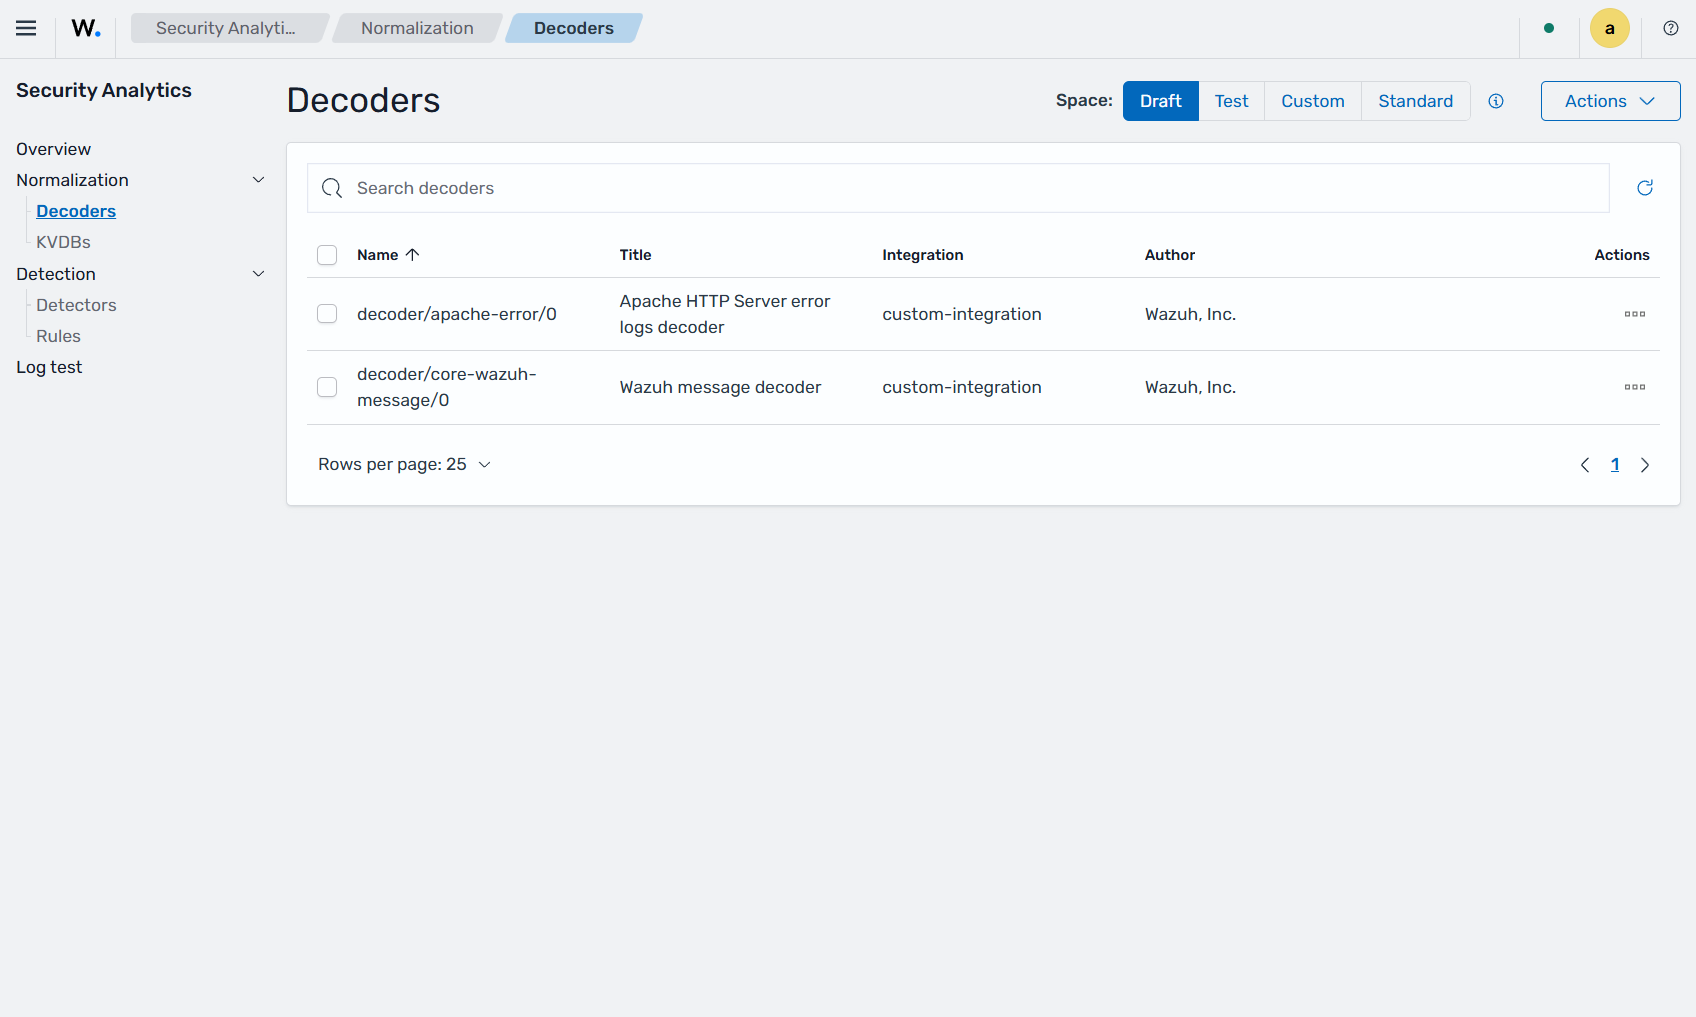
decoder/apache-error/0decoder inherits from the base decoder and processes Apache HTTP Server error logs. It parses the raw log to extract fields like timestamp, log level, and client address, then classifies the event as an error or informational based on the log level.Once both decoders are saved, they appear together in the decoders list.
Attach the root decoder to an integration
The integration must be enabled and configured with a root decoder before any additional decoders can be attached. The root decoder serves as the entry point for parsing events from the selected log source and ensures that all related decoders are properly chained and executed within the integration's processing flow.
Make sure the space selector reads Draft and follow these steps to assign a root decoder to the integration.
Go to Ruleset management > Overview > Actions > Edit.
Confirm the status is Enabled, and assign the
decoder/core-wazuh-message/0as the root decoder. Click Save to apply the configuration.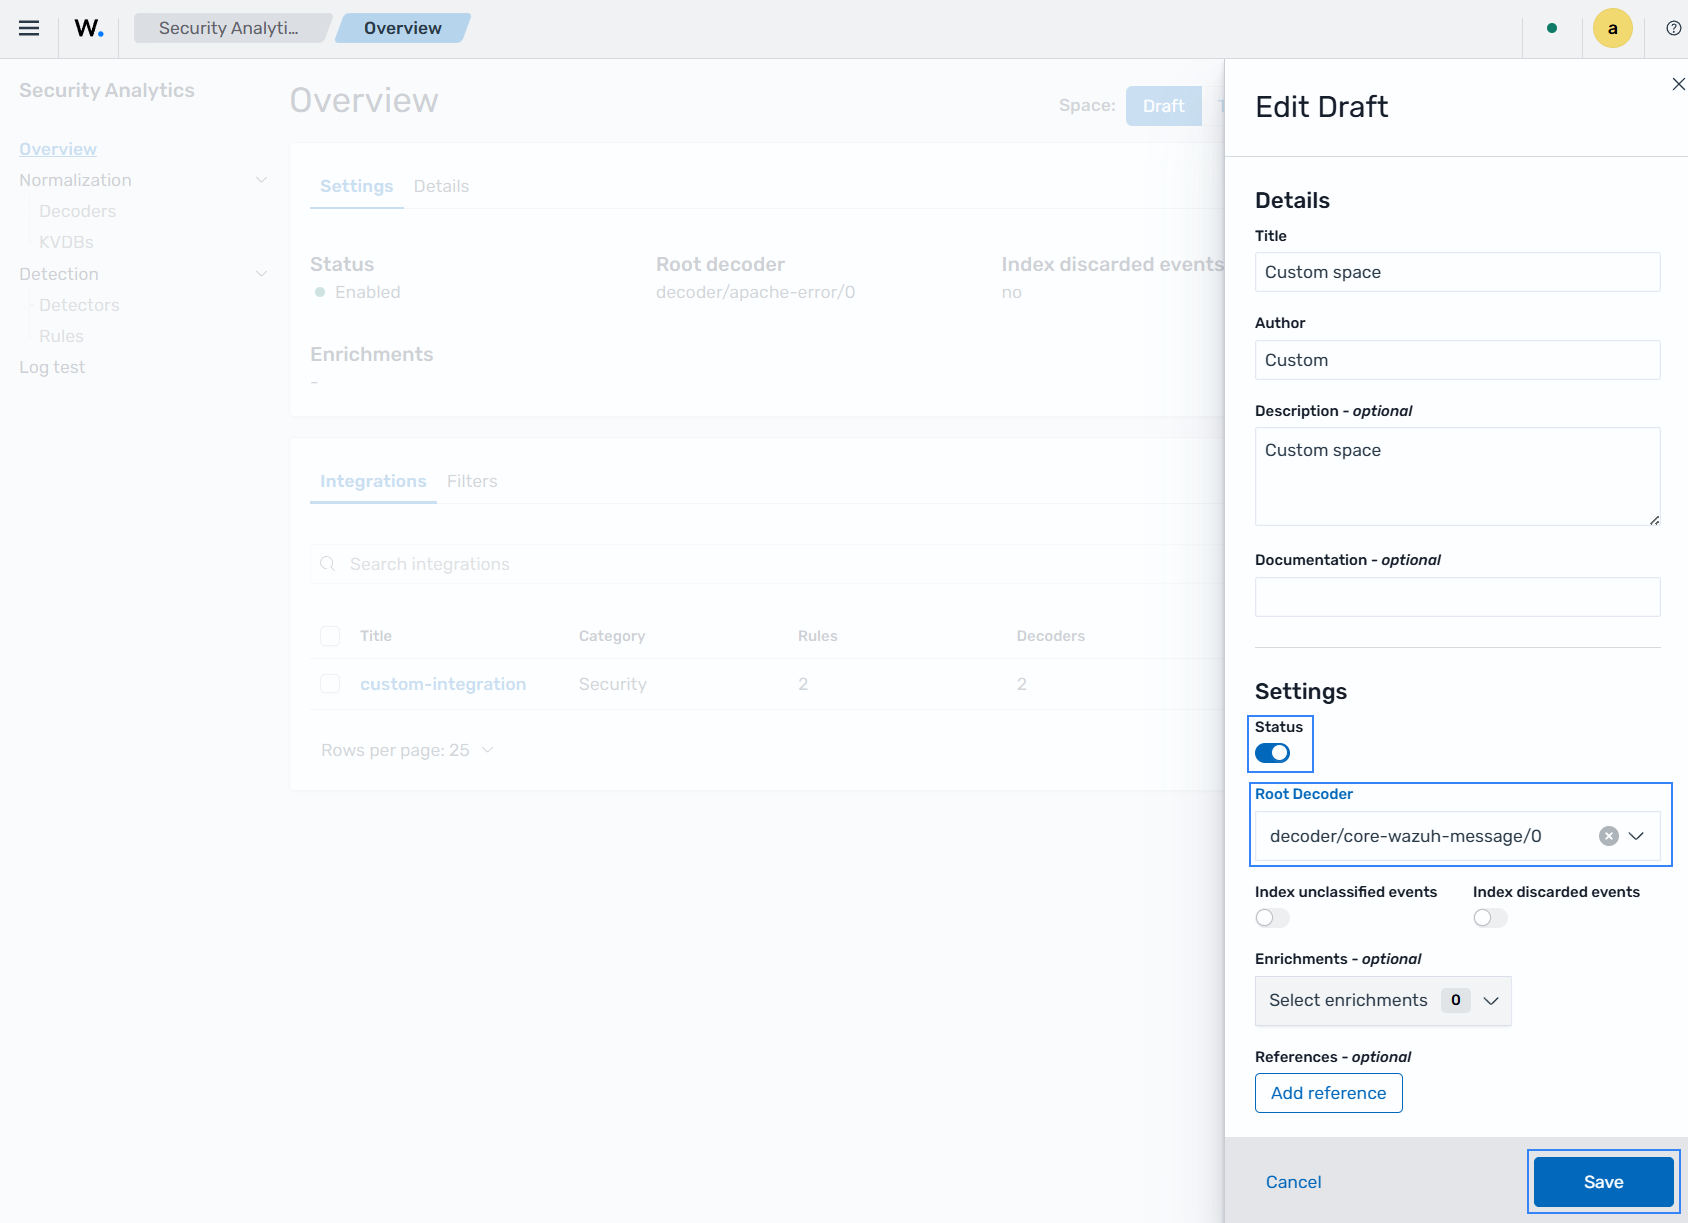
Create a custom rule
Rules are used to identify patterns in normalized events and determine when specific conditions indicate a potential security event. They form the detection logic in Wazuh, allowing you to trigger findings based on structured event data generated by decoders.
Make sure the space selector reads Draft and follow these steps to create a rule that flags Apache error events classified as failures.
Go to Ruleset management > Detection > Rules > Create.
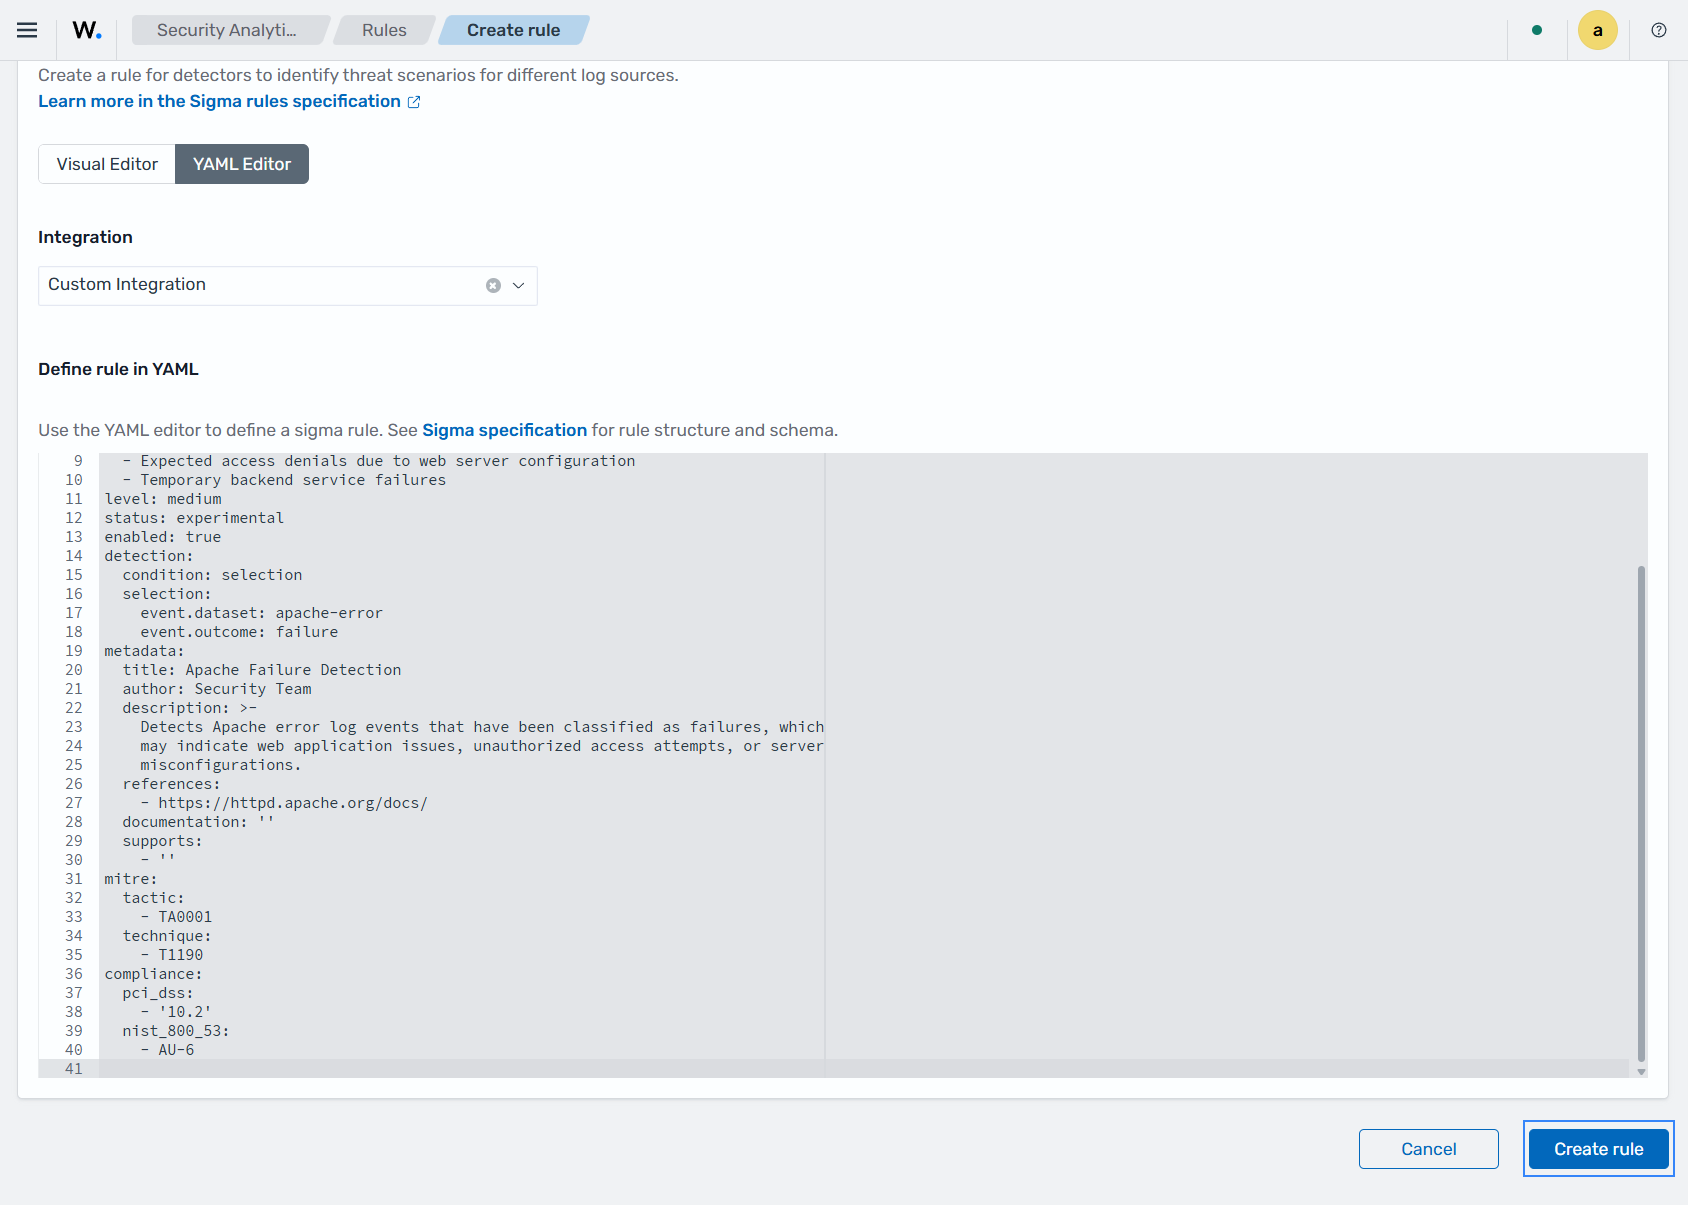
Select YAML Editor, choose the custom-integration integration and paste the rule:
logsource:
  product: custom-integration
tags:
  - attack.initial-access
  - attack.t1190
falsepositives:
  - Legitimate application errors
  - Expected access denials due to web server configuration
  - Temporary backend service failures
level: medium
status: experimental
enabled: true
detection:
  condition: selection
  selection:
    event.dataset: apache-error
    event.outcome: failure
metadata:
  title: Apache Failure Detection
  author: Security Team
  description: >-
    Detects Apache error log events that have been classified as failures, which
    may indicate web application issues, unauthorized access attempts, or server
    misconfigurations.
  references:
    - https://httpd.apache.org/docs/
  documentation: ''
  supports:
    - ''
mitre:
  tactic:
    id:
      - TA0001
    name:
      - Initial Access
  technique:
    id:
      - T1190
    name:
      - Exploit Public-Facing Application
compliance:
  pci_dss:
    - '10.2'
  nist_800_53:
    - AU-6
Note
logsource.productmust match the integration title exactly (custom-integration).This rule fires when
event.datasetisapache-errorandevent.outcomeisfailure. These failures can indicate web application issues, unauthorized access attempts, or server misconfigurations.Click Create rule to complete the rule creation process.
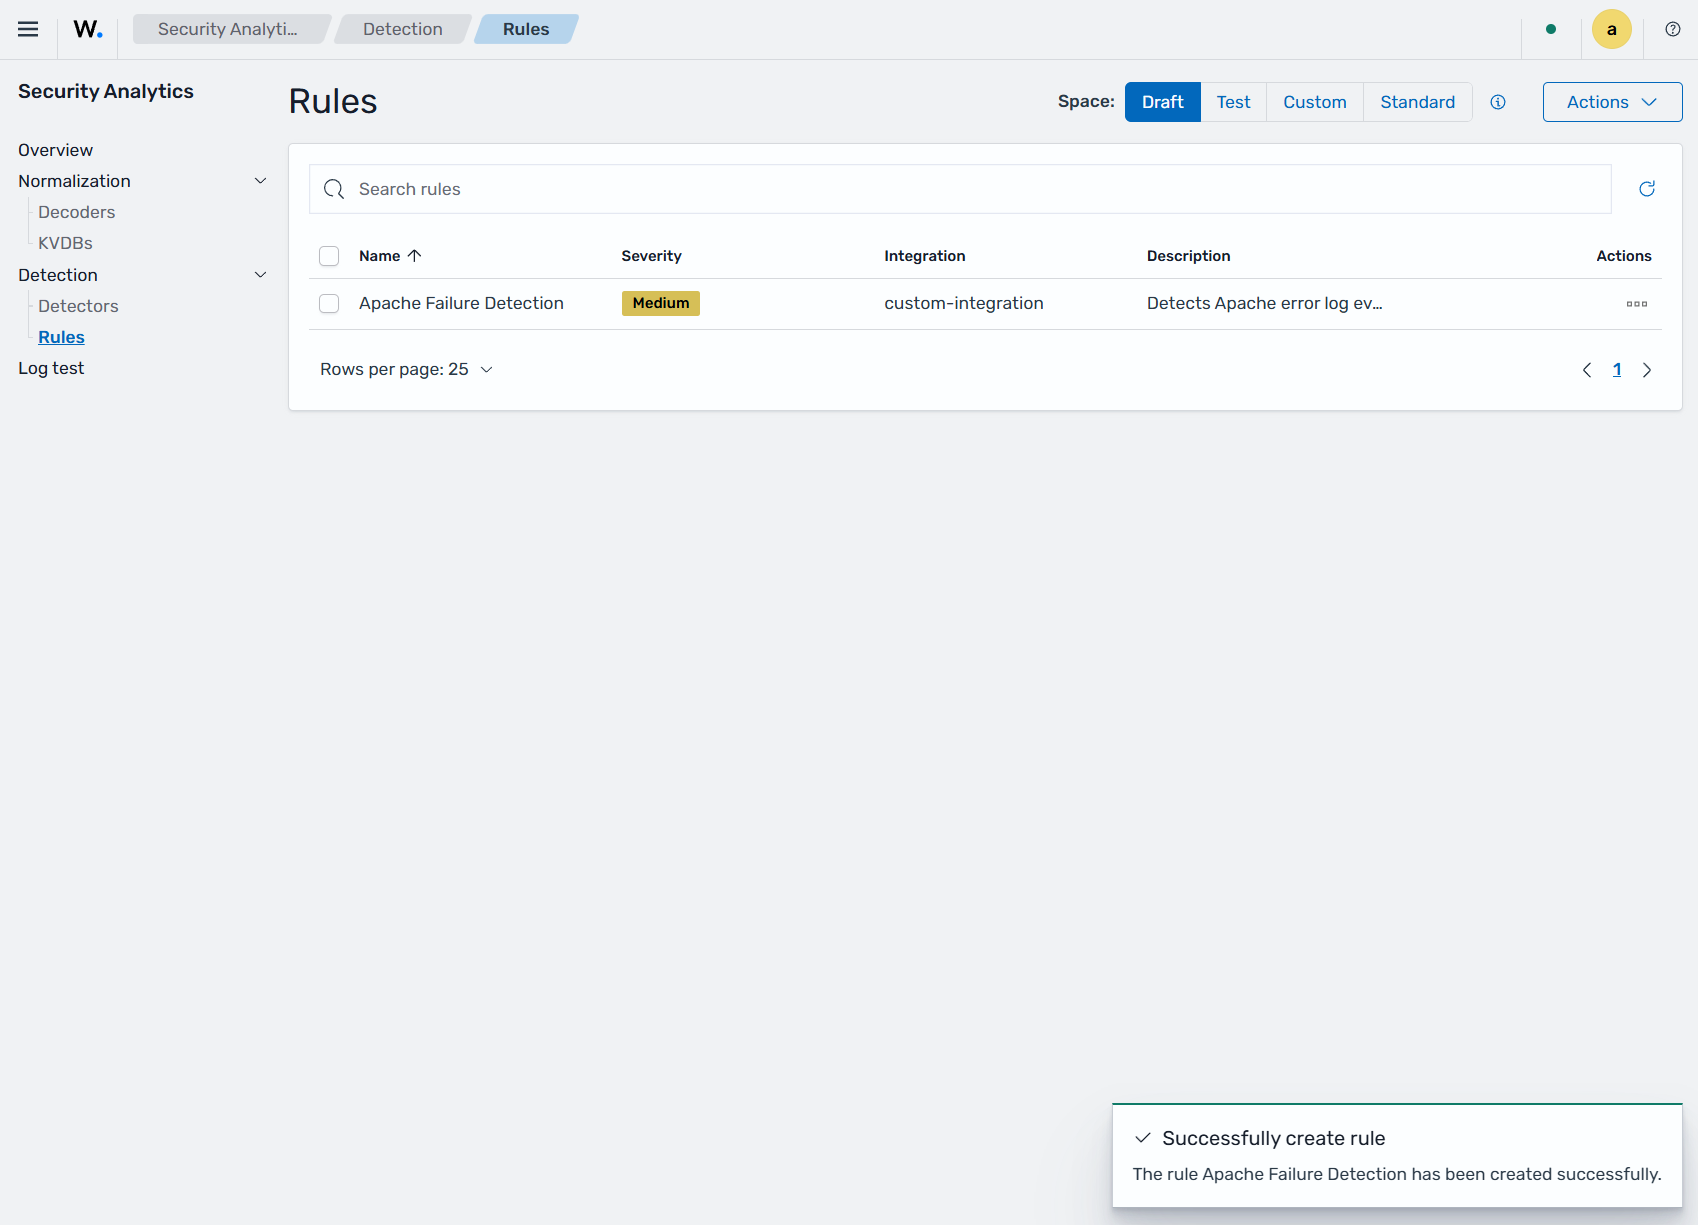
Once the rule is created, it will appear in the Rules list.
Promote the content from the draft to the test space
In the draft space, you create and refine your integrations, decoders, and rules. Promoting this content to the test space allows you to validate it with the Log test tool before it is introduced into production. Promotion moves the integration along with its associated decoders and rules.
Make sure the space selector reads Draft, and follow these steps to promote the content from draft to test.
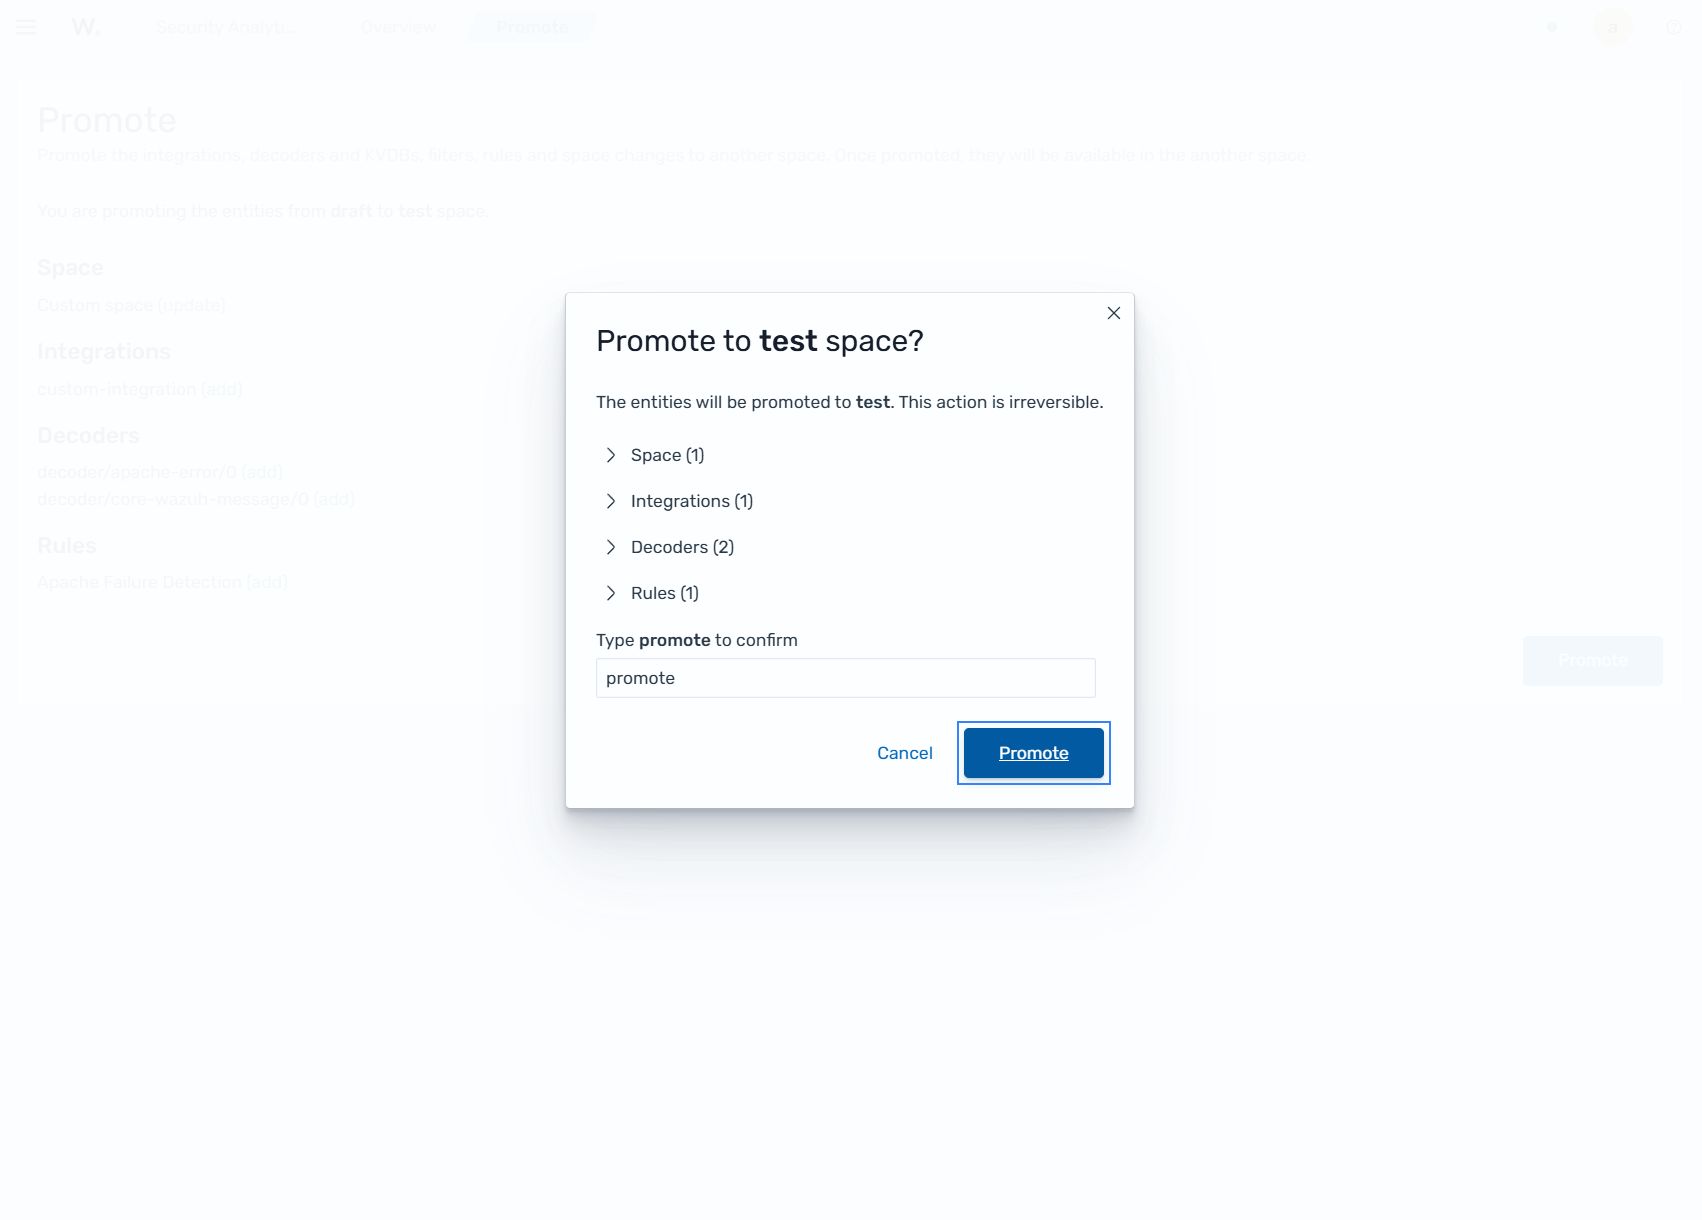
Go to Ruleset management > Overview, and click Actions > Promote
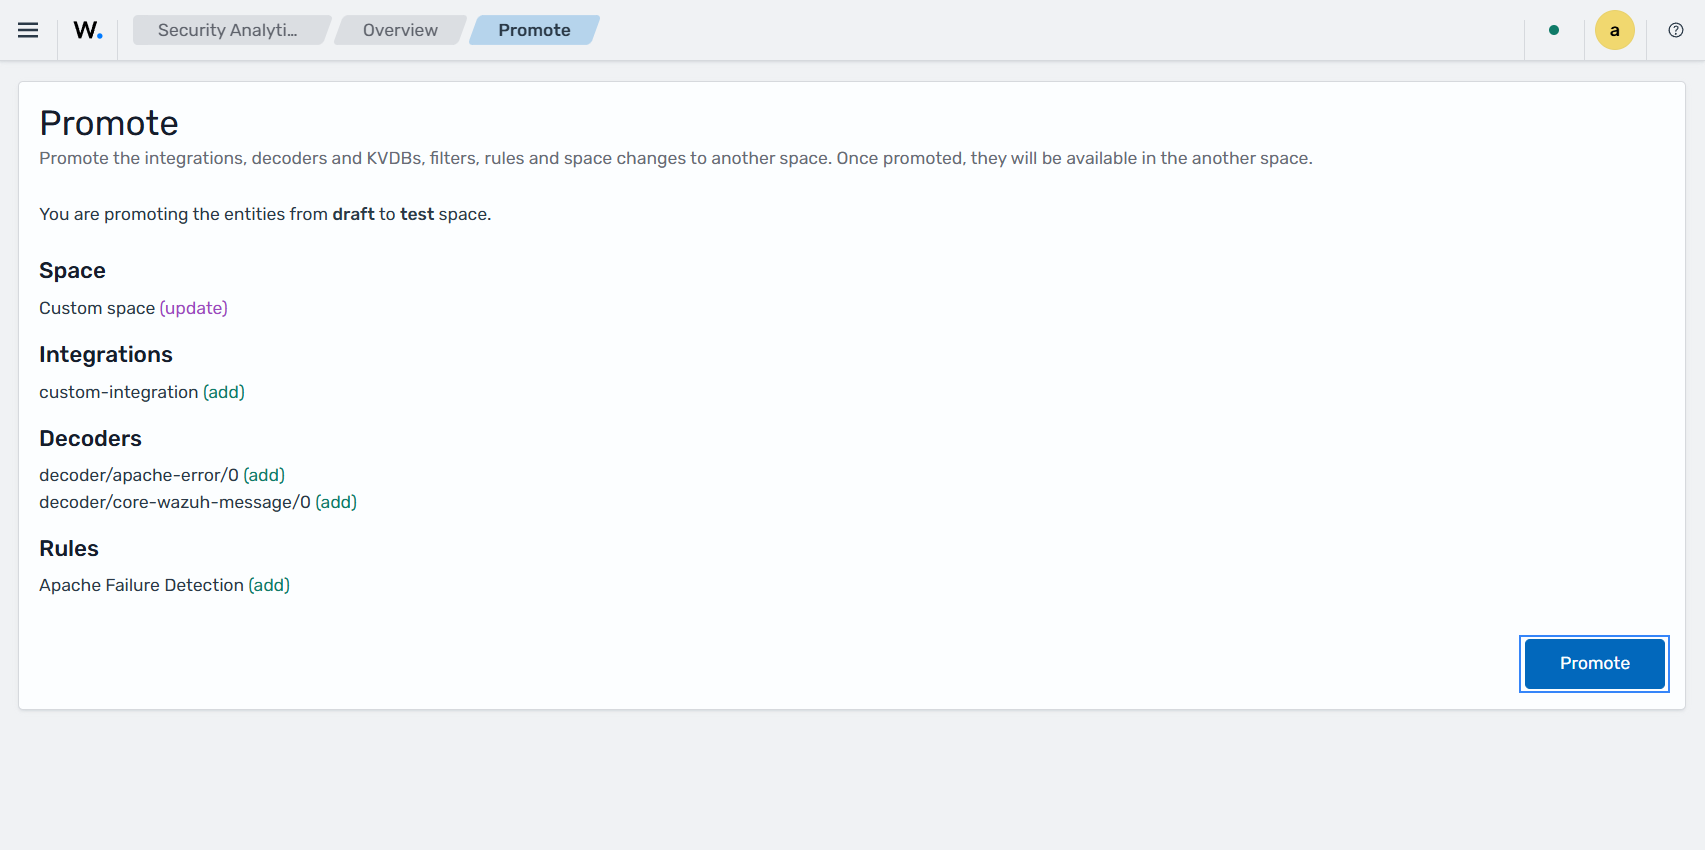
Type the confirmation message when prompted, and click Promote.
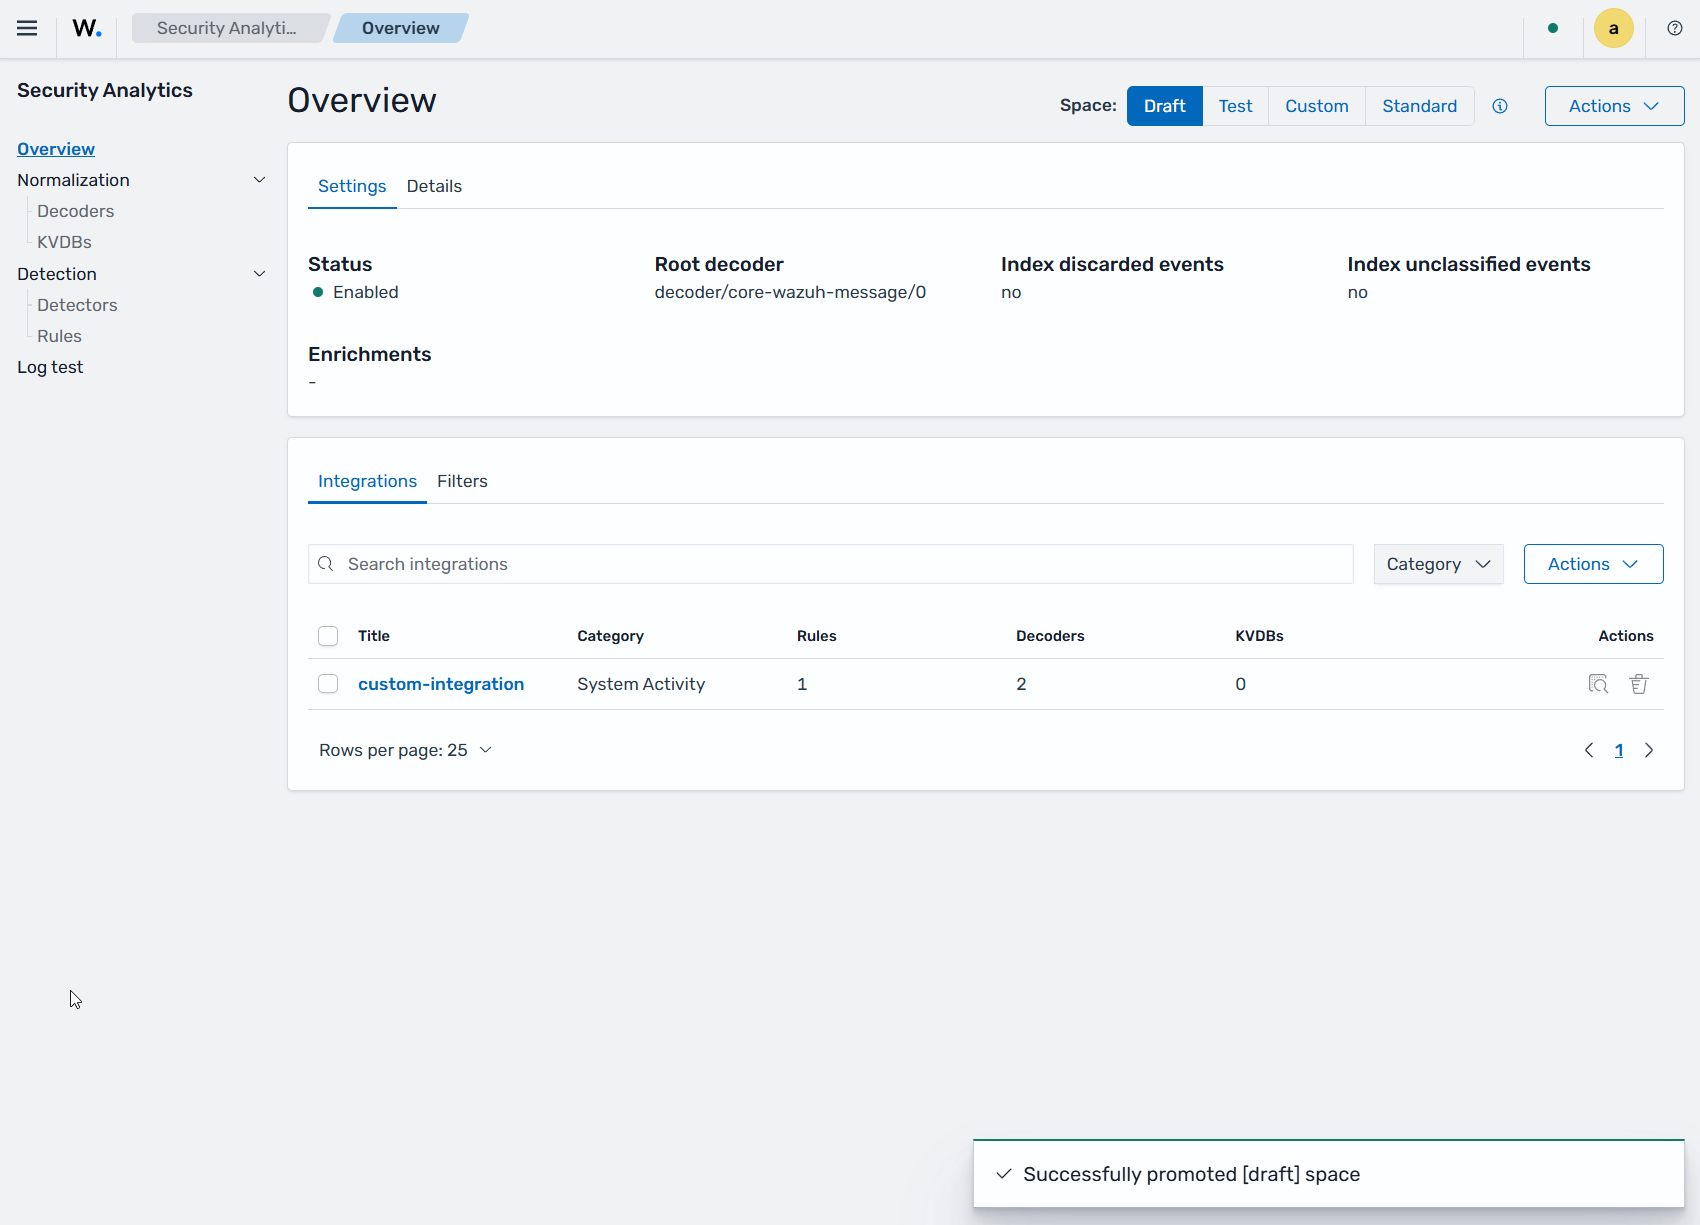
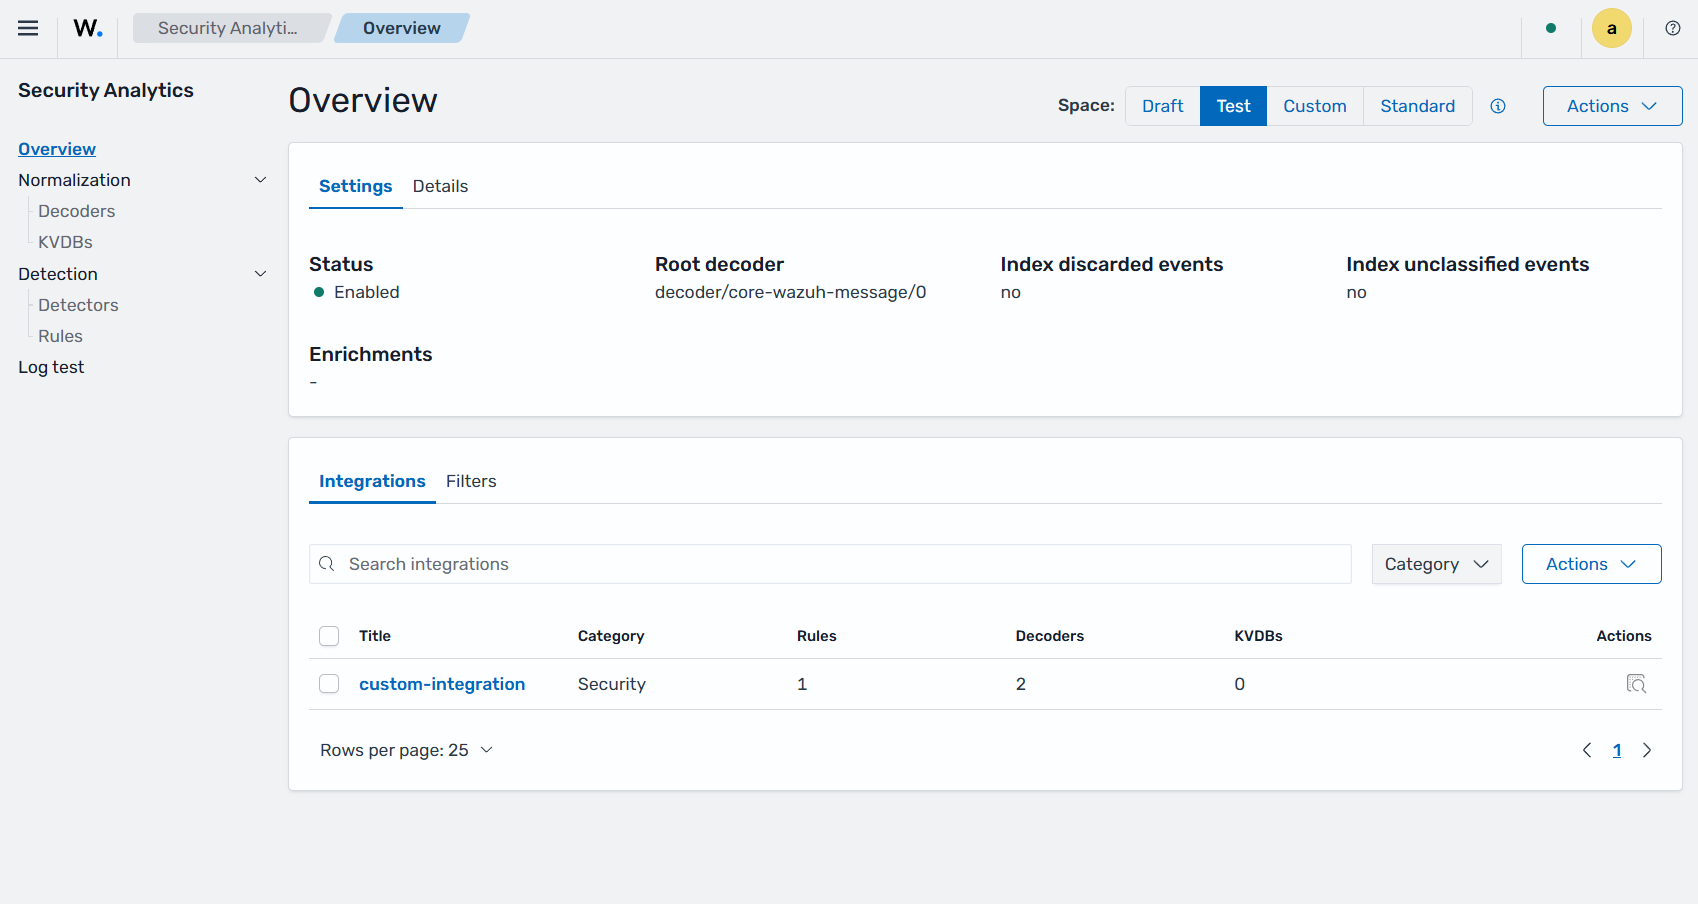
After promotion, the integration appears in the Test space.
Validate the content with a log test
After promoting the integration to the test space, use Log test to validate how incoming events are decoded, normalized, and matched against your rules. This helps confirm that the integration behaves as expected before moving to production.
Make sure the space selector reads Test, and follow these steps to validate with Log test.
Go to Ruleset management > Log test.
Paste the sample Apache log line below into the Log event field to see how it is decoded and matched.
Sample log event
[Wed Jun 10 12:40:55.444444 2026] [rewrite:error] [pid 1239:tid 140123456794] [client 203.0.113.50:34567] AH00670: Options FollowSymLinks and SymLinksIfOwnerMatch are both off, so the RewriteRule directive is also forbidden
When decoding succeeds, the Normalization section of the Test Result shows the decoded event, and the Detection section shows the custom rule that matched it.
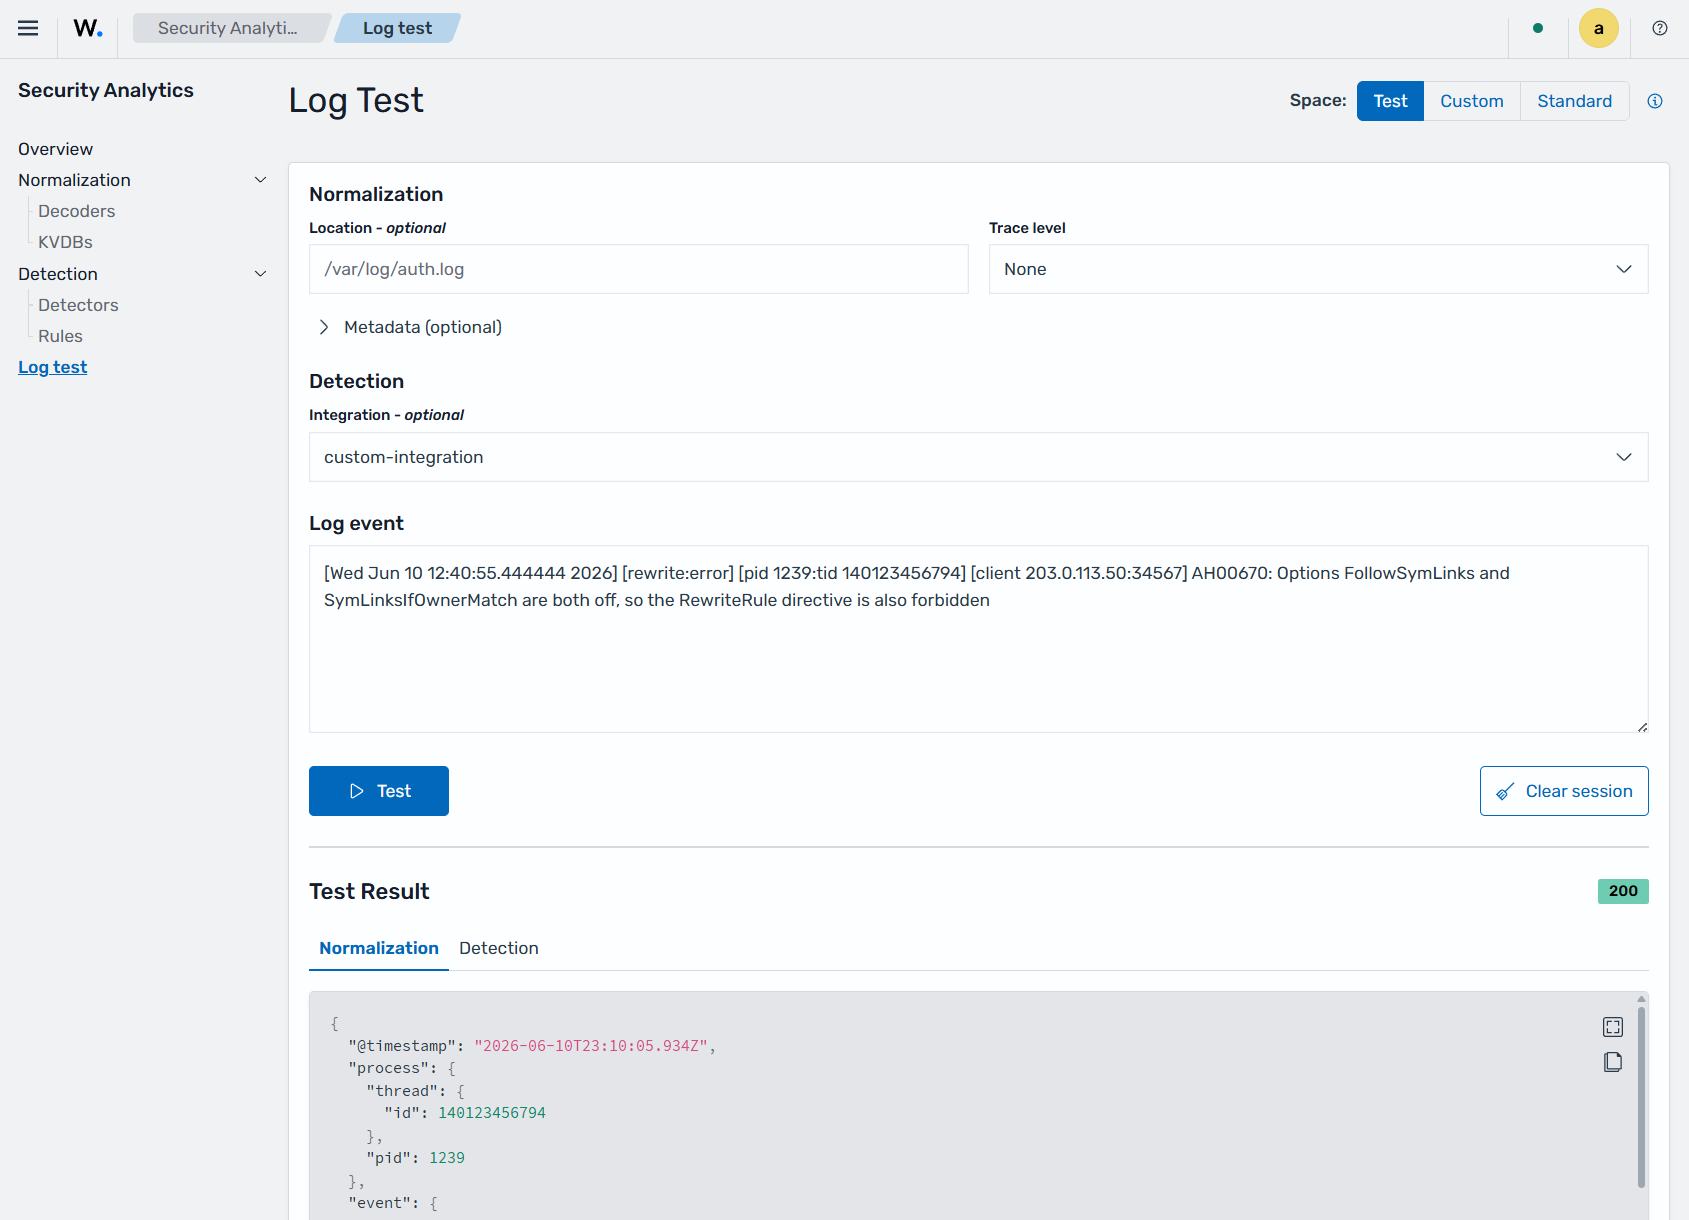
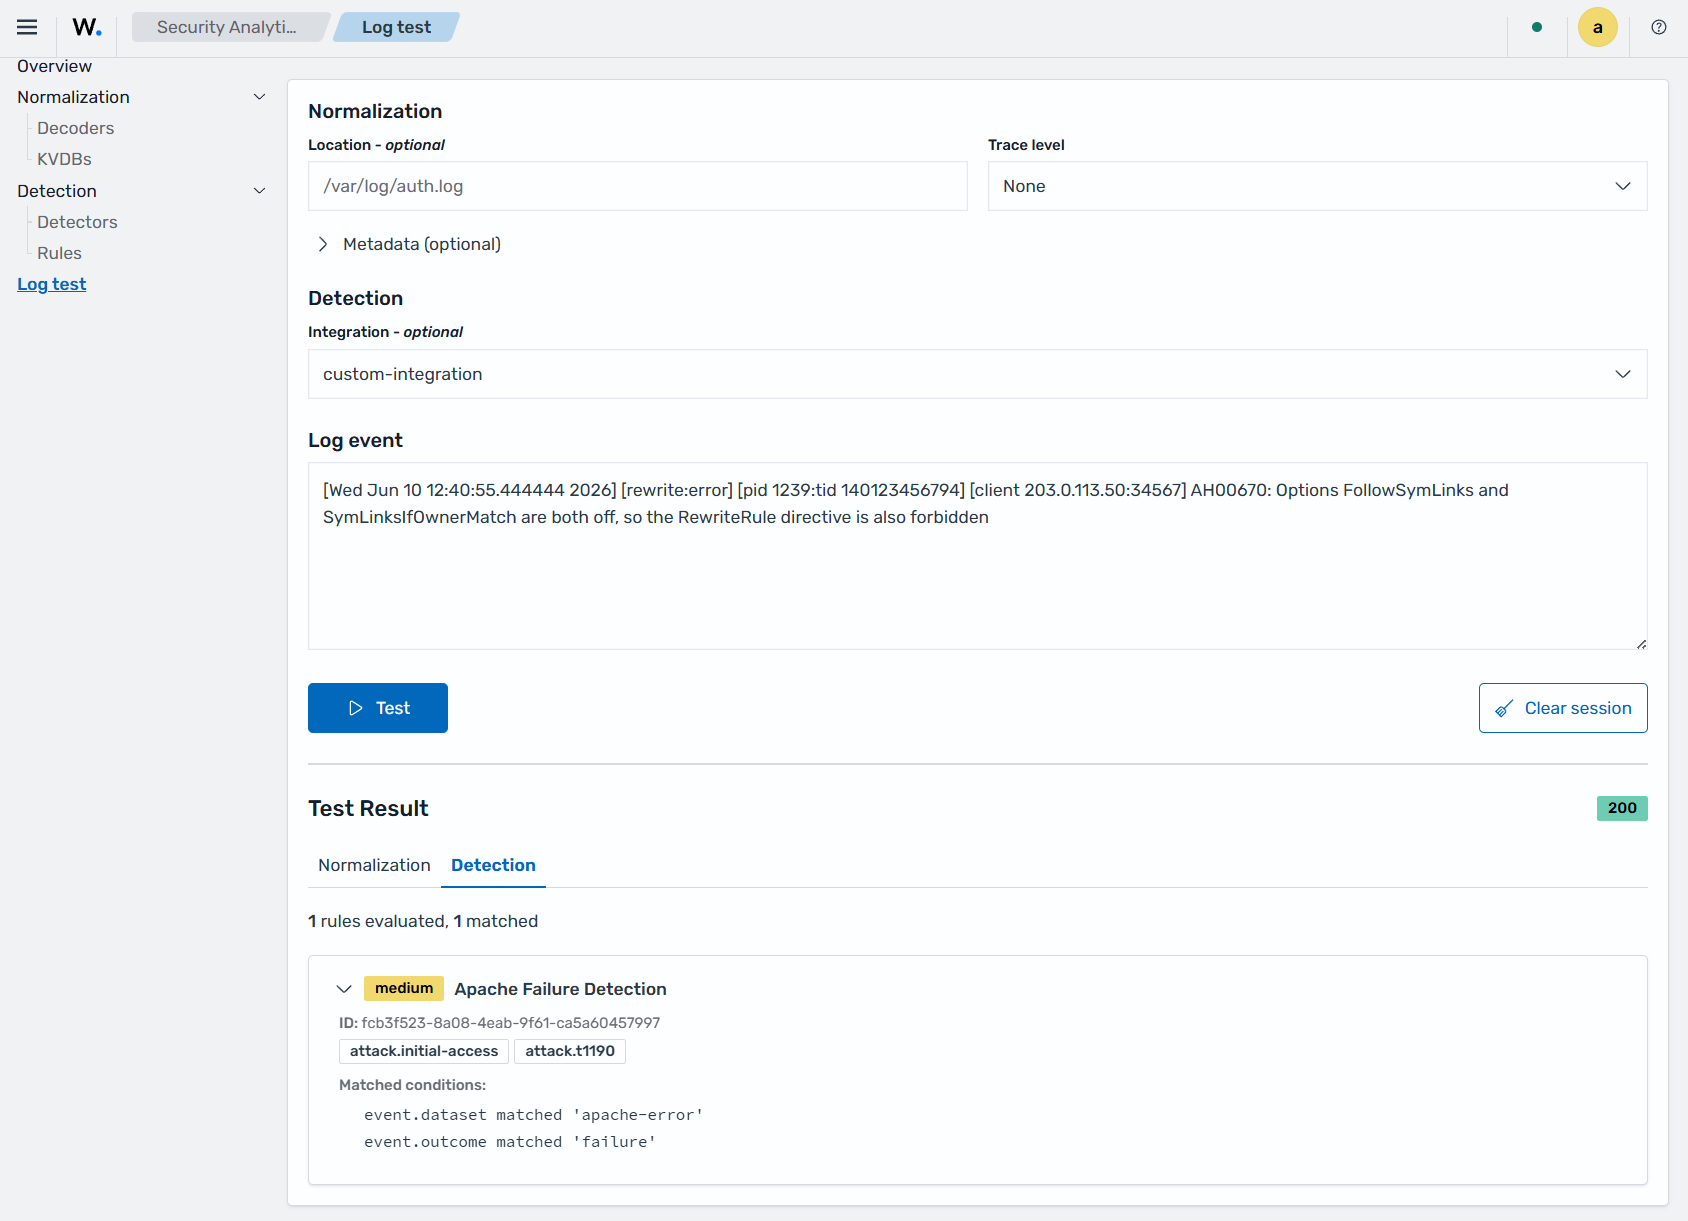
The processed event should match the JSON shown below. Notice that
event.outcomeisfailureandevent.datasetisapache-error, which are the exact conditions this rule is designed to match.Processed JSON event
{
  "source": {
    "port": 34567,
    "address": "203.0.113.50",
    "ip": "203.0.113.50"
  },
  "event": {
    "original": "[Wed Jun 10 12:40:55.444444 2026] [rewrite:error] [pid 1239:tid 140123456794] [client 203.0.113.50:34567] AH00670: Options FollowSymLinks and SymLinksIfOwnerMatch are both off, so the RewriteRule directive is also forbidden",
    "category": [
      "web"
    ],
    "kind": "event",
    "outcome": "failure",
    "start": "2026-06-10T12:40:55.444Z",
    "type": [
      "error"
    ],
    "dataset": "apache-error"
  },
  "process": {
    "pid": 1239,
    "thread": {
      "id": 140123456794
    }
  },
  "log": {
    "level": "error",
    "logger": "rewrite"
  },
  "message": "AH00670: Options FollowSymLinks and SymLinksIfOwnerMatch are both off, so the RewriteRule directive is also forbidden",
  "wazuh": {
    "protocol": {
      "location": "-",
      "queue": 1
    },
    "integration": {
      "category": "system-activity",
      "decoders": [
        "decoder/core-wazuh-message/0",
        "decoder/apache-error/0"
      ],
      "name": "custom-integration"
    },
    "event": {
      "id": "414a9ceb-86b9-4ecf-b350-f09df927cfae"
    },
    "space": {
      "name": "test"
    }
  },
  "service": {
    "type": "apache"
  },
  "@timestamp": "2026-06-11T19:33:54.235Z"
}
Promote the content from test to custom
After validating your integrations, decoders, and rules in the test space using Log test, you can promote the content to the custom space. This makes your validated detection content available for use in production environments, where the Wazuh data analysis capability can process and analyze incoming events.
Make sure the space selector reads Test, then follow these steps to promote the content.
Go to Ruleset management > Overview.
Click Actions > Promote, type the confirmation message, and click Promote.
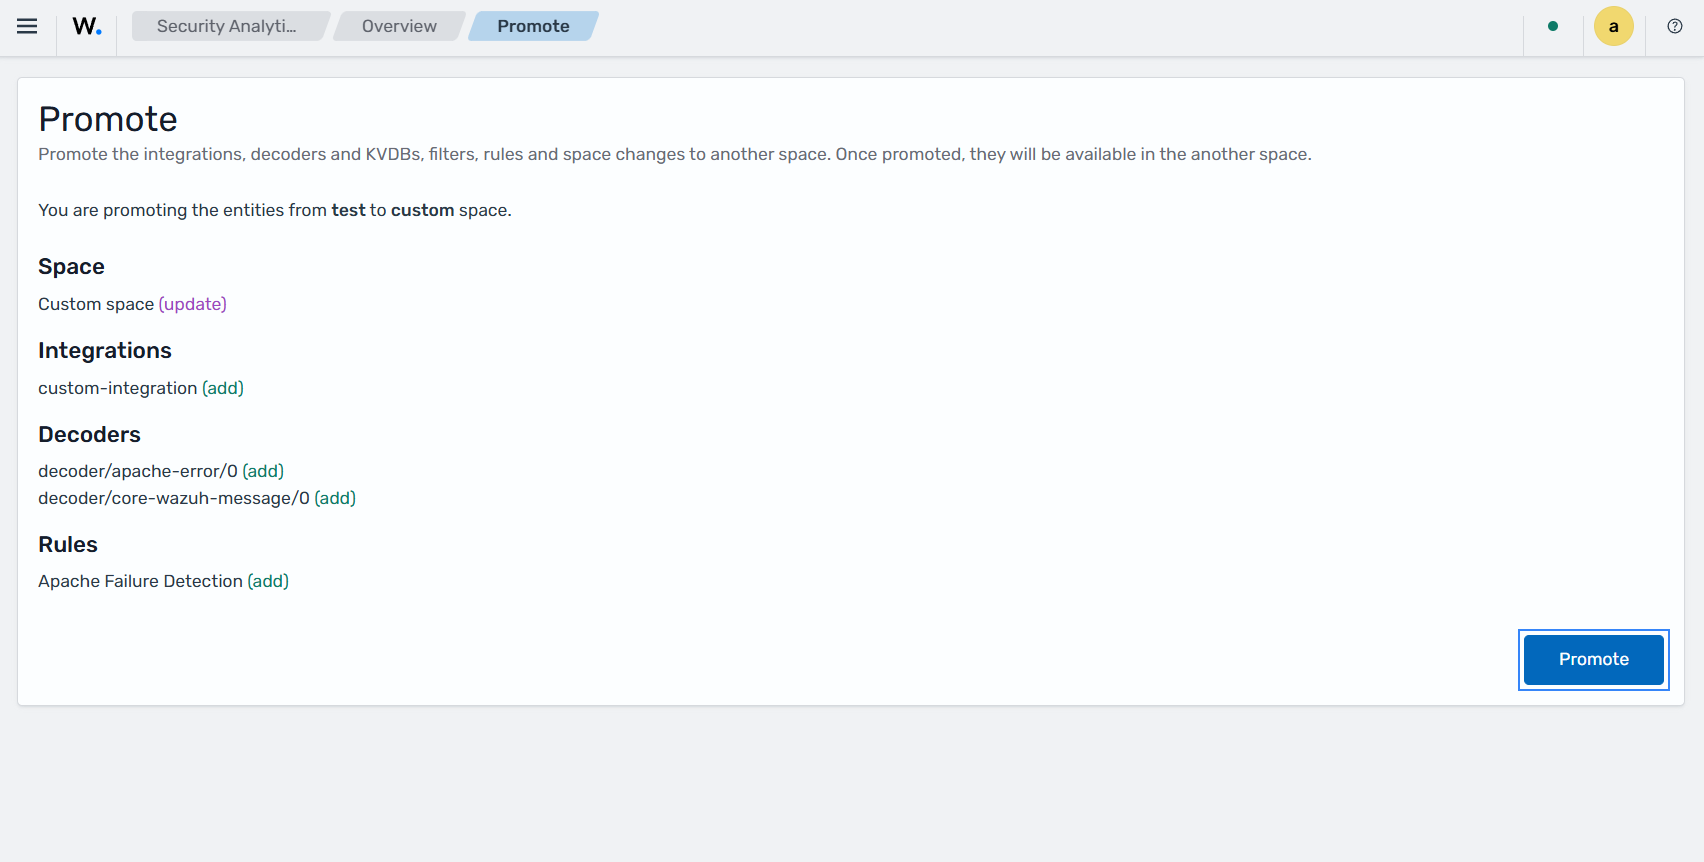
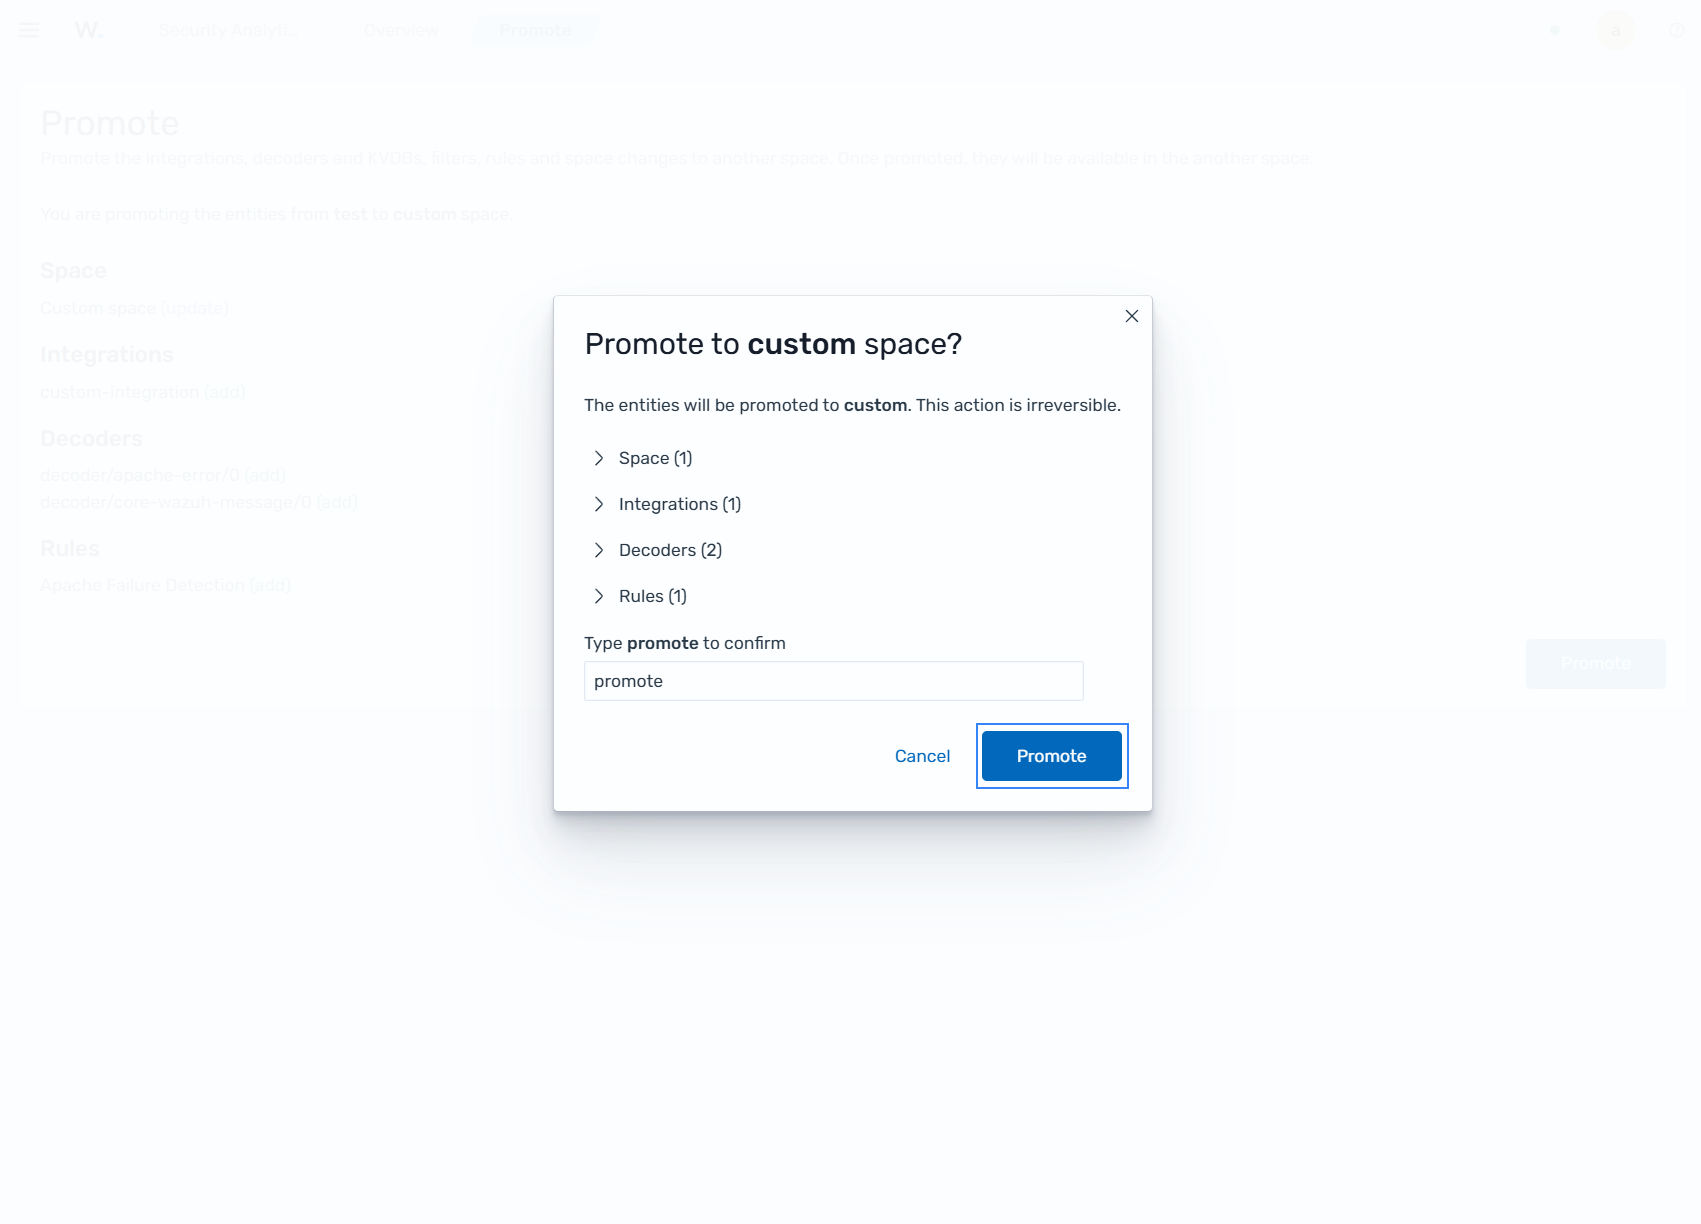
After promotion the integration becomes active and is used by the Wazuh data analysis capability to process incoming events and trigger findings when rule conditions are met.
Note
The Wazuh manager loads the custom space on a polling cycle. Events sent within about 2 minutes of the promotion are processed only by the standard policy and don't generate the custom finding.
Create a detector
A detector is the scheduled job that executes your rule. It scans indexed events from monitored endpoints at a defined interval, applies the selected rules, and generates findings when matches occur. Creating a detector turns your promoted content into an active and continuous detection.
Follow these steps to create a detector.
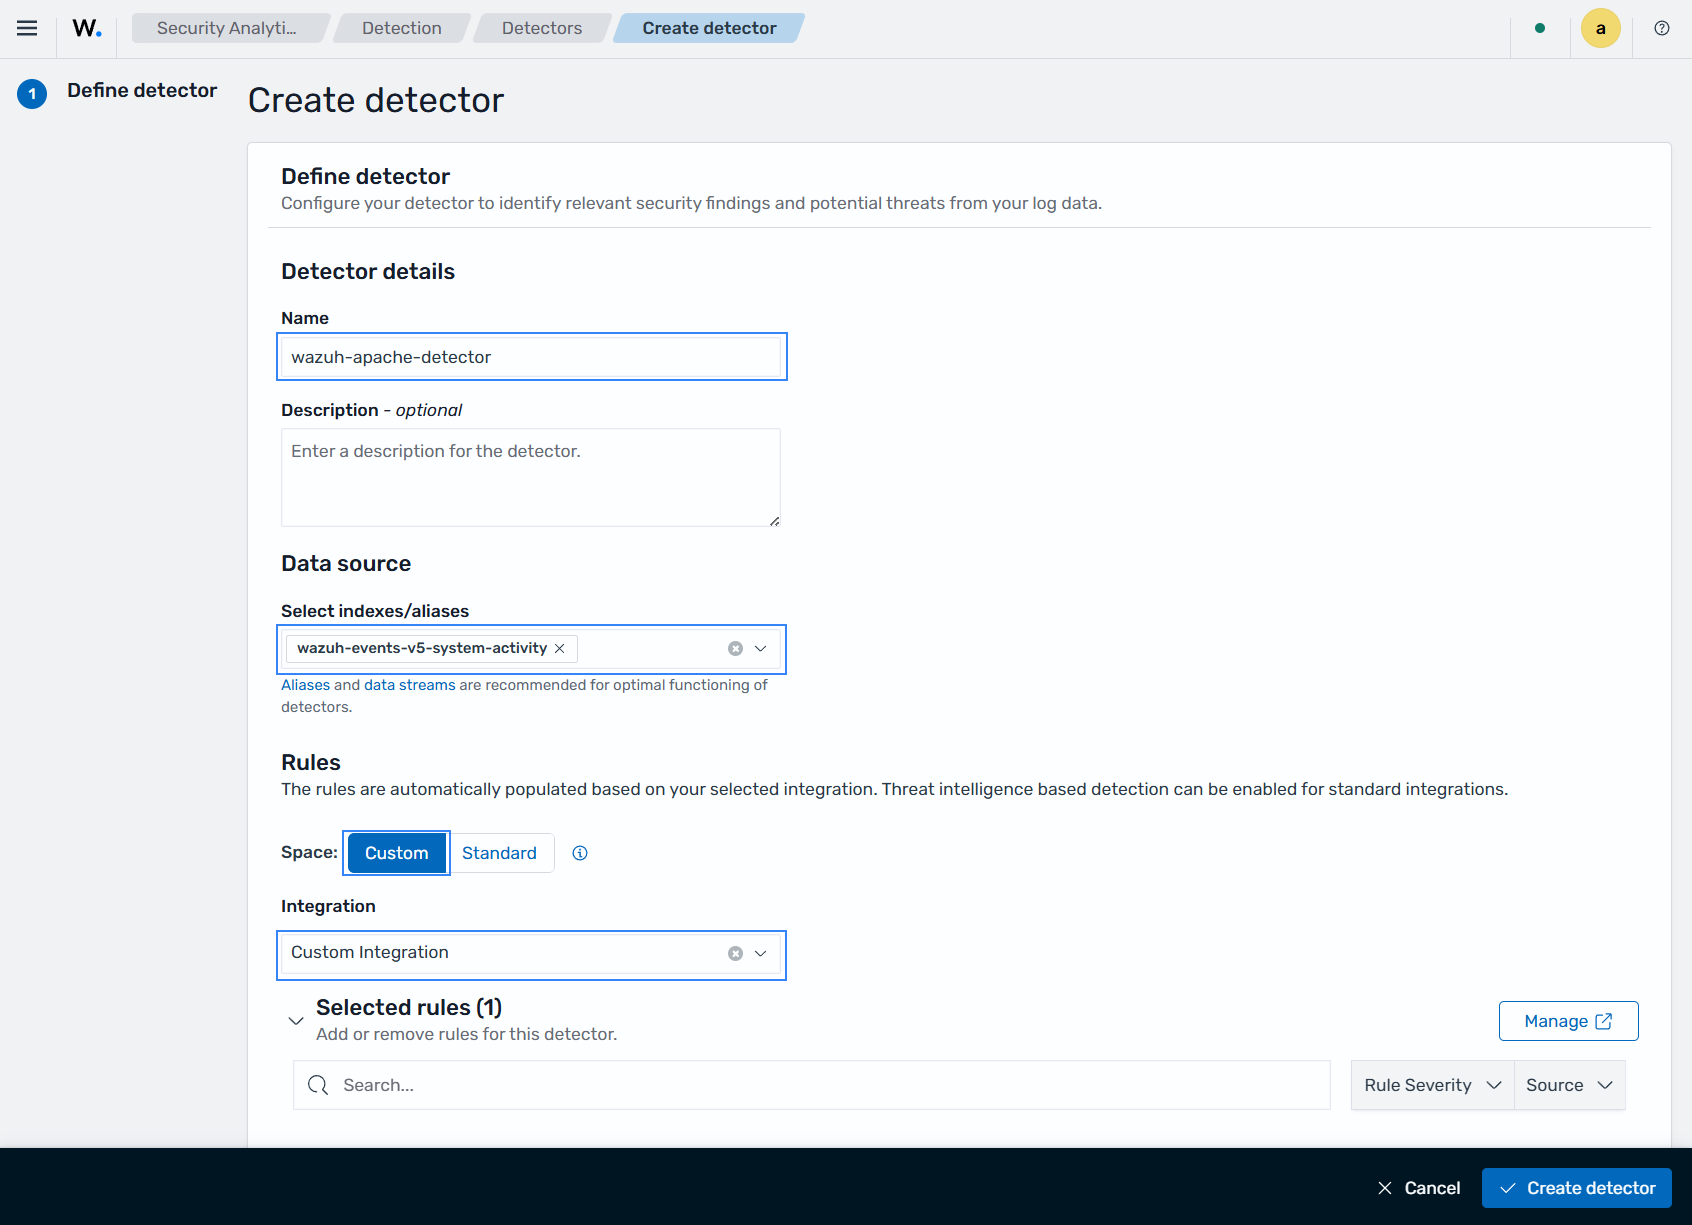
Go to Ruleset management > Detection > Detectors > Create detector.
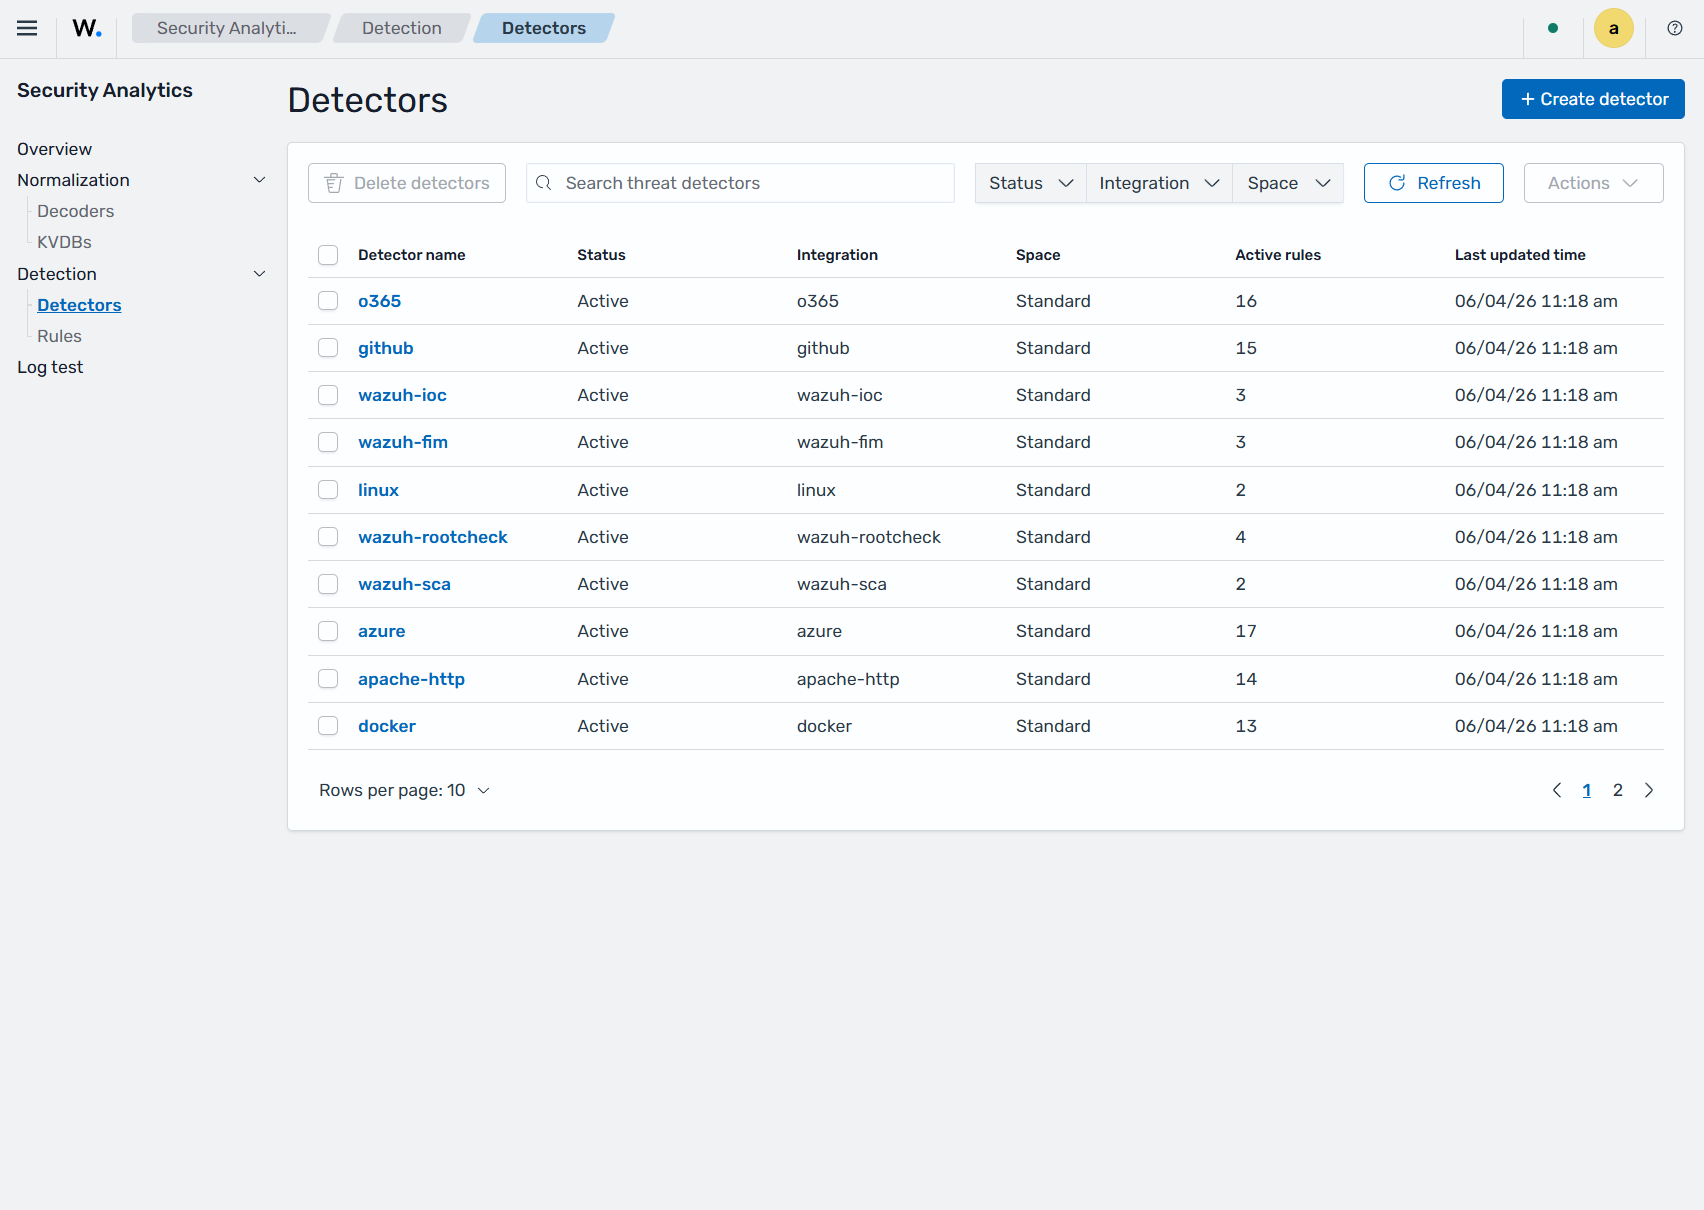
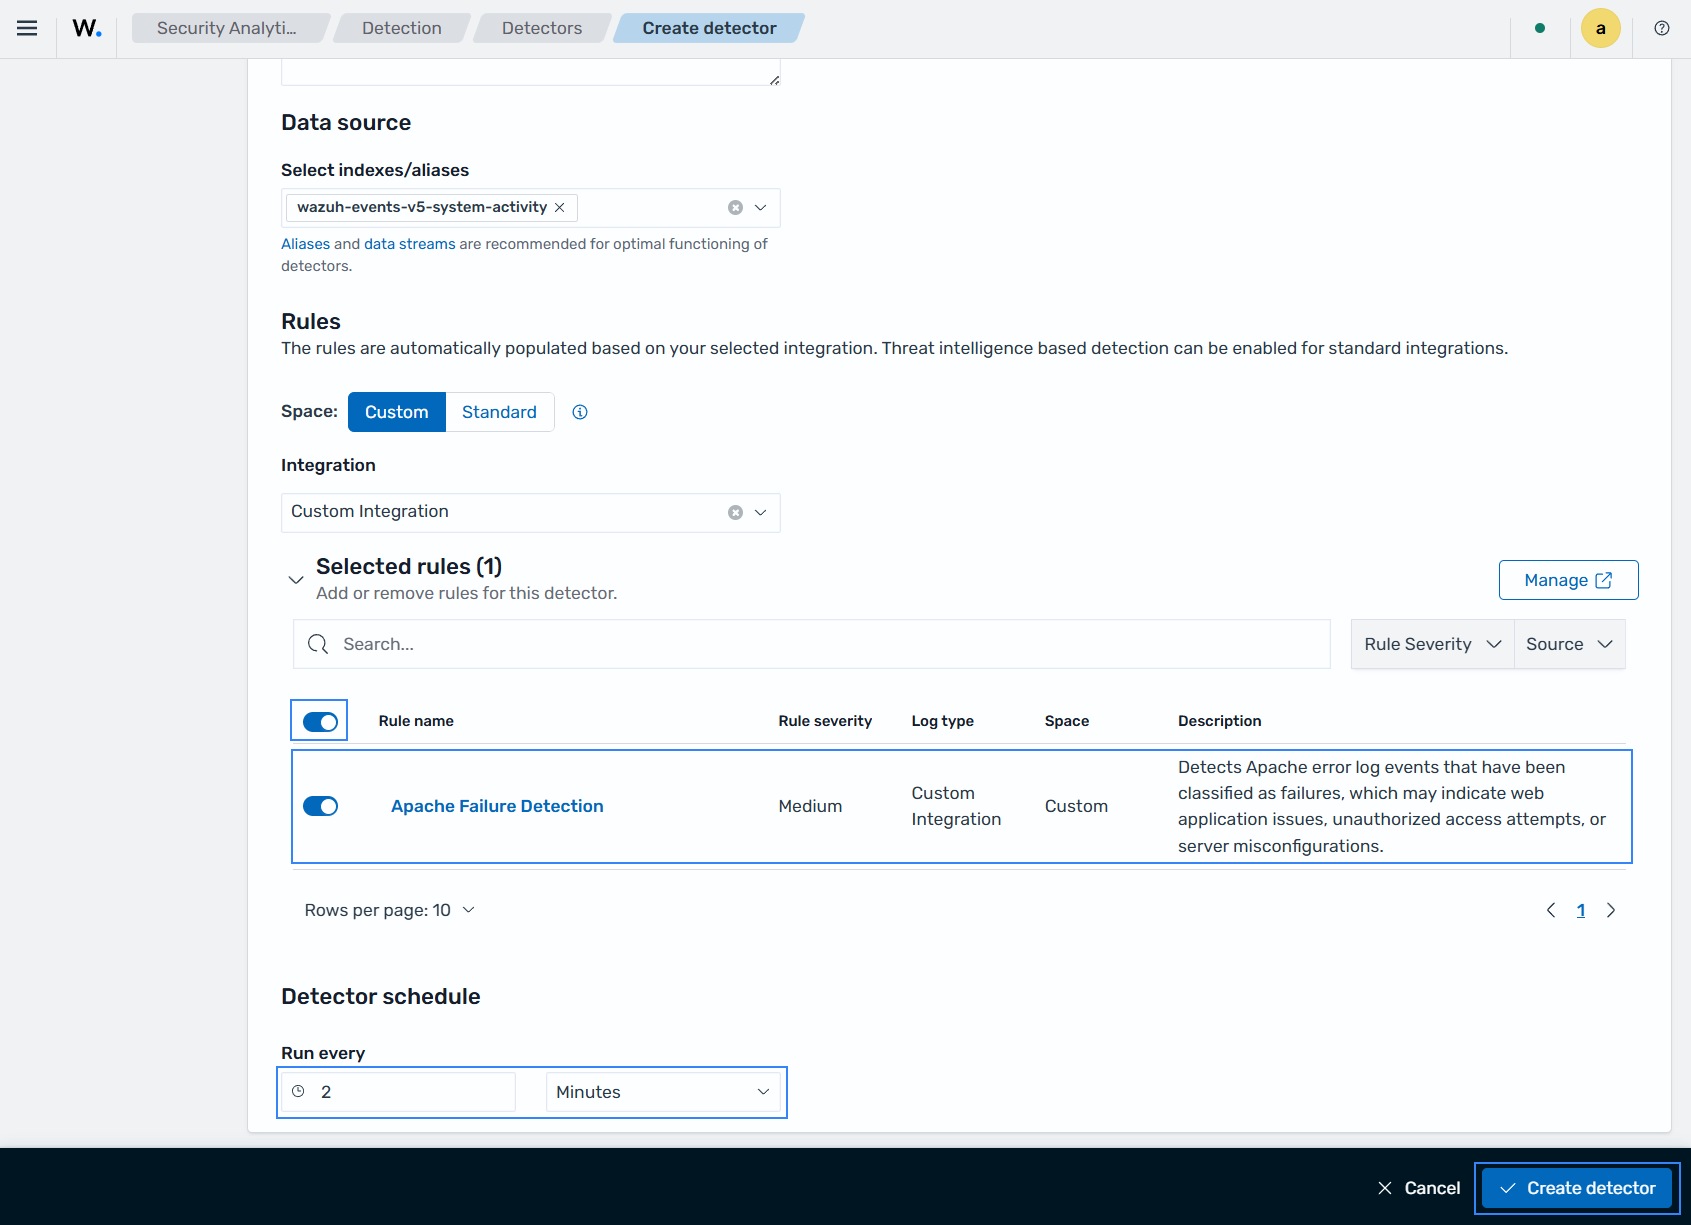
Fill the required sections with this information and click Create detector.
Name: wazuh-apache-detector
Select indexes/aliases: wazuh-events-v5-system-activity (this must match the integration category you configured earlier)
Space: Custom
Integration: custom-integration
Selected rules: Apache Failure Detection
Run every: 2 minutes.
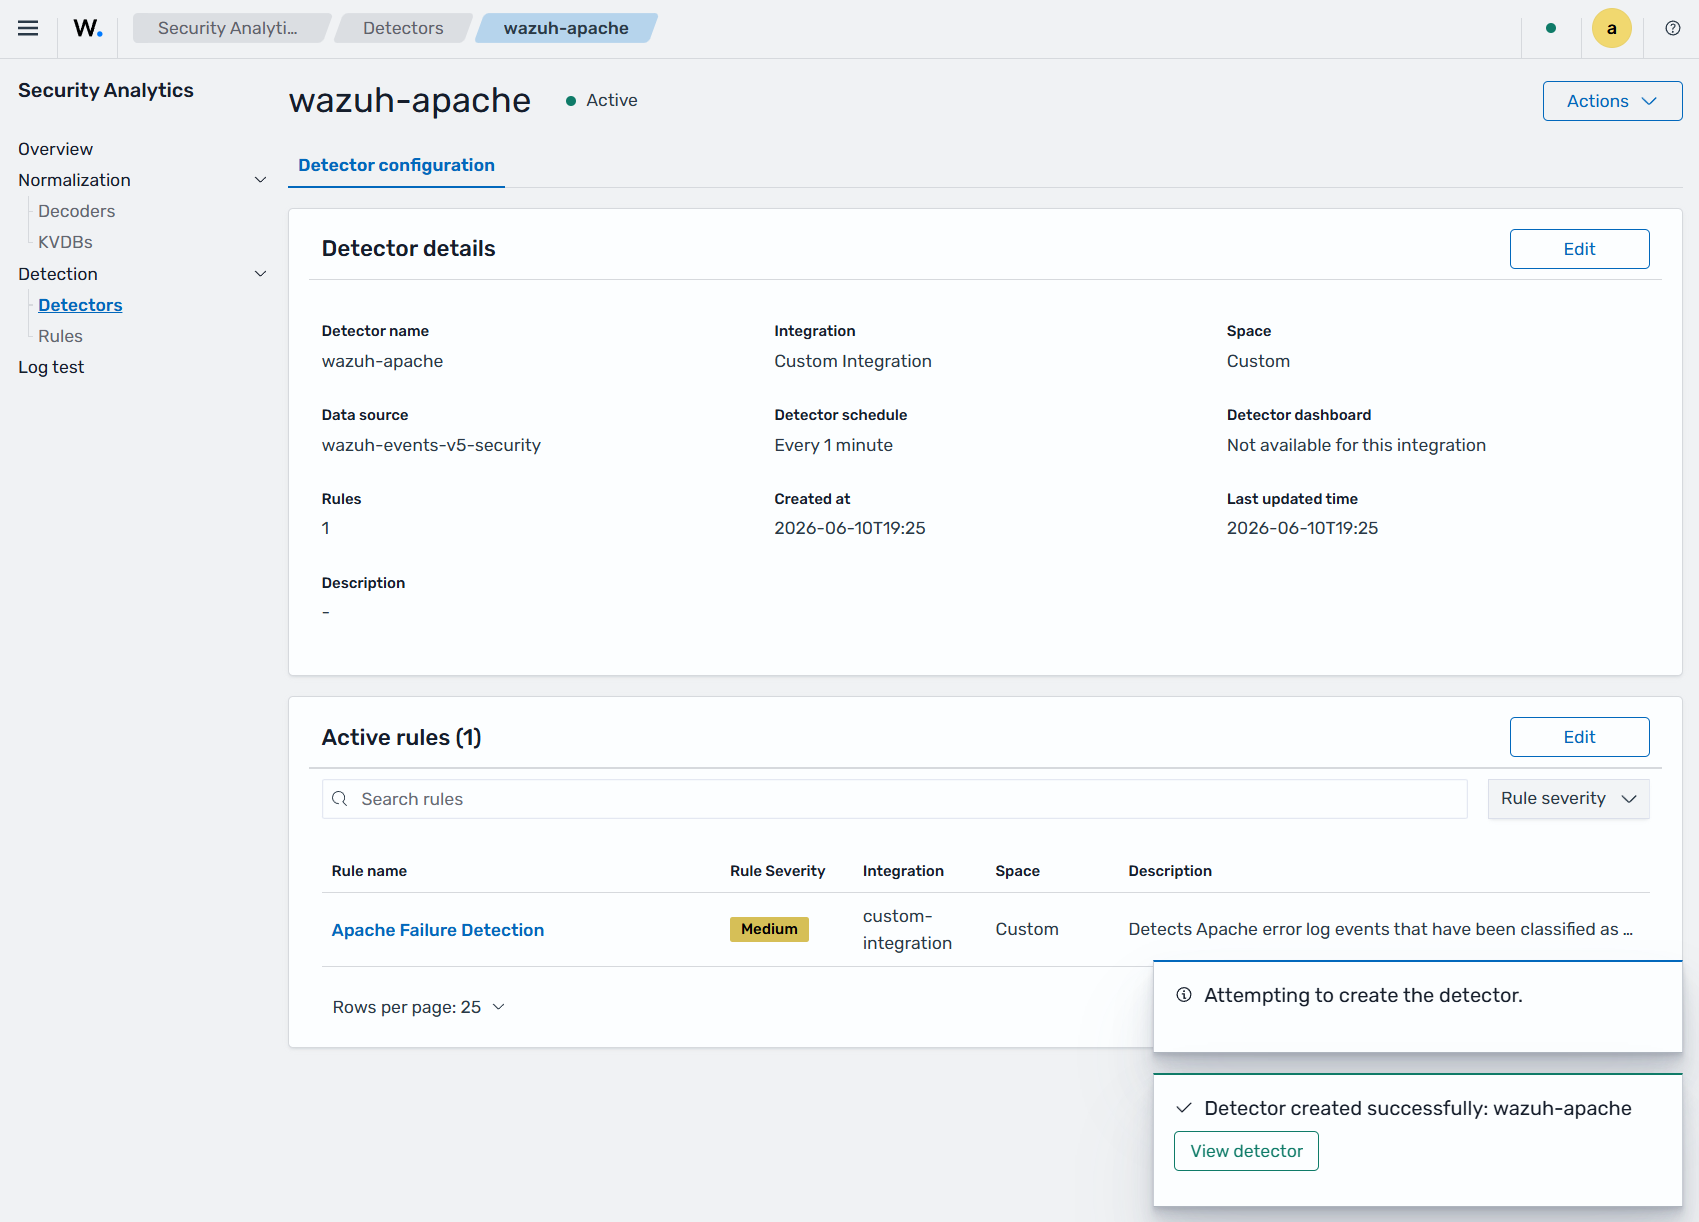
Once the detector is created, it appears in the Detectors list.
Configure the Wazuh agent to collect the Apache error log
The detector only generates findings from events that reach the Wazuh manager. Configure the Wazuh agent on the monitored endpoint to collect the Apache error log.
Append the following configuration to the
/var/ossec/etc/ossec.conffile on the monitored endpoint:<ossec_config> <localfile> <log_format>apache</log_format> <location>/var/log/apache2/error.log</location> </localfile> </ossec_config>
Restart the Wazuh agent to apply the changes:
# systemctl restart wazuh-agent
# service wazuh-agent restart
View findings on the Wazuh dashboard
A finding is a security record generated when an event matches a detection rule during normal processing by the Wazuh detection engine. Findings are indexed and displayed in the Wazuh dashboard for investigation and analysis. Follow these steps to view findings on the Wazuh dashboard.
Go to Threat intelligence > Threat Hunting > Findings.
In the image below, you see the findings generated from the events.
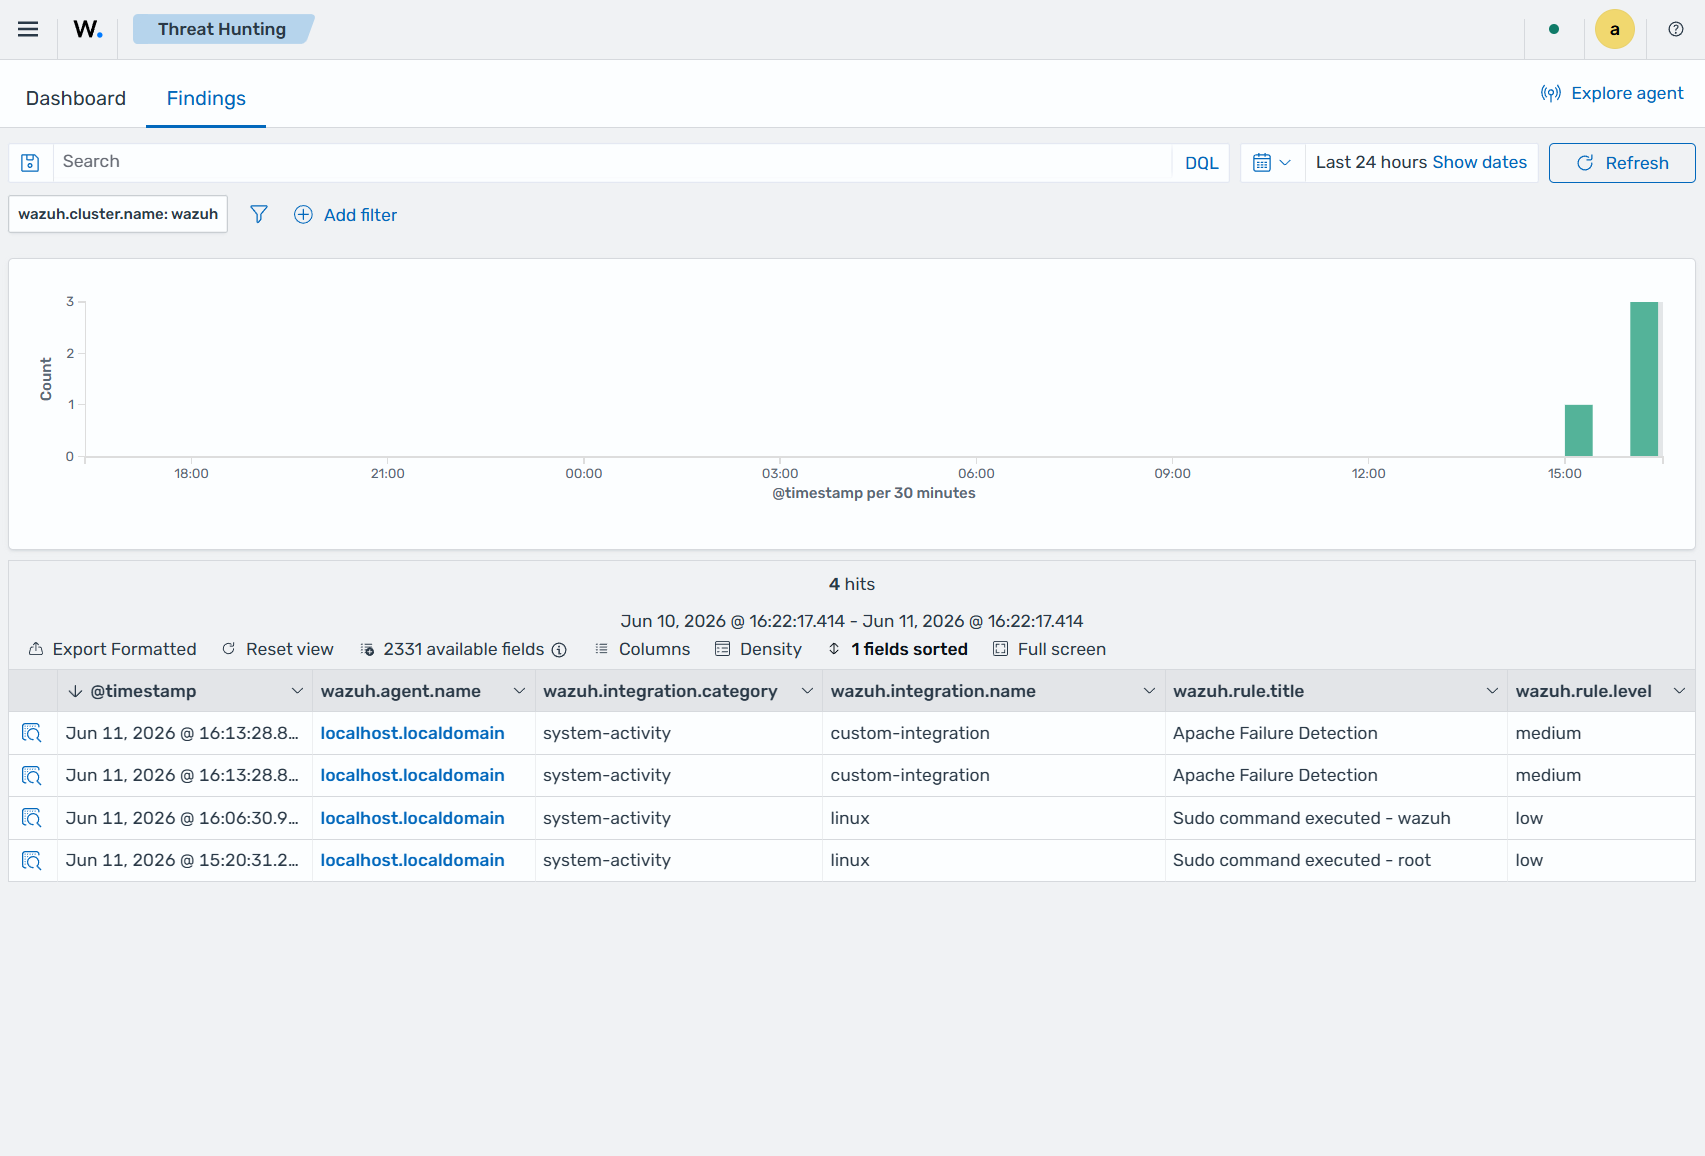
Expand the finding to see more information about the event.
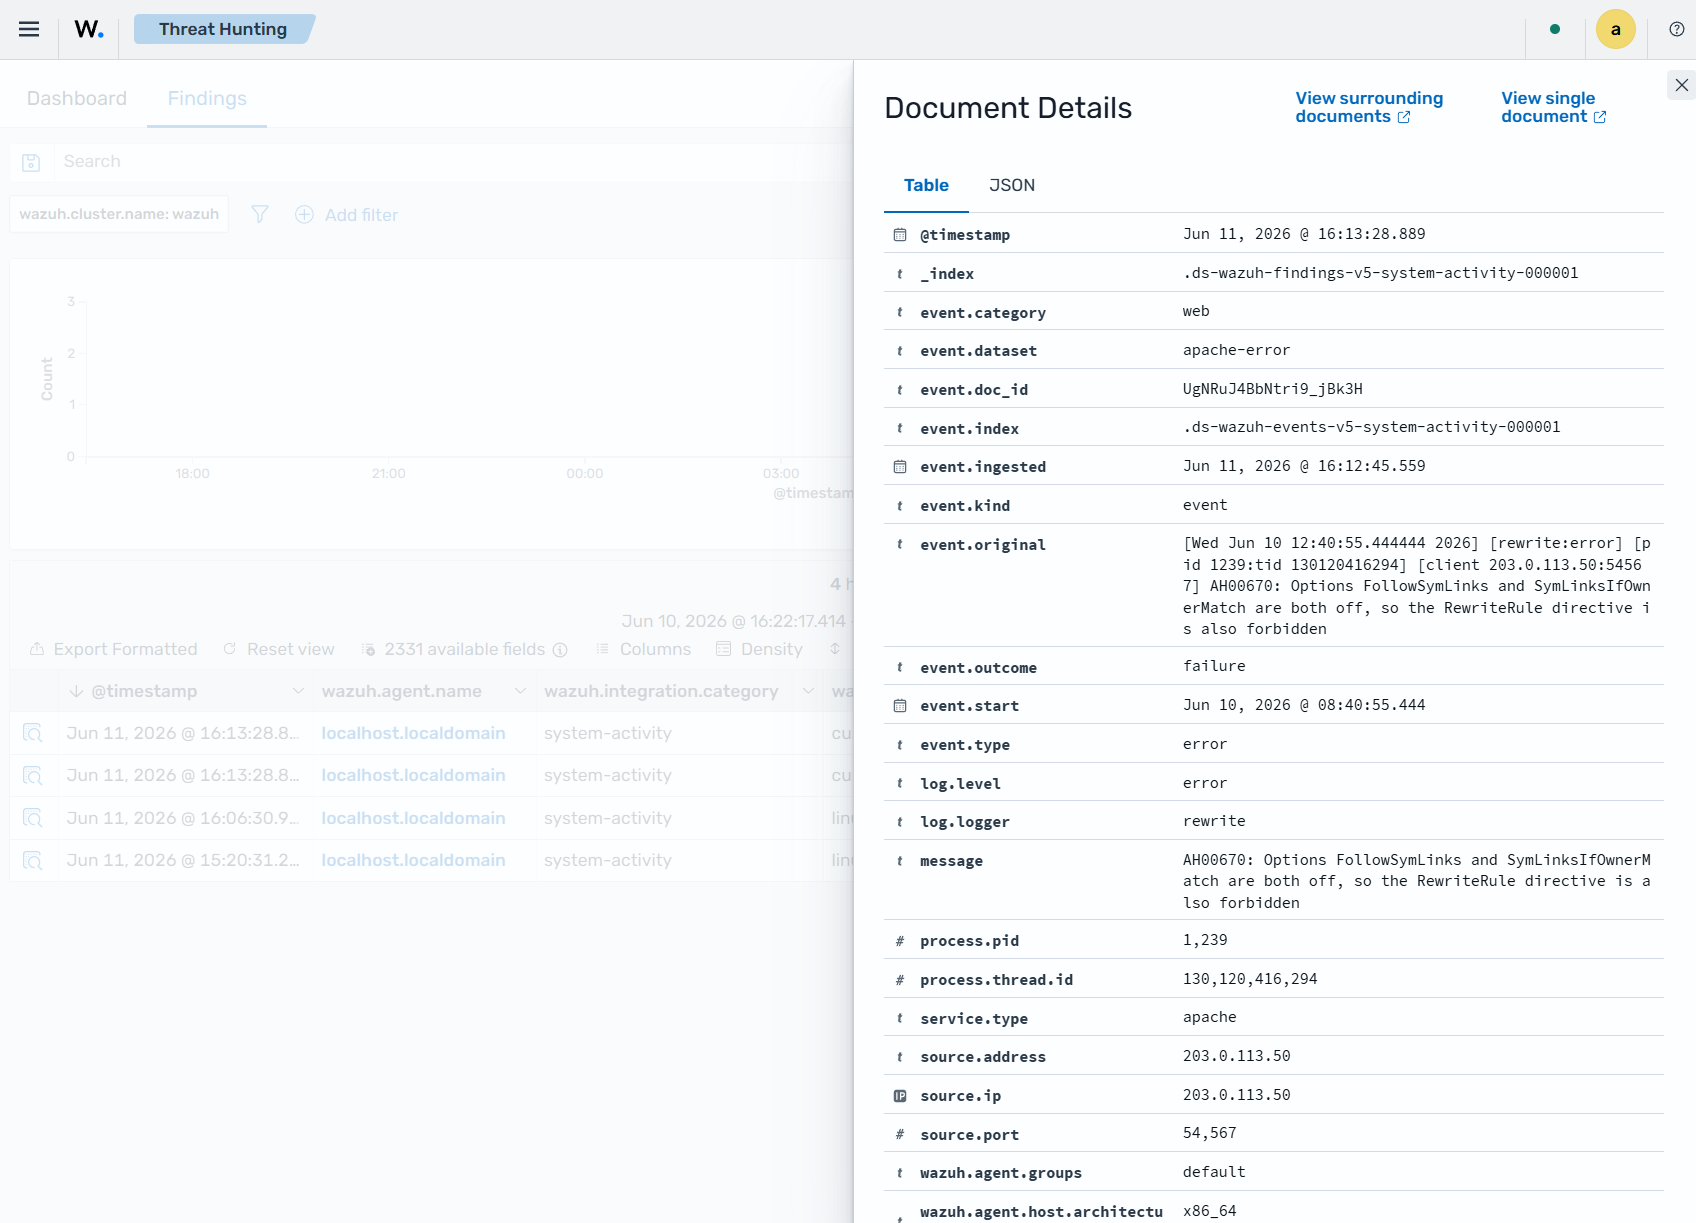
A single finding contains the complete enriched record, including the matched rule with its MITRE ATT&CK and compliance mappings, the originating agent and host, the source address, and the original log line. An example is shown below.
Example finding (expanded)
{
  "_index": ".ds-wazuh-findings-v5-system-activity-000001",
  "_id": "YANRuJ4BbNtri9_jjU2Q",
  "_score": null,
  "_source": {
    "process": {
      "pid": 1239,
      "thread": {
        "id": 130120416294
      }
    },
    "@timestamp": "2026-06-11T20:13:28.889318808Z",
    "log": {
      "level": "error",
      "logger": "rewrite"
    },
    "service": {
      "type": "apache"
    },
    "wazuh": {
      "cluster": {
        "node": "node01",
        "name": "wazuh"
      },
      "protocol": {
        "location": "/var/log/apache2/error.log",
        "queue": 49
      },
      "agent": {
        "host": {
          "hostname": "localhost.localdomain",
          "os": {
            "name": "CentOS Stream",
            "type": "linux",
            "version": "9",
            "platform": "centos"
          },
          "architecture": "x86_64"
        },
        "name": "localhost.localdomain",
        "groups": [
          "default"
        ],
        "id": "001",
        "version": "v5.0.0"
      },
      "integration": {
        "name": "custom-integration",
        "decoders": [
          "decoder/core-wazuh-message/0",
          "decoder/apache-error/0"
        ],
        "category": "system-activity"
      },
      "rule": {
        "sigma_id": "d78bd034-8838-4f85-b471-5e8c9a0daf18",
        "level": "medium",
        "compliance": {
          "pci_dss": [
            "10.2"
          ],
          "nist_800_53": [
            "AU-6"
          ]
        },
        "mitre": {
          "technique": [
            "T1190"
          ],
          "tactic": [
            "TA0001"
          ]
        },
        "id": "d78bd034-8838-4f85-b471-5e8c9a0daf18",
        "title": "Apache Failure Detection",
        "tags": [
          "medium",
          "custom-integration",
          "attack.initial-access",
          "attack.t1190"
        ],
        "status": "experimental"
      },
      "event": {
        "id": "4b72124c-f85c-4510-b069-d79831021fbf"
      },
      "space": {
        "name": "custom"
      }
    },
    "source": {
      "address": "203.0.113.50",
      "port": 54567,
      "ip": "203.0.113.50"
    },
    "event": {
      "ingested": "2026-06-11T20:12:45.559Z",
      "original": "[Wed Jun 10 12:40:55.444444 2026] [rewrite:error] [pid 1239:tid 130120416294] [client 203.0.113.50:54567] AH00670: Options FollowSymLinks and SymLinksIfOwnerMatch are both off, so the RewriteRule directive is also forbidden",
      "kind": "event",
      "start": "2026-06-10T12:40:55.444Z",
      "index": ".ds-wazuh-events-v5-system-activity-000001",
      "category": [
        "web"
      ],
      "type": [
        "error"
      ],
      "dataset": "apache-error",
      "doc_id": "UgNRuJ4BbNtri9_jBk3H",
      "outcome": "failure"
    },
    "message": "AH00670: Options FollowSymLinks and SymLinksIfOwnerMatch are both off, so the RewriteRule directive is also forbidden"
  },
  "fields": {
    "event.start": [
      "2026-06-10T12:40:55.444Z"
    ],
    "event.ingested": [
      "2026-06-11T20:12:45.559Z"
    ],
    "@timestamp": [
      "2026-06-11T20:13:28.889Z"
    ]
  },
  "sort": [
    1781208808889
  ]
}
This completes the workflow. You have created custom detection content, validated it, promoted it to production, and verified that it generates findings in the dashboard.