Blocking a known malicious actor
In this use case, we demonstrate how to block malicious IP addresses from accessing web resources on a web server monitored by a Wazuh agent. You set up Apache web servers on Ubuntu and Windows endpoints, and try to access them from a RHEL endpoint, which we use as the attacker.
A Key-Value Database (KVDB) is used to hold the IP addresses of malicious IP addresses. The RHEL endpoint plays the role of the malicious actor here; therefore, you add its IP address to the reputation database. Then, configure Wazuh to block the RHEL endpoint from accessing web resources on the Apache web server. This discourages attackers from continuing their malicious activities.
In this use case, you use the Wazuh KVDB and Active Response capabilities.
Infrastructure
Endpoint |
Description |
|---|---|
RHEL 9.0 |
Attacker endpoint connecting to the victim's web server, on which you use the Wazuh CDB list capability to flag its IP address as malicious. |
Ubuntu 24.04 |
Victim endpoint running an Apache 2.4.58 web server. Here, you use the Wazuh Active Response module to automatically block connections from the attacker endpoint. |
Windows 11 |
Victim endpoint running an Apache 2.4.54 web server. Here, you use the Wazuh Active Response module to automatically block connections from the attacker endpoint. |
Configuration
Ubuntu endpoint
Perform the following steps to install an Apache web server and monitor its logs with the Wazuh agent.
Update local packages and install the Apache web server:
$ sudo apt update
$ sudo apt install apache2
If the firewall is enabled, modify the firewall to allow external access to web ports. Skip this step if the firewall is disabled:
$ sudo ufw status
$ sudo ufw app list
$ sudo ufw allow 'Apache'
Check the status of the Apache service to verify that the web server is running:
$ sudo systemctl status apache2
Use the
curlcommand or openhttp://<UBUNTU_IP>in a browser to view the Apache landing page and verify the installation:$ curl http://<UBUNTU_IP>
Add the following to the
/var/ossec/etc/ossec.conffile to configure the Wazuh agent and monitor the Apache access logs:<localfile> <log_format>syslog</log_format> <location>/var/log/apache2/access.log</location> </localfile>
Restart the Wazuh agent to apply the changes:
$ sudo systemctl restart wazuh-agent
Windows endpoint
Perform the following steps to install and configure an Apache web server and a Wazuh agent to monitor Apache server events.
Install the latest Visual C++ Redistributable package.
Download the Apache web server Win64 ZIP installation file. This is a precompiled binary for Windows operating systems.
Unzip the contents of the Apache web server ZIP file and copy the extracted
Apache24folder to theC:directory.Navigate to the
C:\Apache24\bin\folder and run the following command in a PowerShell terminal with administrator privileges:> .\httpd.exe
The first time you run the Apache binary, a Windows Defender Firewall notification pops up.
Click on Allow Access. This allows the Apache HTTP server to communicate on your private or public networks depending on your network settings. It creates an inbound rule in your firewall to allow incoming traffic on port 80.
Open
http://<WINDOWS_IP>in a browser to view the Apache landing page and verify the installation. Also, verify that this URL can be reached from the attacker endpoint.Add the following to
C:\Program Files (x86)\ossec-agent\ossec.confto configure the Wazuh agent and monitor the Apache access logs:<localfile> <log_format>syslog</log_format> <location>C:\Apache24\logs\access_log</location> </localfile>
Restart the Wazuh agent in a PowerShell terminal with administrator privileges to apply the changes:
> Restart-Service -Name wazuh
Wazuh dashboard
Perform the following steps on the Wazuh dashboard to add the IP address of the RHEL endpoint to a KVDB, and then configure custom decoder, rules, and Active Response.
Decoders
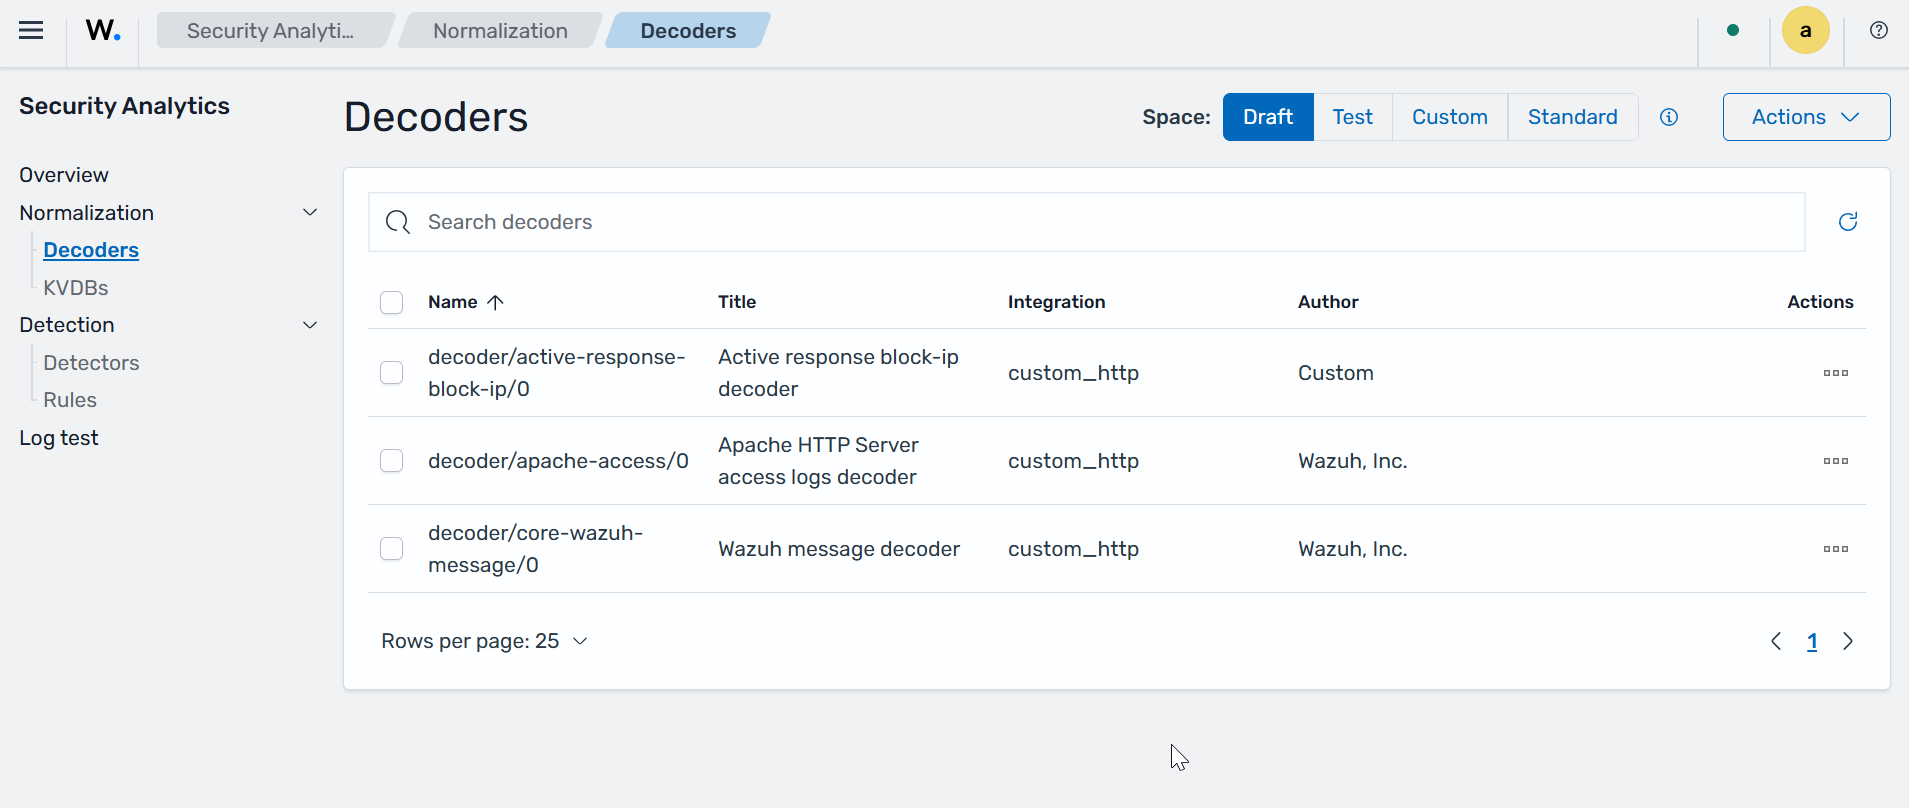
Navigate to Security analytics > Decoders.
Select the Draft space, then select Actions > Create.
Create an integration with the name custom_http using the Create integration button if you haven't created one before now. Select Network Activity as the Category and set a preferred name as the Author.
Input the decoder below and click the Create decoder button.
name: "decoder/core-wazuh-message/0"
metadata:
  author: "Wazuh, Inc."
  date: "2026-06-10T19:32:11Z"
  description: "Base decoder to process Wazuh message format, parses location part\
    \ and enriches the events that comes from a Wazuh agent with the host information."
  documentation: ""
  modified: "2026-06-10T19:32:11Z"
  references:
  - "https://documentation.wazuh.com/"
  supports: []
  title: "Wazuh message decoder"
normalize:
- map:
  - _tmp_json: "parse_json($event.original)"
enabled: true
Repeat step 2, then input the decoder below and click the Create decoder button.
---
name: "decoder/apache-access/0"
metadata:
  author: "Wazuh, Inc."
  date: "2026-07-09T13:25:54Z"
  description: "Decoder for Apache HTTP Server access logs."
  documentation: ""
  modified: "2026-07-10T13:49:08Z"
  references:
  - "https://httpd.apache.org/docs/2.4/logs.html"
  supports: []
  title: "Apache HTTP Server access logs decoder"
parents:
- "decoder/core-wazuh-message/0"
parse|event.original:
- "<destination.domain> <source.address> - <user.name> [<event.start/ANSIC>] \"<~/literal/->?<_http_request>\"\
  \ <http.response.status_code> <http.response.body.bytes>?<~/literal/-> \"<http.request.referrer>\"\
  \ \"<user_agent.original>\""
- "<destination.domain> <source.address> - <user.name> [<event.start/HTTPDATE>] \"\
  <~/literal/->?<_http_request>\" <http.response.status_code> <http.response.body.bytes>?<~/literal/->\
  \ \"<http.request.referrer>\" \"<user_agent.original>\""
- "<source.address> - <user.name> [<event.start/HTTPDATE>] \"<_http_request>\" <http.response.status_code>\
  \ <_ignore/literal/->?<http.response.body.bytes>(? \"<http.request.referrer>\" \"\
  <user_agent.original>\")"
- "<source.address> - <user.name> [<event.start/HTTPDATE>] \"-\" <http.response.status_code>\
  \ -"
- "<source.address> - - [<event.start/ANSIC>] \"-\" <http.response.status_code> -"
- "<source.address> - - [<event.start/ANSIC>] \"<~/literal/->?<_http_request>\" <http.response.status_code>\
  \ <http.response.body.bytes>?<~/literal/-> \"<http.request.referrer>\" \"<user_agent.original>\""
- "<source.address> - <user.name> [<event.start/ANSIC>] \"<~/literal/->?<_http_request>\"\
  \ <http.response.status_code> <http.response.body.bytes>?<~/literal/-> \"<http.request.referrer>\"\
  \ \"<user_agent.original>\""
- "[<event.start/ANSIC>] <source.address> <network.protocol> <tls.cipher> \"<_http_request>\"\
  \ <http.response.body.bytes>?<~/literal/->"
- "[<event.start/HTTPDATE>] <source.address> <network.protocol> <tls.cipher> \"<_http_request>\"\
  \ <http.response.body.bytes>?<~/literal/->"
- "<source.address> - - [<event.start/HTTPDATE>] \"<~/literal/->?<_http_request>\"\
  \ <http.response.status_code> <http.response.body.bytes>?<~/literal/-> \"<http.request.referrer>\"\
  \ \"<user_agent.original>\" \"-\""
- "<source.address> - <user.name> [<event.start/HTTPDATE>] \"<~/literal/->?<_http_request>\"\
  \ <http.response.status_code> <http.response.body.bytes>?<~/literal/-> \"<http.request.referrer>\"\
  \ \"<user_agent.original>\" X-Forwarded-For=\"<?_forwarded_for>\""
- "<source.address> - <user.name> [<event.start/HTTPDATE>] \"<~/literal/->?<_http_request>\"\
  \ <http.response.status_code> <http.response.body.bytes>?<~/literal/-> \"<http.request.referrer>\"\
  \ \"<user_agent.original>"
normalize:
- map:
  - event.category: "array_append(web)"
  - event.type: "array_append(access)"
  - event.action: "http-request"
  - event.dataset: "apache-access"
  - event.kind: "event"
  - service.type: "apache"
  - source.ip: "$source.address"
  - _tls: "split($network.protocol, 'v')"
  - _tls_1: "$_tls.1"
  - _client_ip: "split($_forwarded_for, ',')"
  - client.ip: "$_client_ip.0"
  - network.forwarded_ip: "$_client_ip.0"
  - tls.version_protocol: "$_tls.0"
  - tls.cipher: "$tls.cipher"
  - threat.indicator.description: "kvdb_get('malicious_IPs', $source.ip)"
  parse|_http_request:
  - "<http.request.method> <url.original> HTTP/<http.version>"
- check:
  - _tls_1: "regex_match(\\\\d+\\\\.\\\\d+)"
  map:
  - tls.version: "$_tls_1"
- check:
  - _tls_1: "regex_not_match(\\\\d+\\\\.\\\\d+)"
  map:
  - tls.version: "concat_any($_tls_1, '.0')"
- check: "int_less($http.response.status_code, 400)"
  map:
  - event.outcome: "success"
- check: "int_greater_or_equal($http.response.status_code, 400)"
  map:
  - event.outcome: "failure"
- check:
  - source.ip: "not_exists()"
  map:
  - source.domain: "parse_fqdn($source.address)"
- map:
  - url.extension: "regex_extract($url.original, '.*\\\\.([a-zA-Z0-9]+)(?:\\\\?|$)')"
  - url.path: "$url.original"
  - url.query: "regex_extract($url.original, '\\\\?(.*)')"
  - url.domain: "$destination.domain"
enabled: true
id: "ca15b457-93e8-4856-ae88-cd03e386fc76"
Repeat step 2 then input the decoder below and click the Create decoder button.
---
name: "decoder/active-response-block-ip/0"
metadata:
  author: "Custom"
  date: "2026-07-11T02:03:54Z"
  description: "Decoder for active-response block-ip script logs."
  documentation: ""
  modified: "2026-07-11T02:27:29Z"
  references:
  - ""
  supports: []
  title: "Active response block-ip decoder"
parents:
- "decoder/core-wazuh-message/0"
parse|event.original:
- "<_raw_timestamp> active-response/bin/block-ip: [<log.level>] Method=<_method> Action=<_action>\
  \ Details=IP <source.ip> successfully blocked"
normalize:
- map:
  - event.start: "parse_date($_raw_timestamp, '%Y/%m/%d %H:%M:%S')"
  - event.category: "array_append(network)"
  - event.type: "array_append(denied)"
  - event.action: "block-ip"
  - event.dataset: "active-response-block-ip"
  - event.kind: "alert"
  - event.module: "active-response"
  - service.type: "active-response"
  - network.protocol: "$_method"
- check:
  - _action: "success"
  map:
  - event.outcome: "success"
- check:
  - _action: "regex_not_match(success)"
  map:
  - event.outcome: "failure"
enabled: true
KVDBs
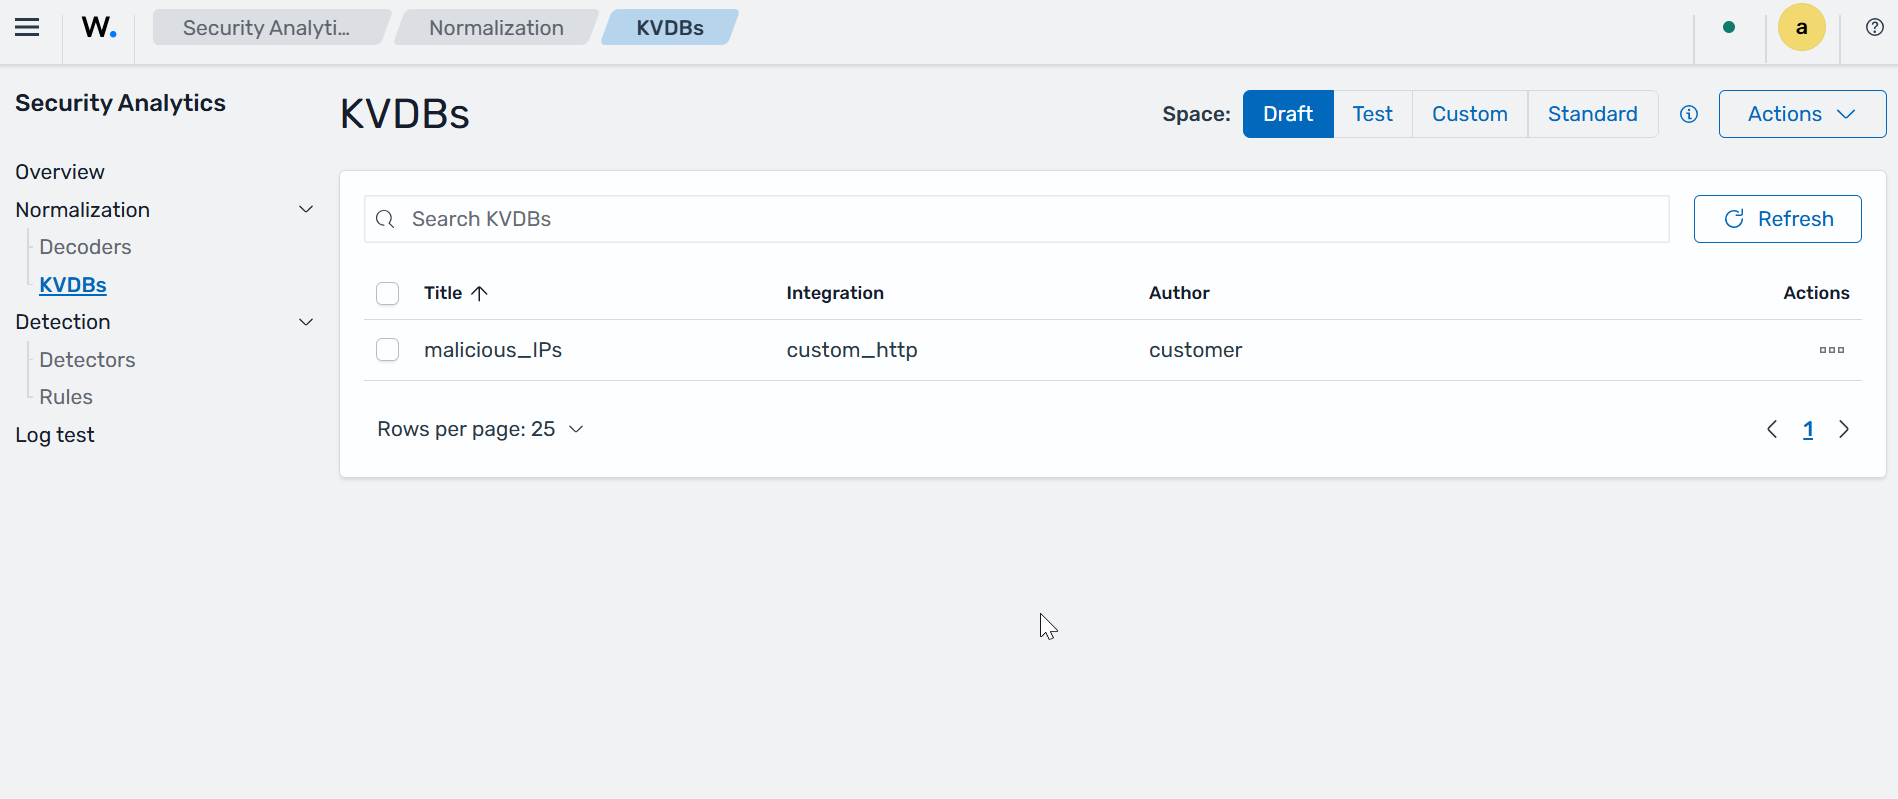
Navigate to Security Analytics > KVDBs. Ensure you are in the Draft space, click on Actions, and select Create. Fill in the following parameters:
Field
Value
Integrationcustom_httpTitlemalicious_IPsAuthorcustomerDescriptionA list of malicious IPs
Click Add under the Content section, then add the
<RHEL_IP>as Key and malicious as Value.Click on Create KVDB.
Rules
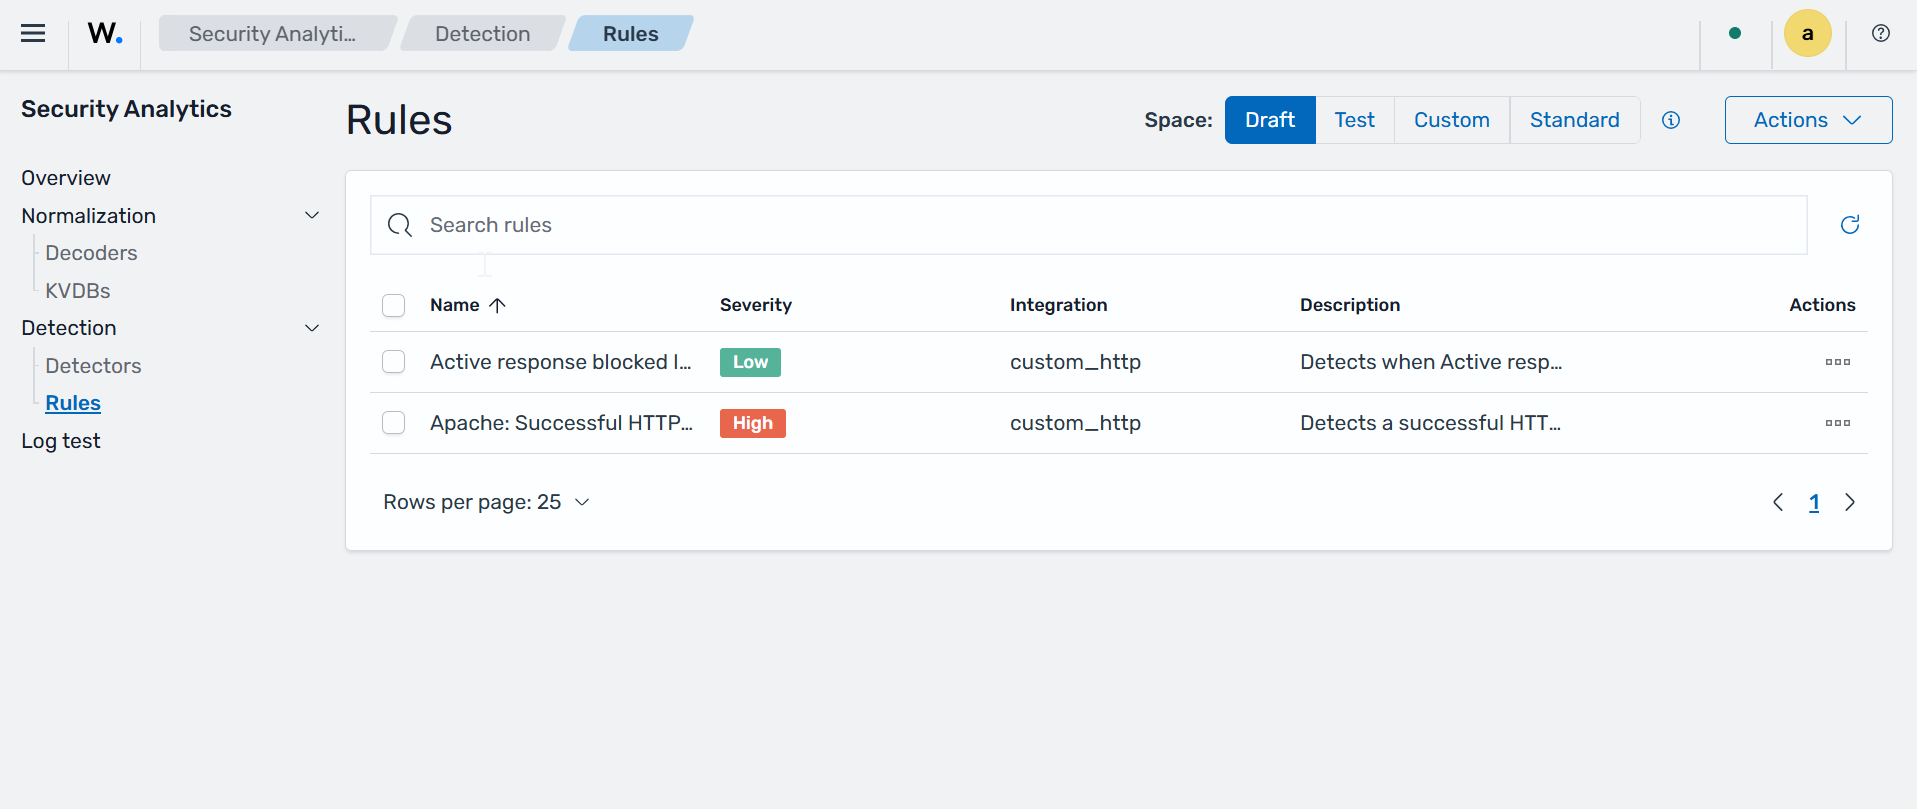
Navigate to Security analytics > Rules. Select the Draft space, then select Actions > Create.
Switch to the YAML editor, select the custom HTTP integration, then input the rule below and click the Create rule button.
logsource:
  product: custom_http
tags: []
falsepositives:
  - Normal web traffic
level: high
status: stable
enabled: true
detection:
  condition: selection
  selection:
    event.dataset:
      - apache-access
    event.outcome:
      - success
    threat.indicator.description|all:
      - malicious
metadata:
  title: 'Apache:  Successful HTTP connection from malicious IP'
  author: Custom
  description: >-
    Detects a successful HTTP request/response cycle on the Apache web server,
    where the response status code is below 400 and the source IP is contained in the malicious IP KVDB.
  references:
    - ''
  documentation: ''
  supports:
    - ''
  modified: '2026-07-10T14:24:11Z'
Repeat step 1, Switch to the YAML editor, select the custom HTTP integration, then input the rule below and click the Create rule button:
logsource:
  product: custom_http
tags: []
falsepositives: []
level: low
status: stable
enabled: true
detection:
  condition: Selection_1
  Selection_1:
    event.dataset|all:
      - active-response-block-ip
    event.outcome|all:
      - success
metadata:
  title: Active response blocked IP - {{source.ip}}
  author: custom
  description: >-
    Detects when Active response successfully blocks an IP.
  references:
    - ''
  documentation: ''
  supports:
    - ''
  modified: '2026-07-11T03:24:01Z'
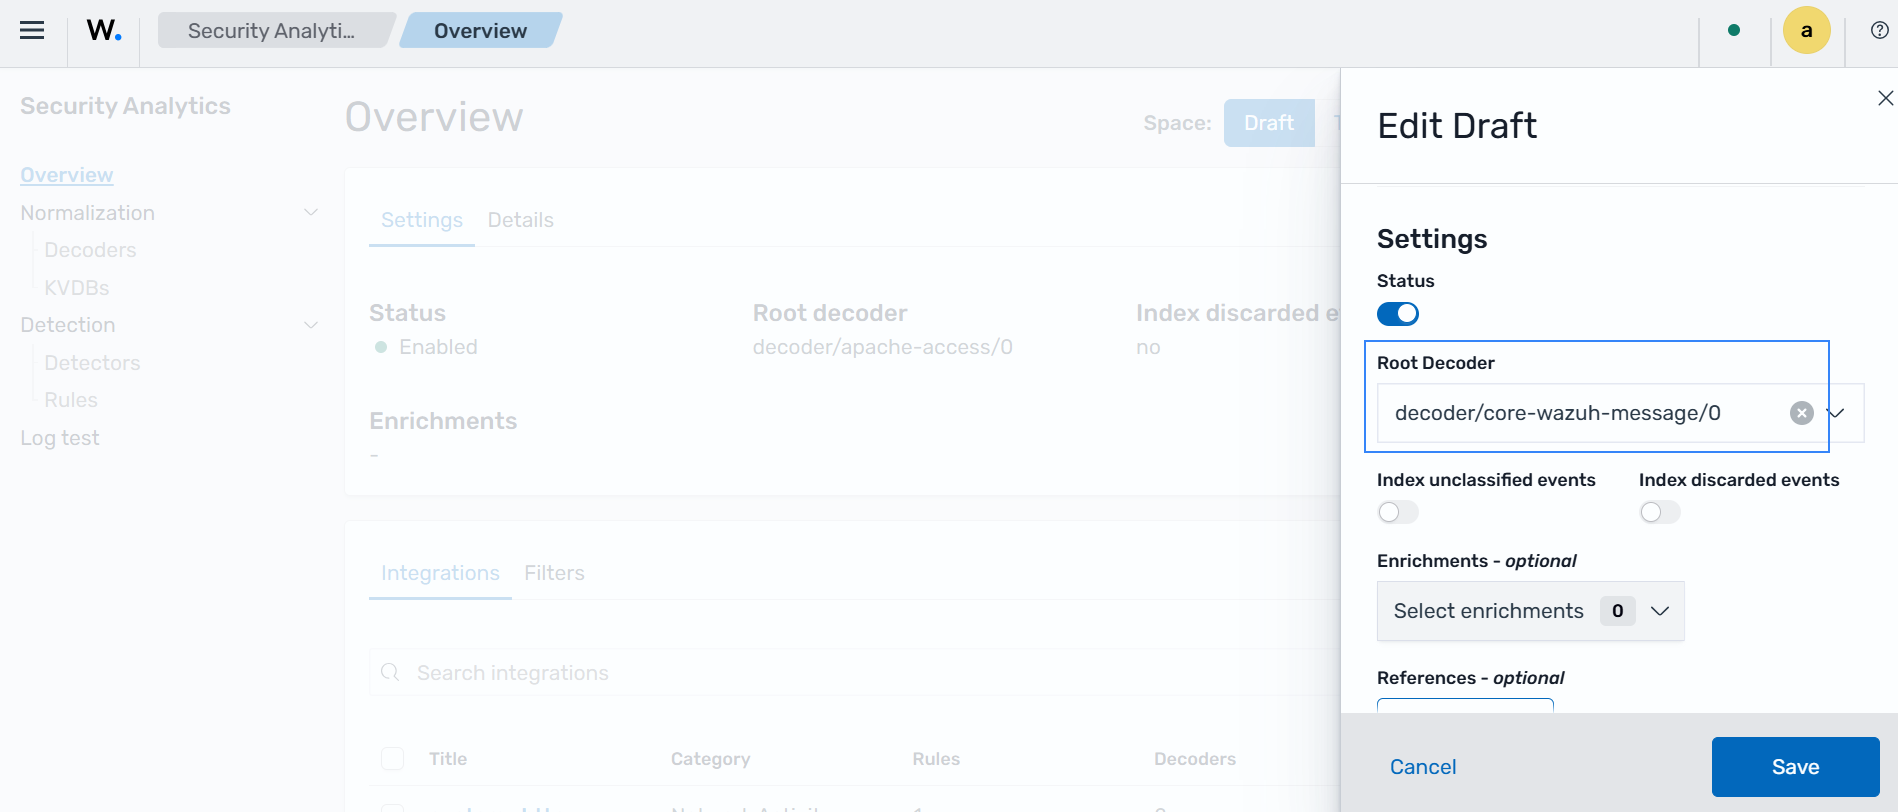
Navigate to Security analytics > Overview > Actions > Edit. Select the decoder/core-wazuh-message/0 decoder under the Root Decoder field, then click Save.
Navigate to Security analytics > Overview, then click Actions > Promote. Type the confirmation message when prompted, and click Promote. This promotes the created assets from the Draft user space to the Test user space.
Select the Test space, then click Actions > Promote. Type the confirmation message when prompted, and click Promote. This promotes the created assets from the Test user space to the Custom user space.
Detector
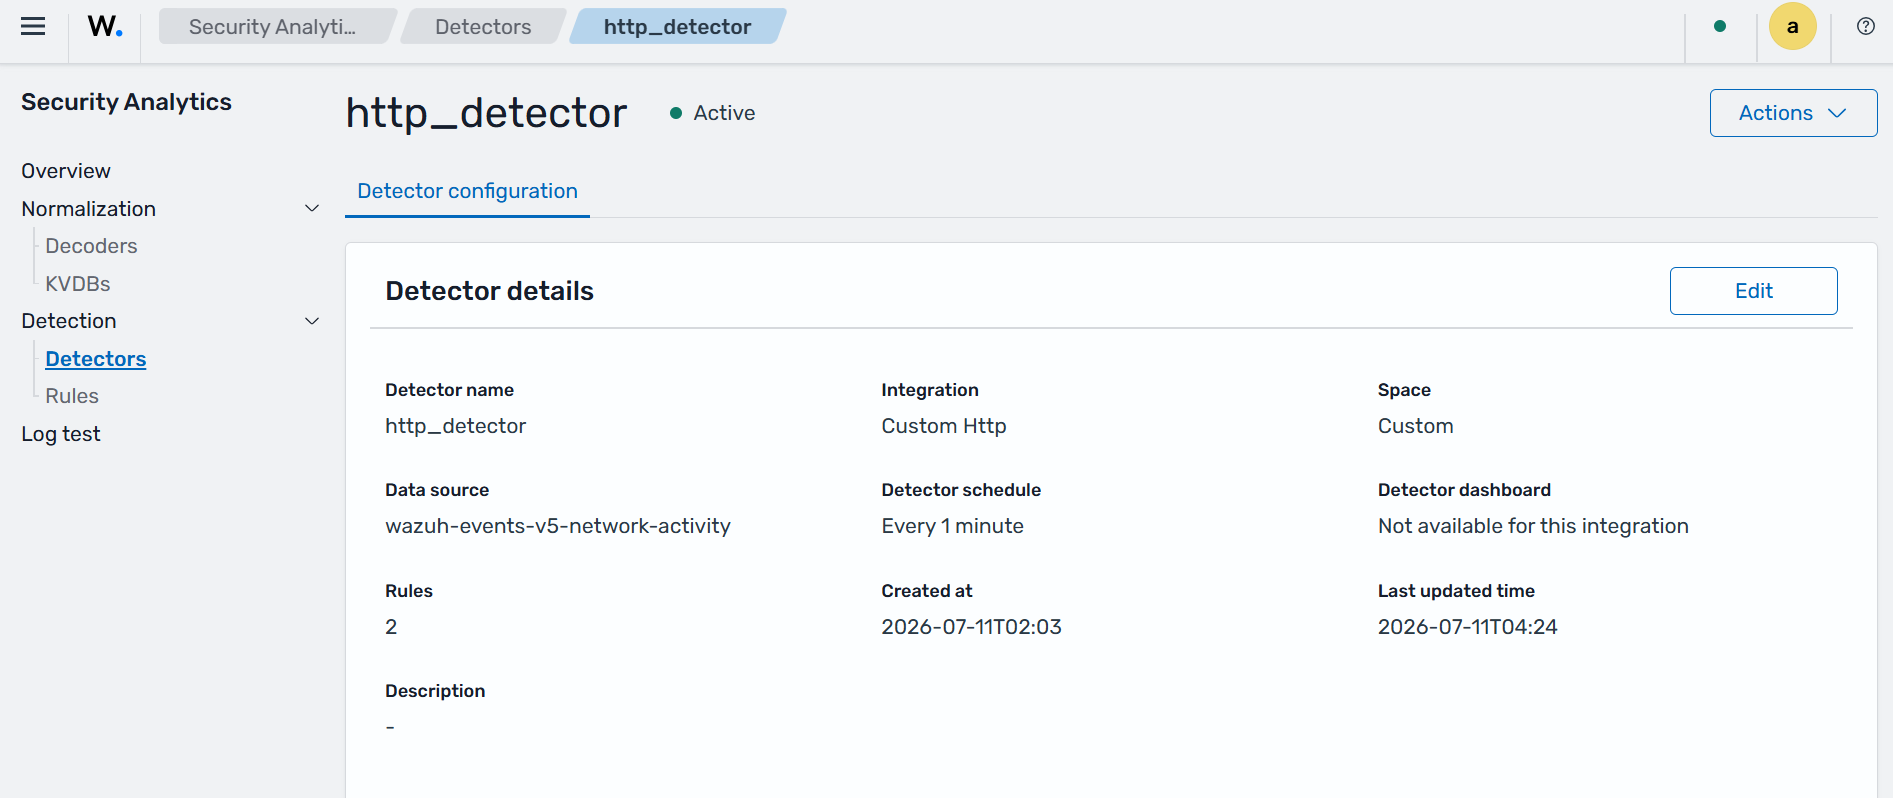
Navigate to Security analytics > Detectors, then click Create detector.
Set the value of the Name field to http_detector, then click the Data source drop-down and select wazuh-events-v5-network-activity as the indexes/aliases.
Change the space to Custom in the Rules section, then select custom_http from the Integration drop-down.
Click on Create detector to create the detector.
Active response
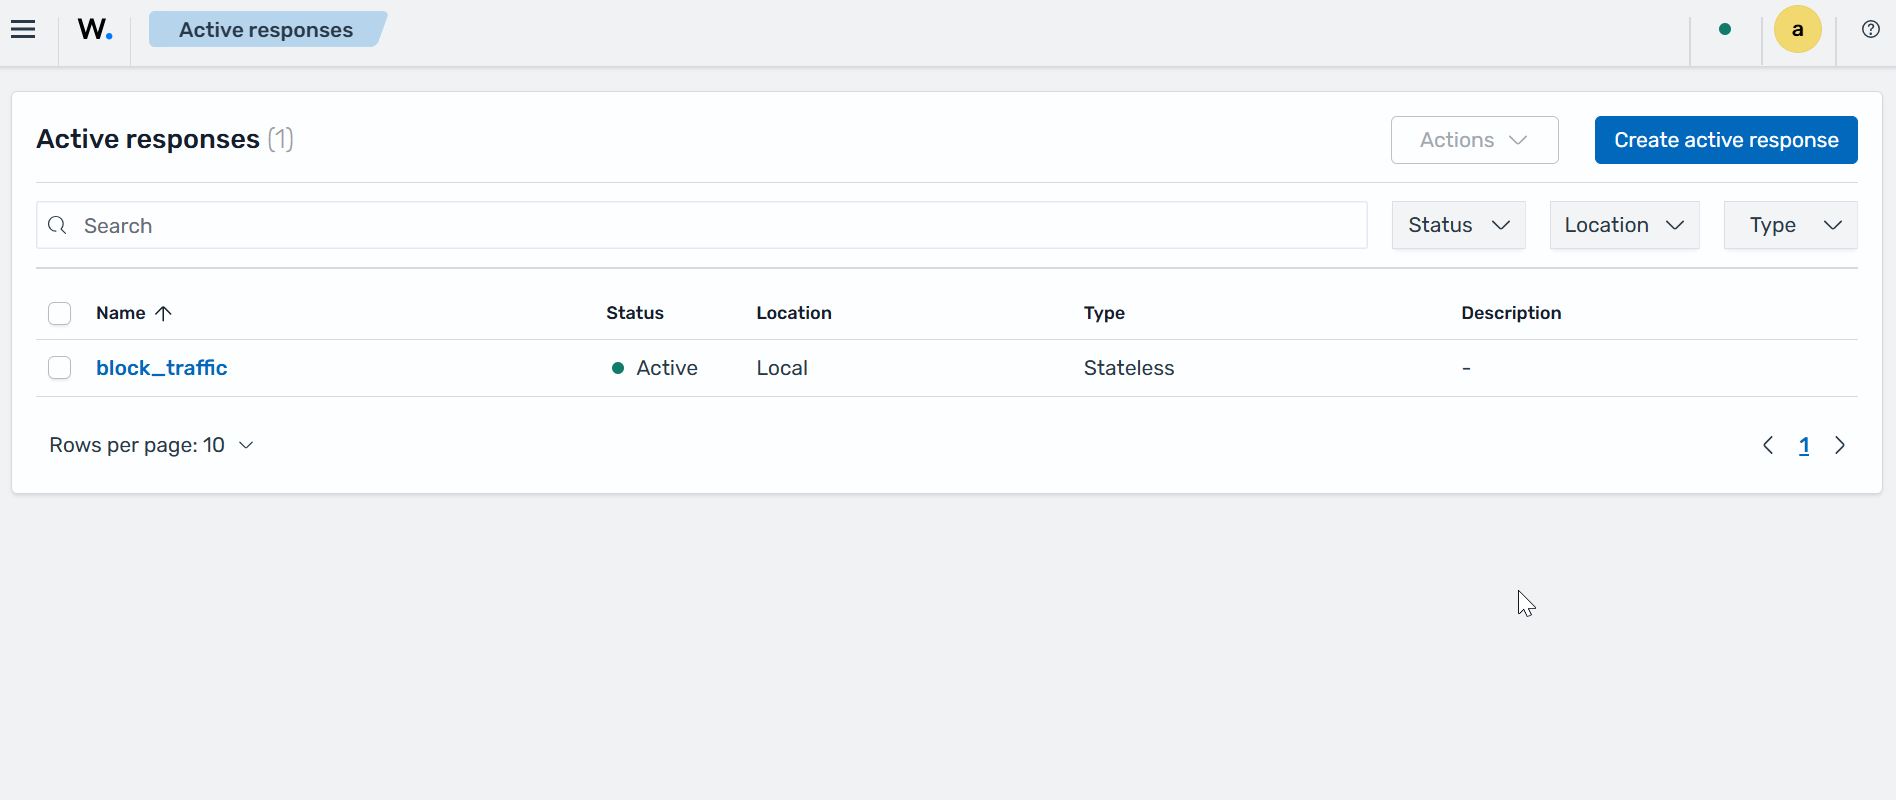
Navigate to Explore > Active Responses, then click Create active response. Fill in the following parameters:
Field
Value
Nameblock_trafficDescriptionAdds a referenced IP address to the firewall's blocklist
Executableblock-ipClick Create to create the Active Response.
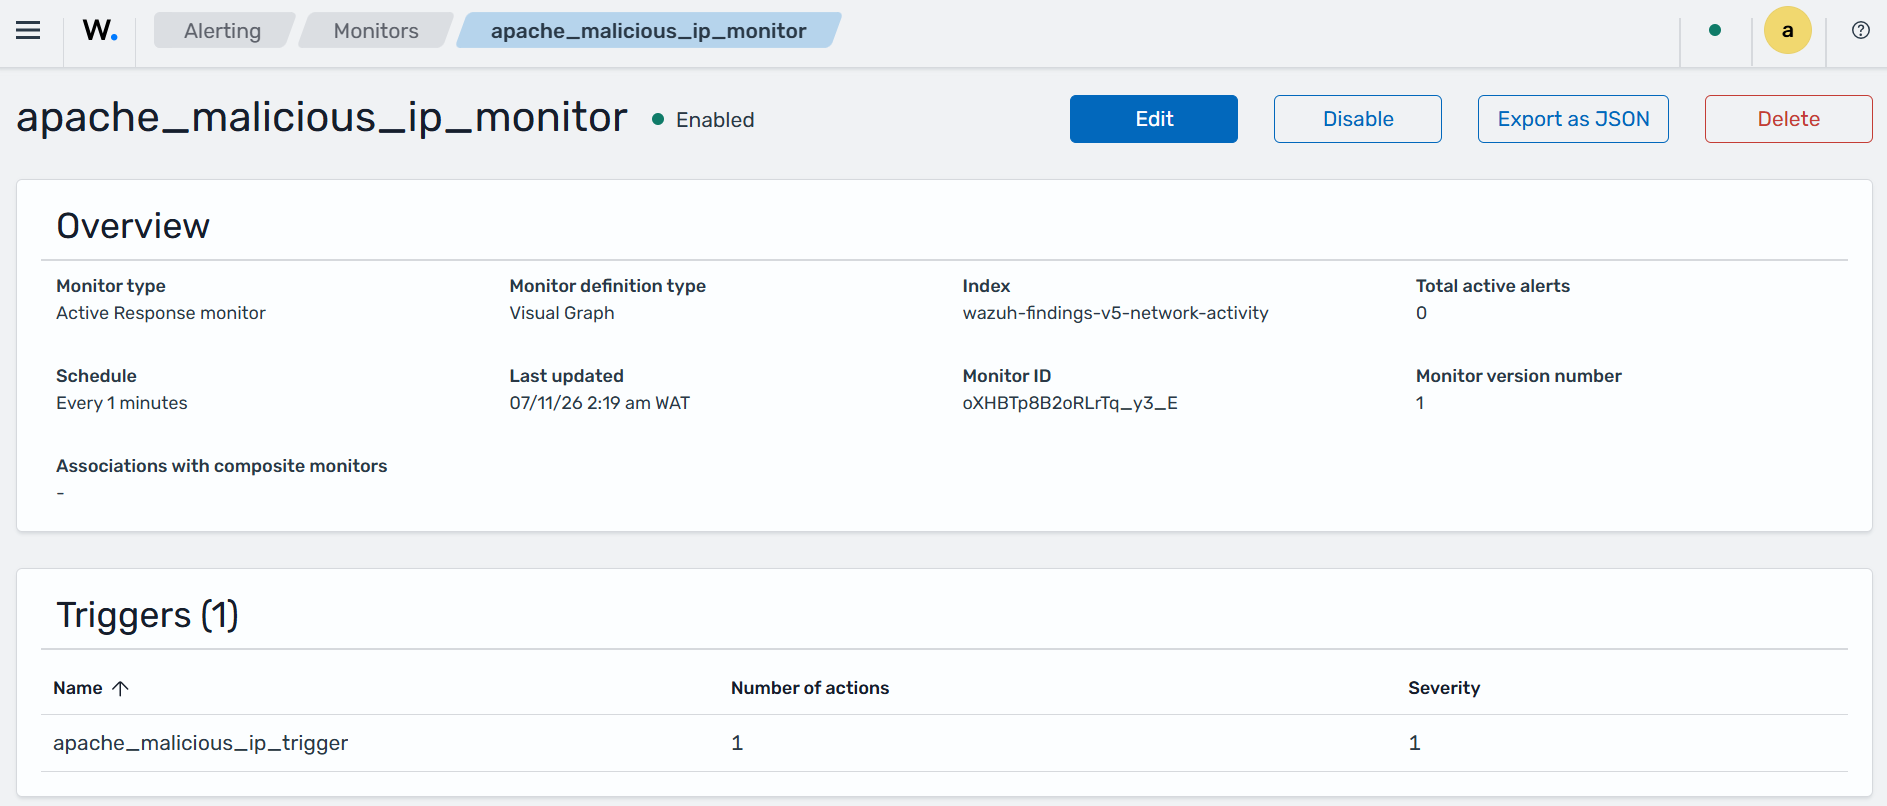
Navigate to Explore > Alerting. Switch to the Monitors tab, then select Create Monitor. Fill in the following parameters:
Field
Value
Monitor nameapache_malicious_ip_monitorMonitor typeActive responseMonitor defining methodVisual editorFrequencyBy intervalRun every1 Minute(s)Indexwazuh-findings-v5-network-activityQuery nameapache_malicious_ip_queryFieldservice.type is apacheIn the Triggers section, click Add trigger and fill the following parameters:
Field
Value
Trigger nameapache_malicious_ip_triggerSeverity level(1)HighestSpecify queries or tagsapache_malicious_ip_queryIn the Actions sub-section, click Add active response and fill the following parameters:
Field
Value
Action nameapache_malicious_ip_actionActive response[Active response] block_trafficClick Save to save the monitor.
Attack emulation
Access any of the web servers from the RHEL endpoint using the corresponding IP address. Replace <WEBSERVER_IP> with the appropriate value and execute the following command from the attacker endpoint:
$ curl http://<WEBSERVER_IP>
The attacker endpoint connects to the victim's web servers the first time. After the first connection, the Wazuh Active Response module temporarily blocks any successive connection to the web servers for 60 seconds.
Visualize the findings
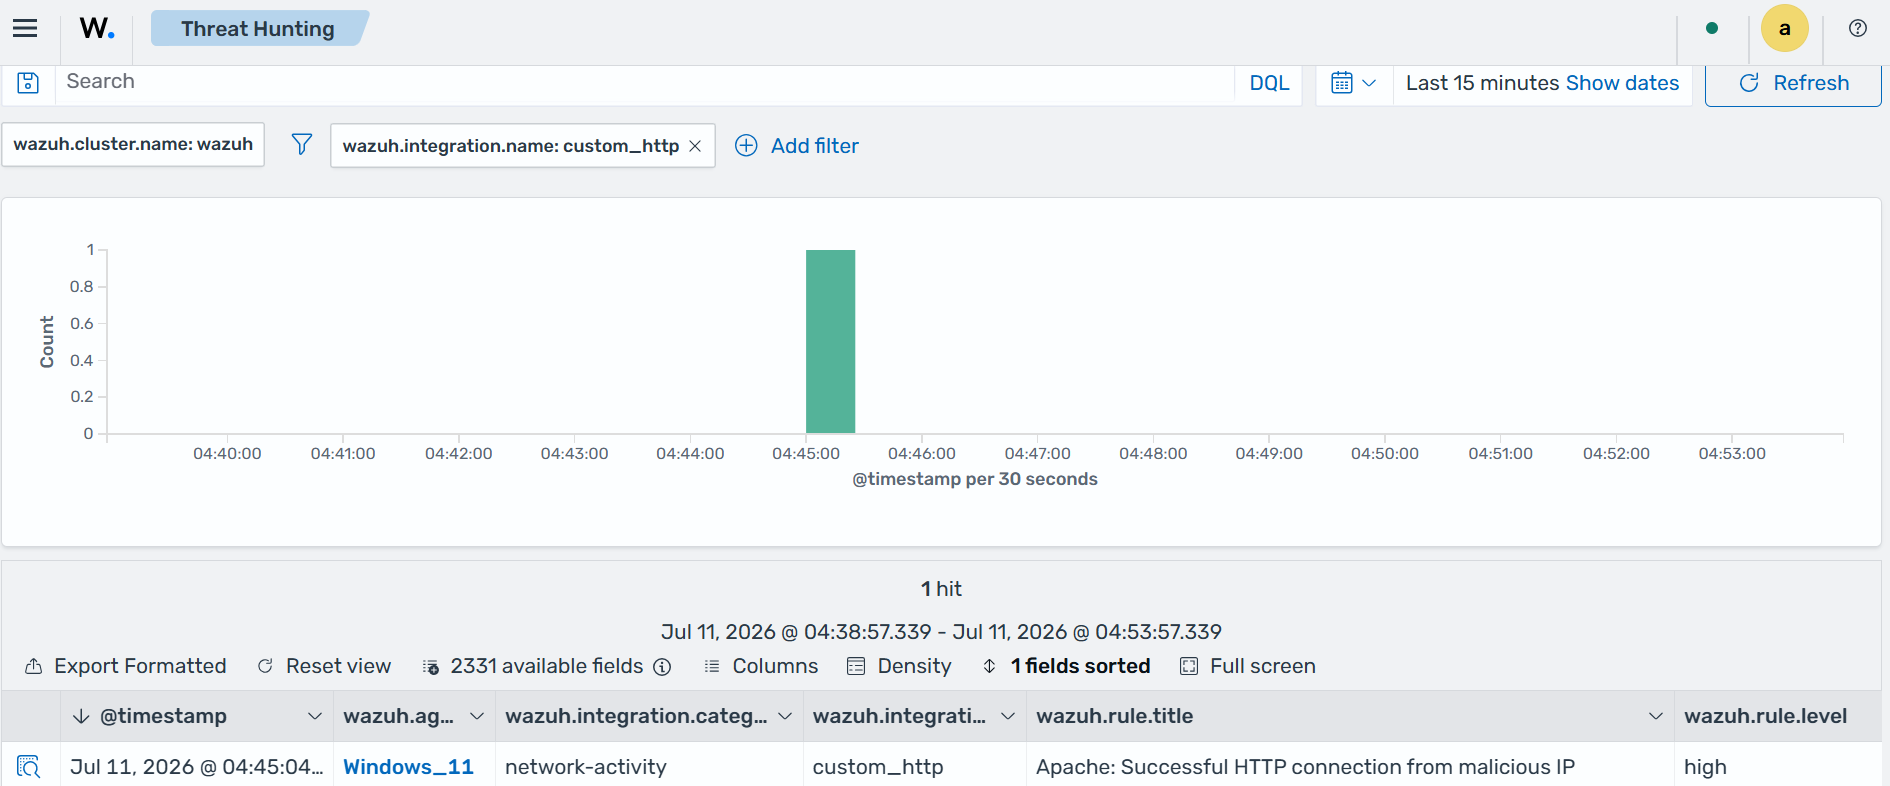
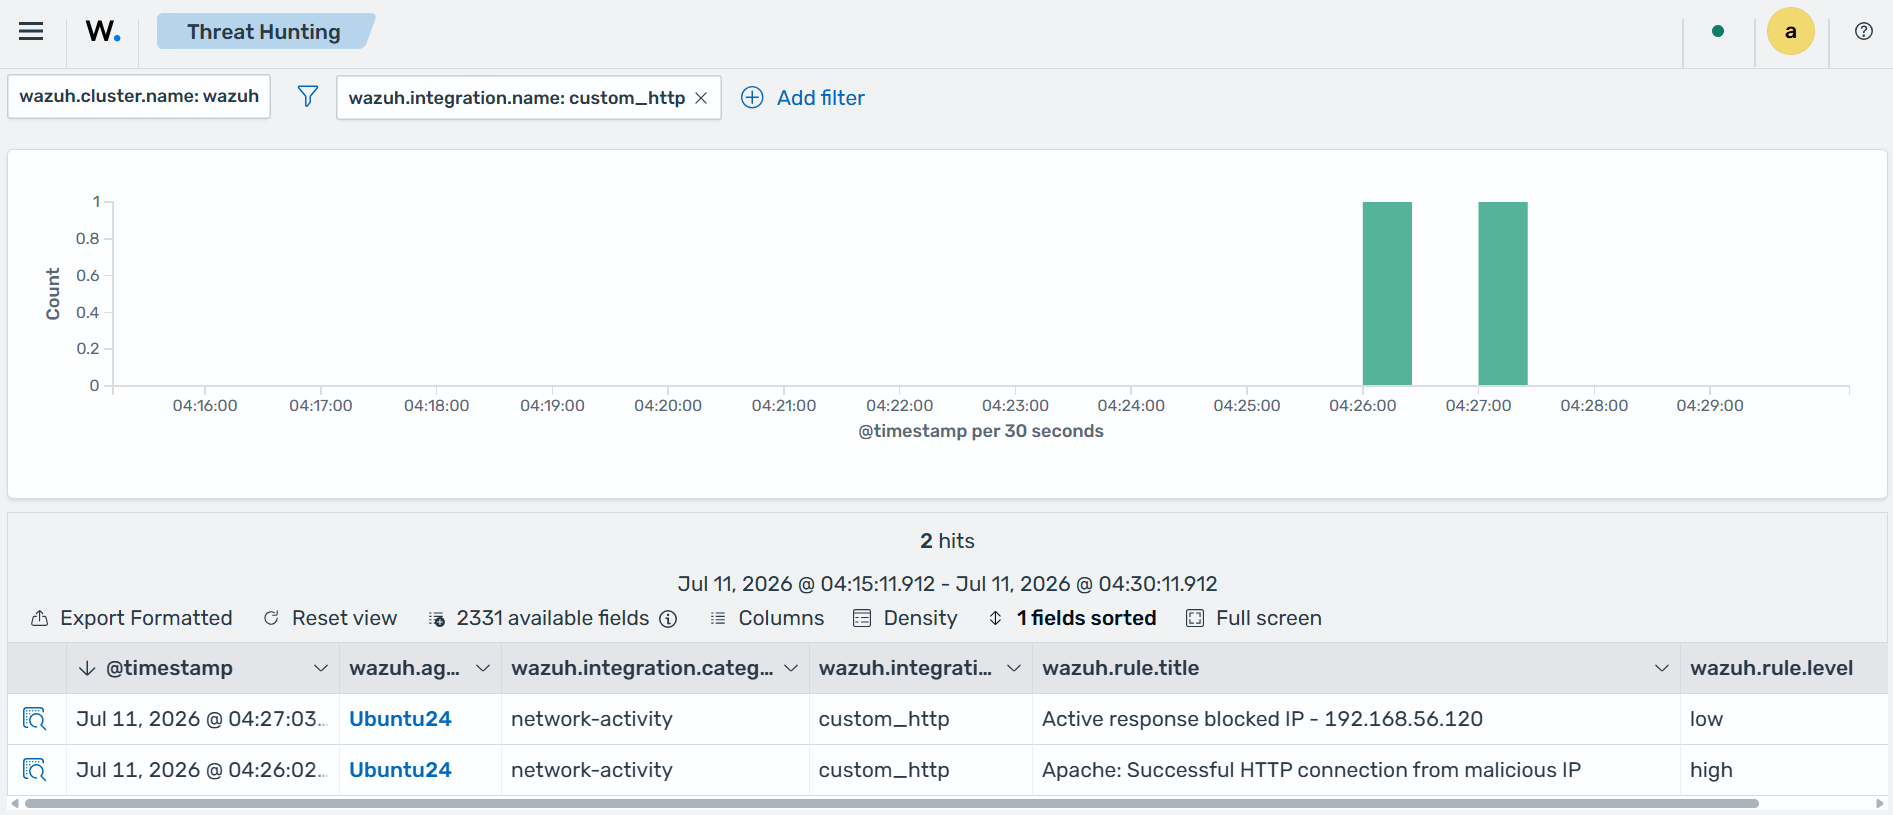
You can visualize the findings in the Wazuh dashboard. To do this, go to the Threat Hunting module and add the following filter in the search bar to query the findings wazuh.integration.name: custom_http.
Ubuntu:
Windows: