Data analysis
Wazuh collects security events from endpoints, containers, cloud environments, and other sources through the Wazuh agent and additional ingestion channels. These raw events are forwarded to the Wazuh manager, where the normalization engine parses, enriches, and converts them into a consistent and structured format. After normalization, the events are sent to the Wazuh indexer through the indexer connector.
Within the Wazuh indexer, the detection engine evaluates the normalized data against Sigma-compatible Wazuh detection rules. When rule conditions are met, the detection engine generates findings that correlate activity across multiple events and data sources. Findings, previously known as alerts in Wazuh 4.x, highlight security threats, suspicious behavior, and attack patterns. Together, the normalization engine and detection engine form the two core components of data analysis in Wazuh, decoding logs, applying rules, and producing actionable findings.
The Wazuh data analysis engine decodes logs, triggers rules, and generates findings using the following scheme:
Log collection: Wazuh gathers logs from monitored endpoints, applications, and network devices. These logs come from various sources, including operating system logs, syslog-enabled devices, cloud provider logs, and custom logs. See the log data collection documentation for more information.
Log normalization: The Wazuh data analysis engine processes raw events using decoders that parse, normalize, and enrich them into structured JSON documents conforming to the Wazuh Common Schema (WCS). The Wazuh Common Schema is a standardized structure for organizing and categorizing security event data from any source, ensuring consistent analysis, correlation, and reporting across data types.
Rule matching and findings visualization: The Wazuh manager forwards normalized events to the indexer, where detectors evaluate them against detection rules at configured intervals. This means that findings from Wazuh rules match in near real-time. When an event matches a rule, the indexer generates a finding, enriches it with event and rule metadata, and indexes it for visualization and investigation in the Wazuh dashboard.
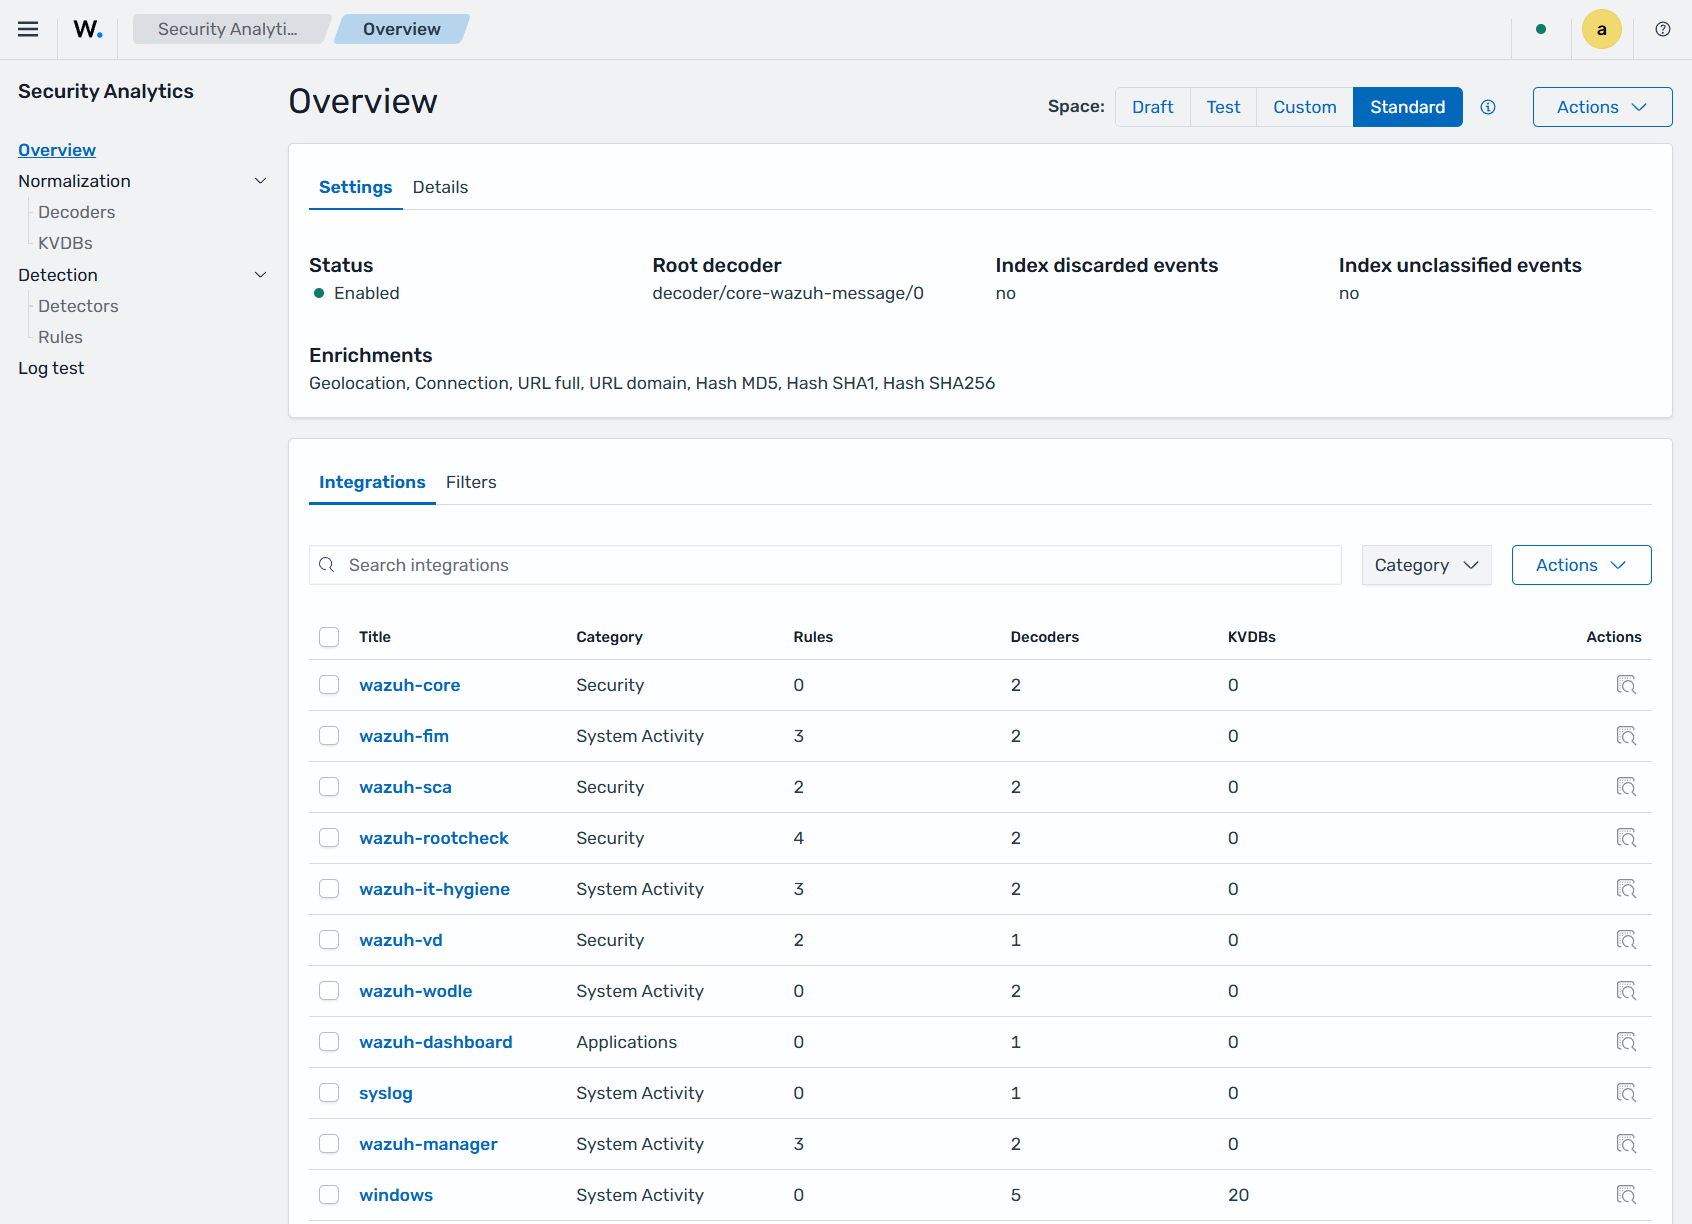
You can manage Wazuh data analysis policies using the Wazuh Security Analytics dashboard. In this interface, you can create and configure decoders, KVDBs, detectors, and detection rules.
Click the upper-left menu icon ☰ to open the menu on the Wazuh dashboard, and go to Security Analytics > Overview to access the Security Analytics dashboard.