• Blog
  • Documentation
  • Contact us
Wazuh
  • Platform
    • Overview
    • XDR
    • SIEM
  • Cloud
  • CTI
  • Services
    • Professional support
    • Consulting services
    • Training courses
  • Partners
    • Become a partner
    • Find a partner
  • Company
    • Customers
    • About us
    • Our team
    • Resources
  • Community
    • Overview
    • Ambassadors
    • Events
    Search now!
    • Getting started
      • Components
        • Wazuh indexer
        • Wazuh manager
        • Wazuh dashboard
        • Wazuh agent
      • Architecture
    • Quickstart
    • Installation guide
      • Wazuh indexer
        • Assisted installation
        • Step-by-step installation
      • Wazuh manager
        • Assisted installation
        • Step-by-step installation
      • Wazuh dashboard
        • Assisted installation
        • Step-by-step installation
      • Wazuh agent
        • Linux
        • Windows
        • macOS
      • Packages list
      • Uninstalling Wazuh
        • Uninstalling the Wazuh agent
        • Uninstalling the Wazuh central components
    • Installation alternatives
      • Virtual machine (VM)
      • Deployment on Docker
        • Wazuh Docker deployment
        • Building Docker images locally
        • Wazuh Docker utilities
        • Upgrading the Wazuh Docker deployment
        • Uninstalling the Wazuh Docker deployment
      • Deployment on Kubernetes
        • Wazuh Kubernetes architecture
        • Deployment
        • Changing the password of Wazuh users
        • Clean Up
      • Offline installation guide
        • Install Wazuh components using the assisted method
        • Install Wazuh components step by step
      • Deployment with Ansible
        • Requirements
        • Deploying Wazuh
        • Roles
        • Variables references
    • User manual
      • Wazuh agent
        • Wazuh agent enrollment
          • Requirements
          • Wazuh agent life cycle
          • Enrollment methods
            • Enrollment through agent configuration
              • Linux/Unix
              • Windows
              • macOS
            • Enrollment through the Wazuh manager API
              • Request the client key
              • Importing the client key to the Wazuh agent
          • Additional security options
            • Enroll Wazuh agents with password authentication
            • Wazuh manager identity verification
            • Wazuh agent identity verification
          • Troubleshooting
        • Wazuh agent connection
        • Wazuh agent administration
          • Query the Wazuh agent configuration
          • Group agents
          • List agents
          • Anti-tampering
          • Remove agents
          • Upgrade agents remotely
      • Wazuh dashboard
        • Navigating the Wazuh dashboard
        • Wazuh dashboard configurations
        • Querying security information on the Wazuh dashboard
        • Certificates deployment
          • Configuring third-party SSL certificates
            • Configuring SSL certificates on the Wazuh dashboard using Let’s Encrypt
            • Configuring SSL certificates on the Wazuh dashboard using NGINX
        • Setting up custom branding
        • Troubleshooting
      • Wazuh manager
        • Wazuh manager architecture
        • Wazuh normalization engine
        • Wazuh indexer connector
        • Wazuh manager services
        • Logging
        • Reference
      • Data analysis
        • Data analysis components
          • Content management
          • Space
          • Integration
          • Events
          • Filters
          • Decoders
          • Key-Value Databases (KVDBs)
          • Enrichment
          • Rules
          • Detectors
          • Findings
        • Create a security analytics detection workflow
      • User administration
        • Password management
        • Wazuh RBAC - How to create and map internal users
        • Single Sign-On
          • Okta
          • Microsoft Entra ID
          • PingOne
          • Google Workspace
          • JumpCloud
          • OneLogin
          • Keycloak
          • authentik
        • Active Directory and LDAP integration
      • Capabilities
        • Container security
          • Using Wazuh to monitor Docker
          • Use case
        • Security Configuration Assessment
          • How it works
          • Configuration
          • Available SCA policies
          • Use cases
        • System inventory
          • How it works
          • Configuration
          • Viewing system inventory data
          • Generating system inventory reports
          • Available inventory fields
          • Syscollector information findings
          • Use cases
          • Compatibility matrix
        • Vulnerability detection
          • How it works
          • Configuration
    • Cloud security
      • Monitoring GitHub
        • Monitoring GitHub audit logs
    • Proof of Concept guide
      • File integrity monitoring
      • Vulnerability detection
      • Security configuration assessment
      • Monitoring Docker events
      • Detecting an SQL injection attack
      • Monitoring AWS infrastructure
      • Network IDS integration
    • Transitioning from 4.x to 5.x
      • Transition plan
      • Wazuh indexer
      • Wazuh manager
      • Wazuh dashboard
    • User manual
    • Wazuh dashboard
    • Navigating the Wazuh dashboard

    Navigating the Wazuh dashboard

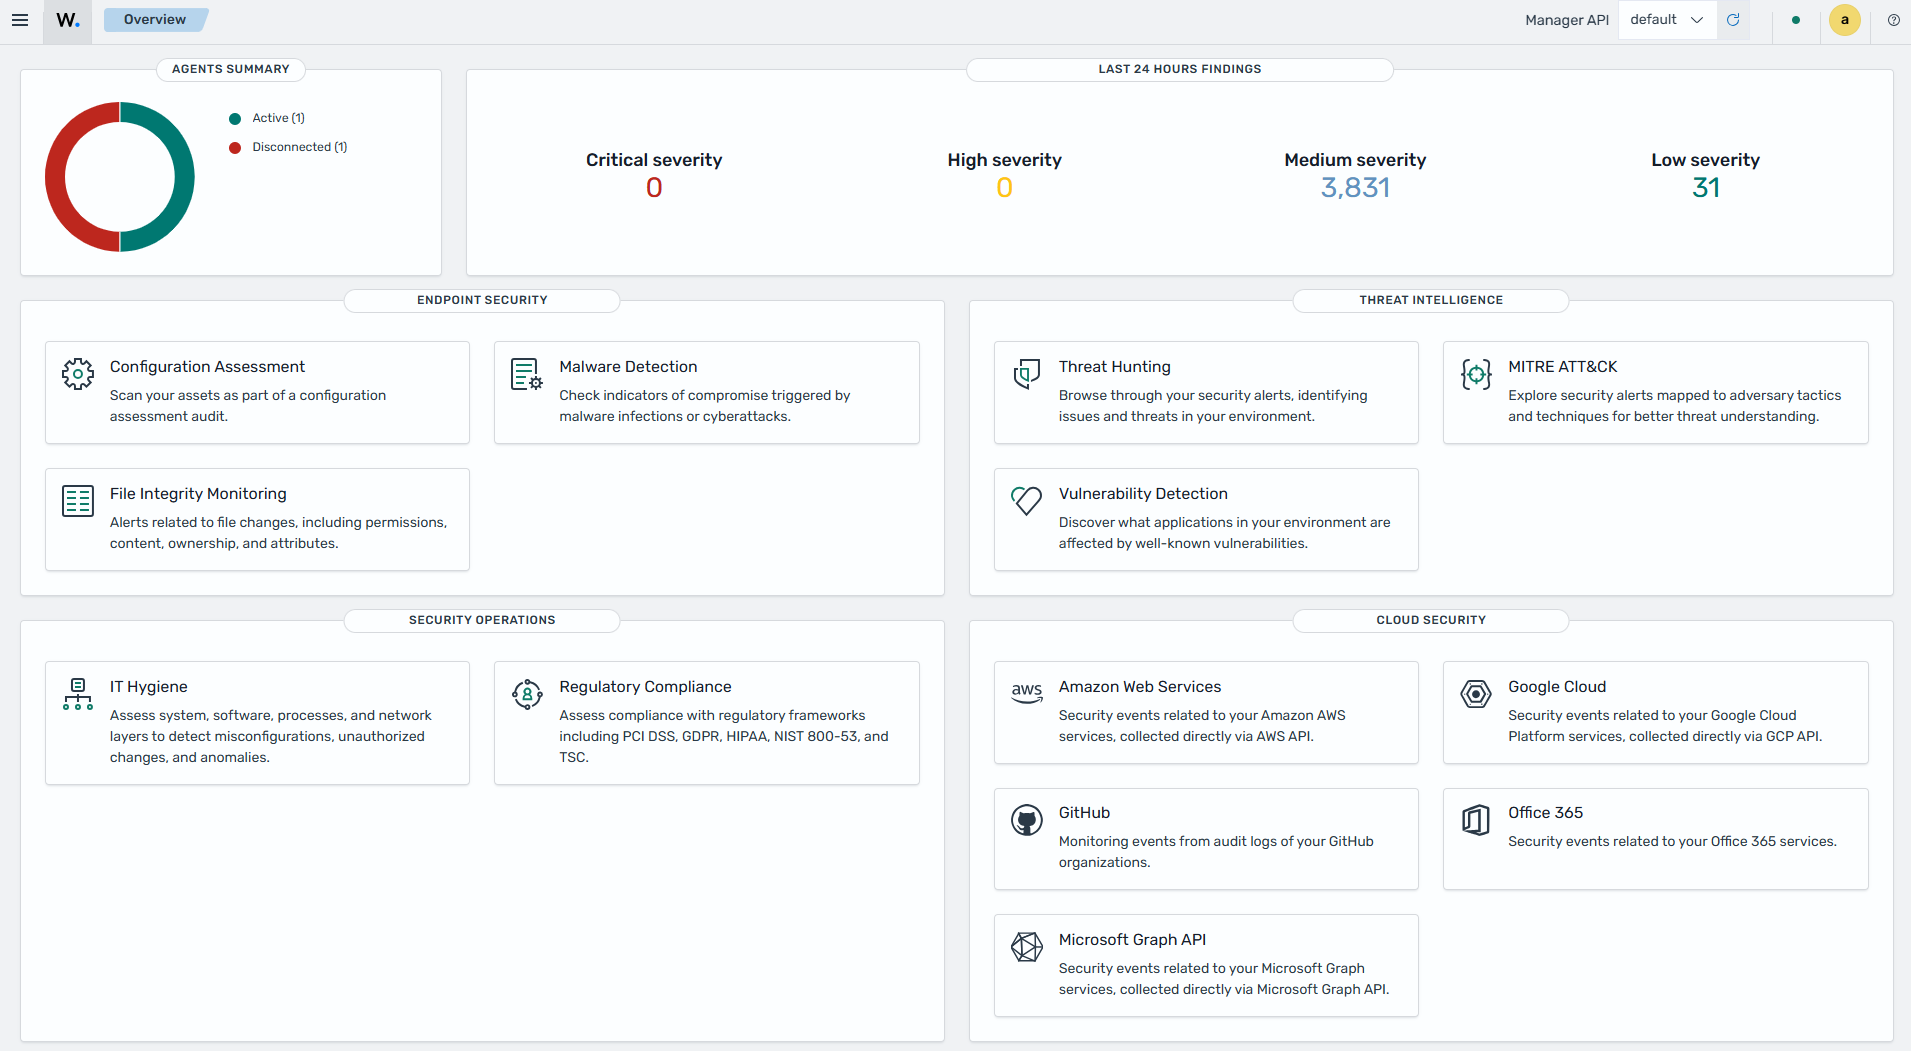
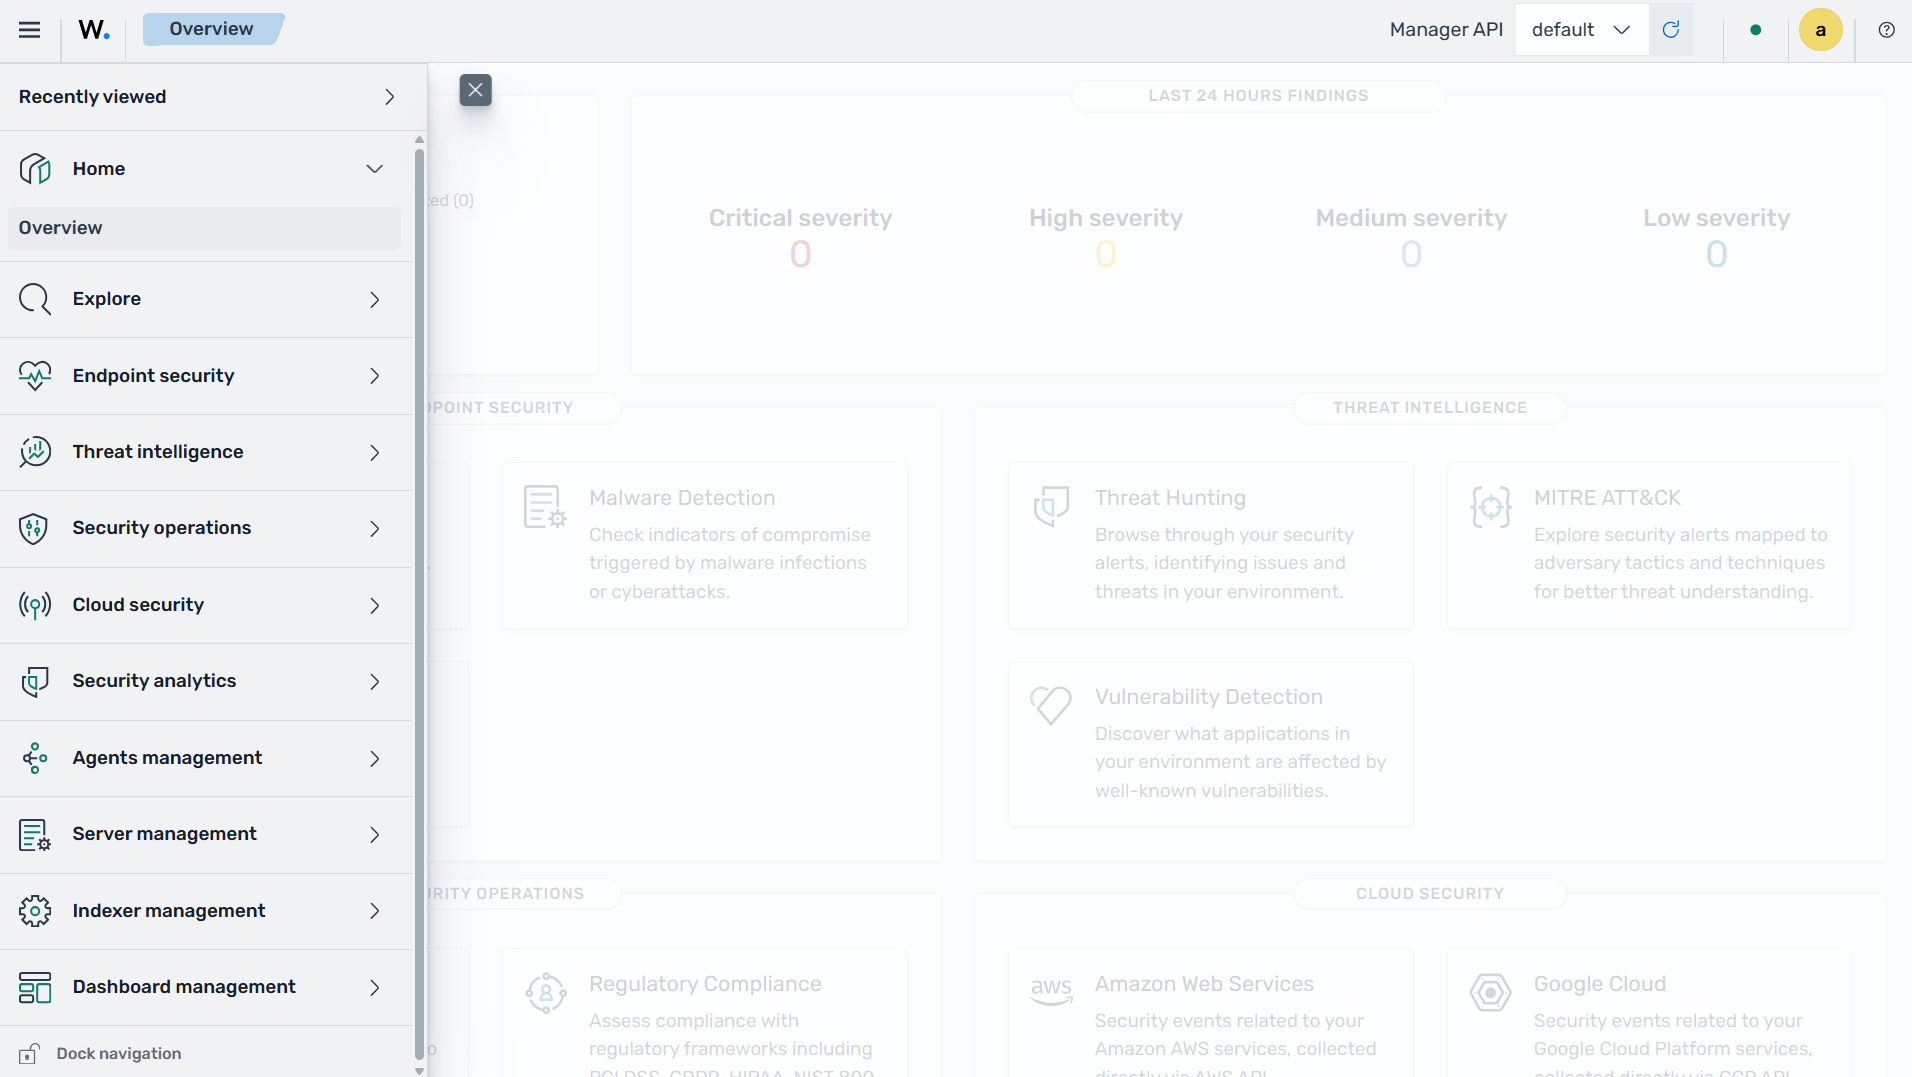
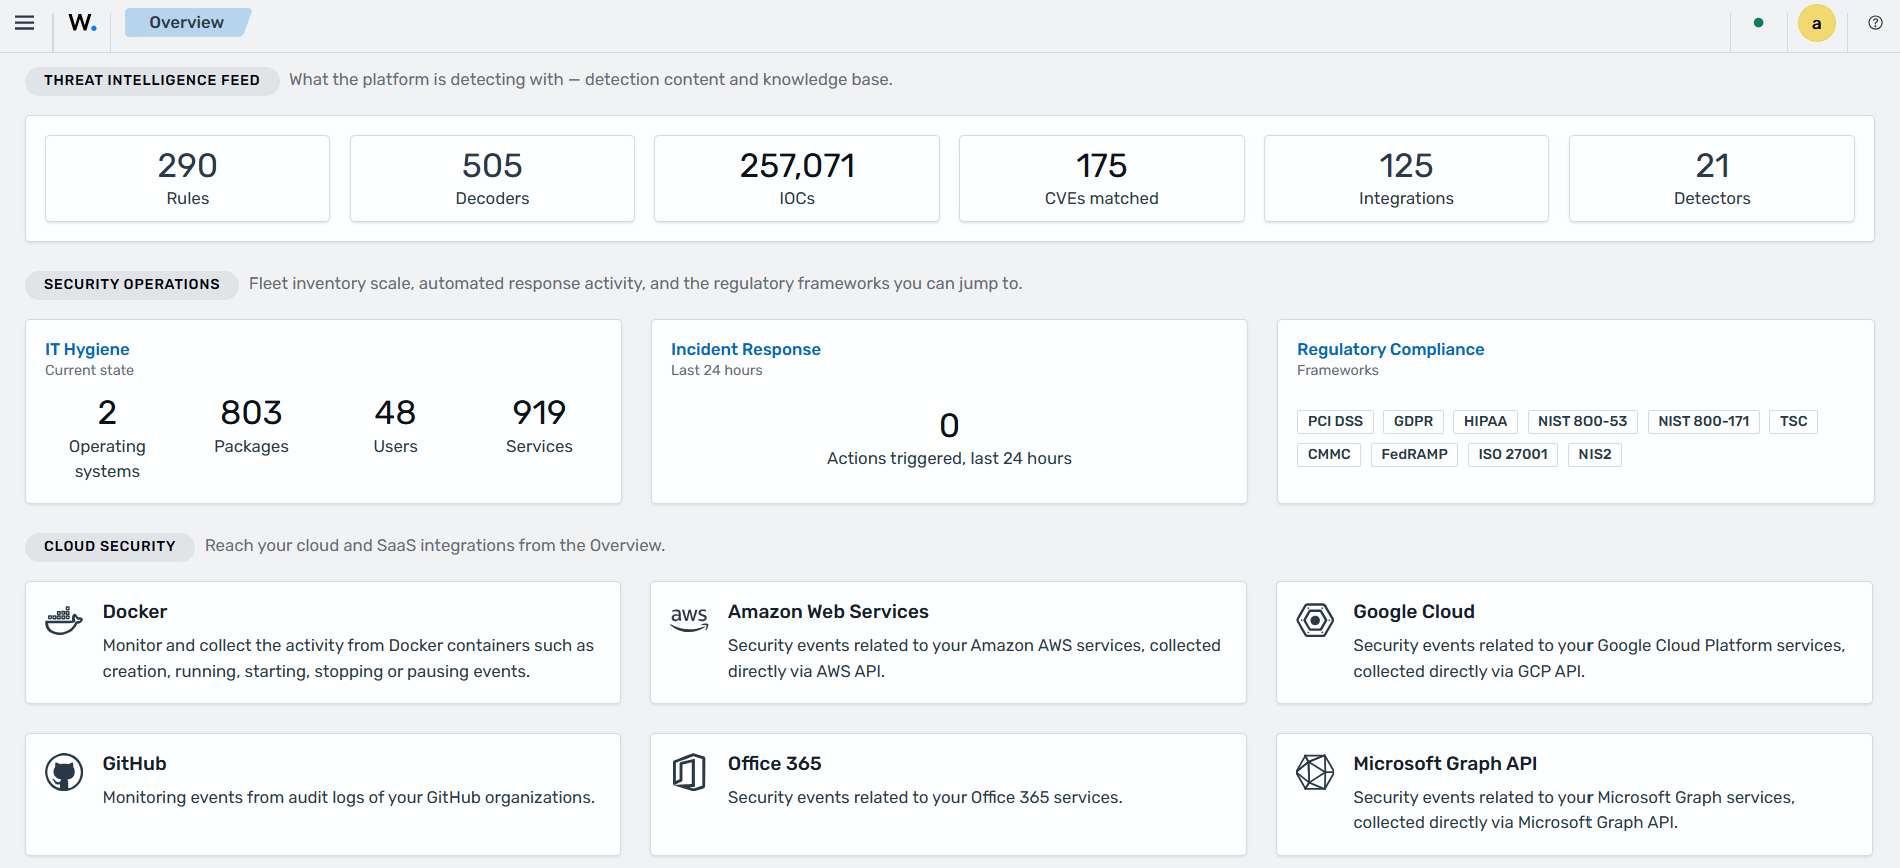
    The Wazuh dashboard is designed to provide an overview of security-related incidents and activities across your environment. It aggregates and visualizes data from multiple sources, enabling administrators and security analysts to identify, investigate, and respond to potential threats. The Wazuh dashboard features a user-friendly interface that provides dashboards for endpoint security, threat intelligence, security operations, security analytics, and cloud security.

    The Wazuh dashboard also displays summaries of connected and disconnected Wazuh agents and highlights the severity levels of alerts triggered within the last 24 hours. In addition to monitoring and visualization capabilities, the Wazuh dashboard allows users to manage and configure various Wazuh platform settings from a centralized interface. It provides a user-friendly interface for Wazuh indexer, manager, dashboard, and agent management.

    Navigating the Wazuh dashboard: Dashboards
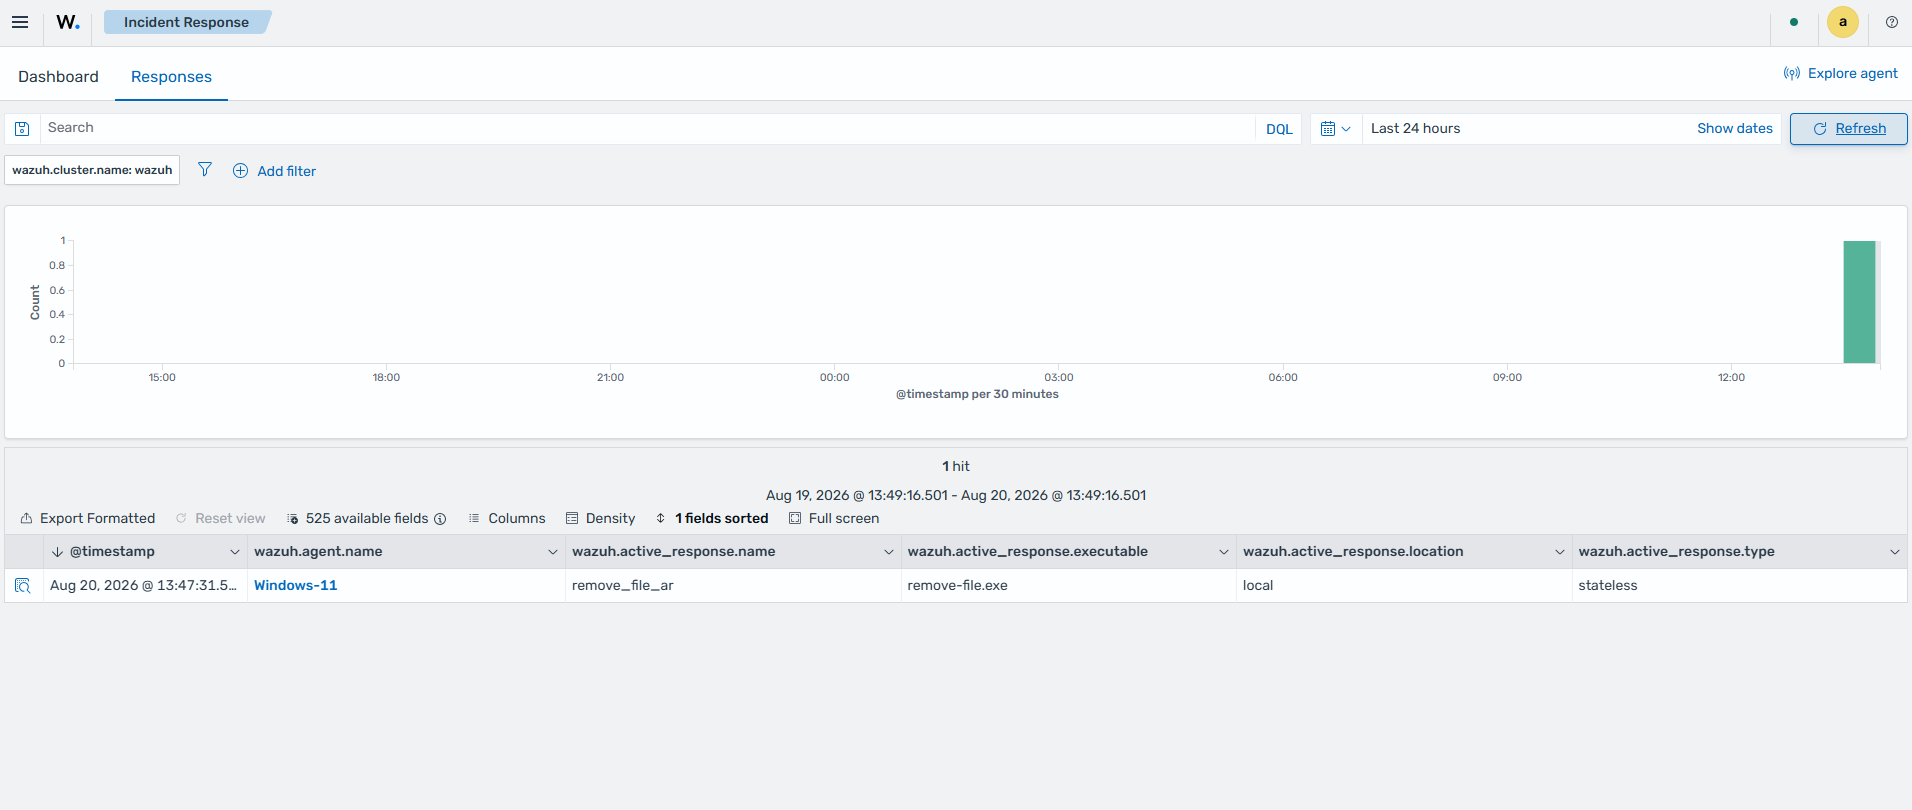
    Navigating the Wazuh dashboard: Overview

    Dashboards

    The Wazuh dashboard provides prebuilt visualizations and reports that help users monitor, analyze, and investigate security events across their environment. These dashboards present security, operational, and compliance data collected and processed by Wazuh. The Wazuh dashboard includes interactive dashboards for endpoint security, threat intelligence, security operations, cloud security, and security analytics. It also provides management interfaces for Wazuh agents and central components, including the Wazuh manager, indexer, and dashboard.

    Endpoint security

    This section of the Wazuh dashboard provides dashboards for endpoint security capabilities, including configuration assessment, malware detection, and file integrity monitoring.

    Configuration Assessment

    This dashboard shows configuration assessment results, compliance status, failed checks, and security policy violations detected across monitored endpoints.
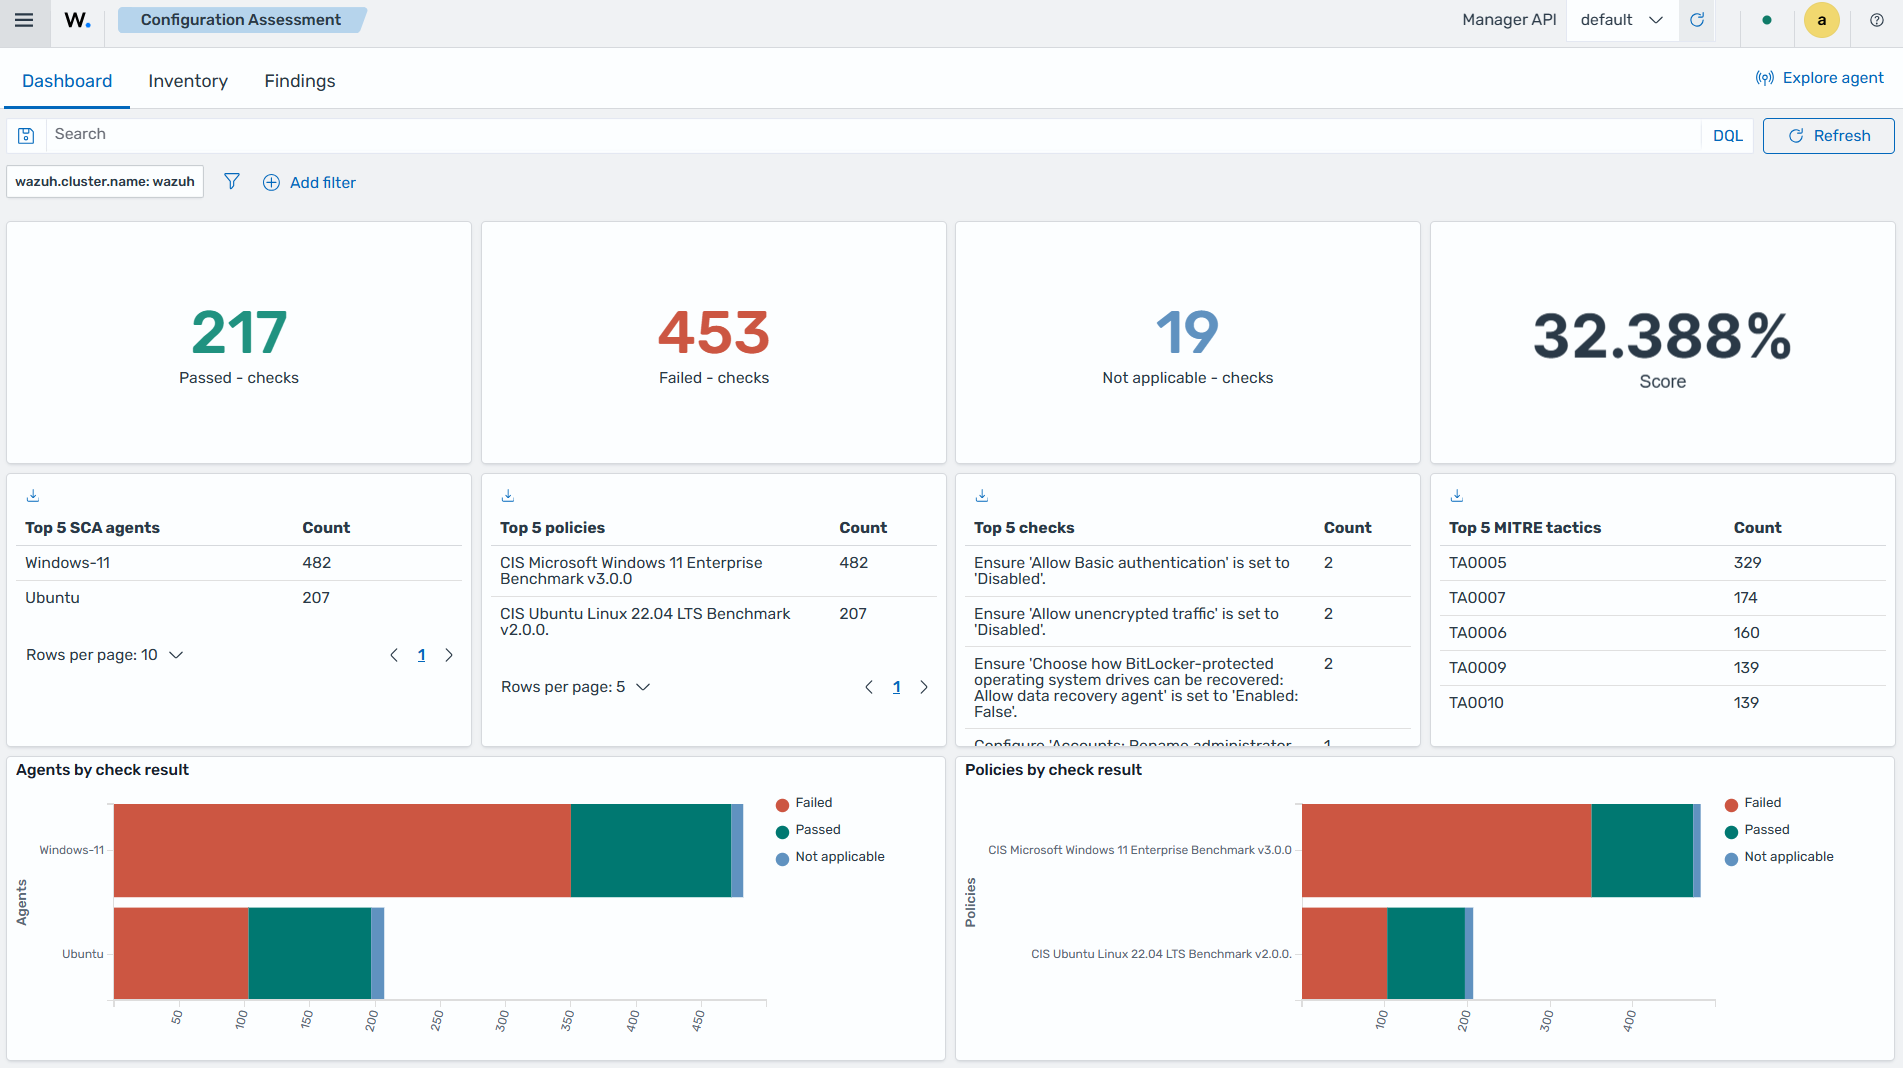
    Configuration Assessment

    Malware detection

    This dashboard shows malware detection events, threat intelligence matches, malicious file activity, and other indicators of compromise detected on monitored endpoints.
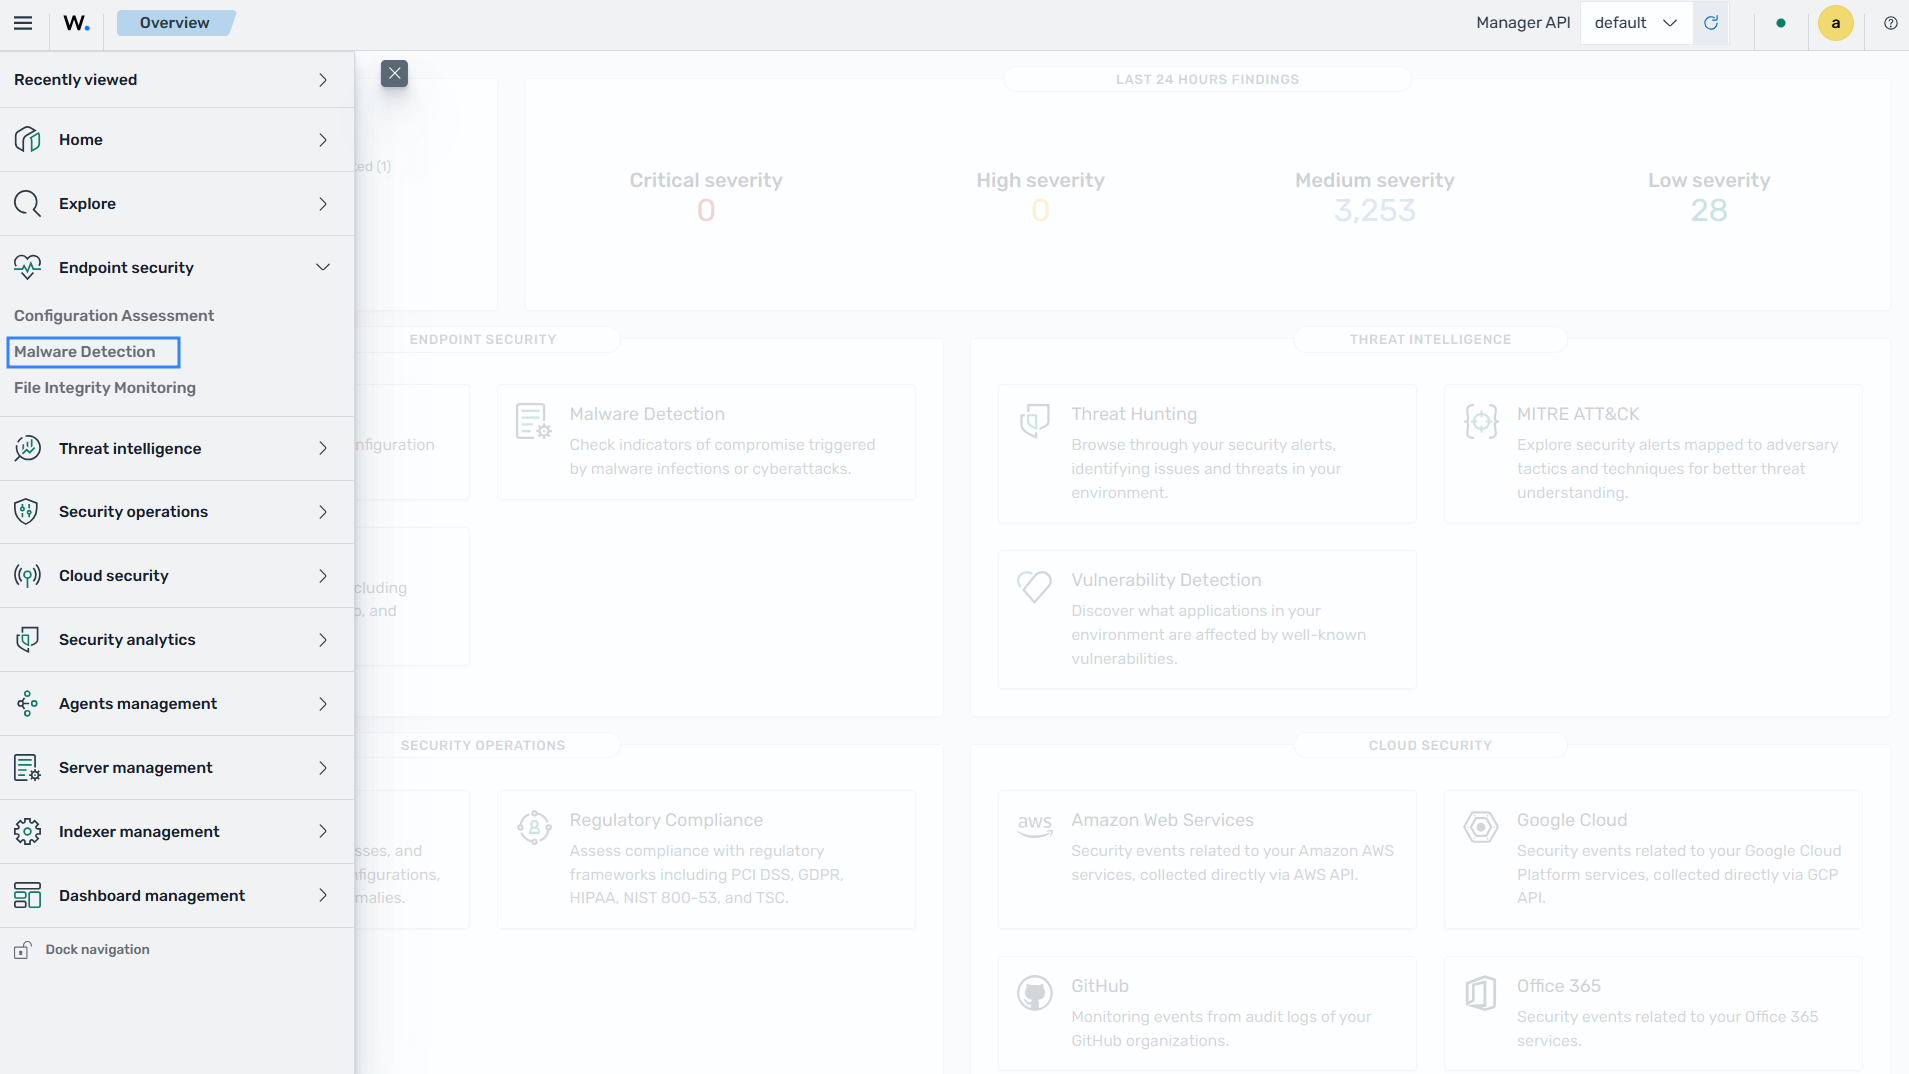
    Malware detection

    File integrity monitoring

    This dashboard shows file activity over time, monitored file inventory, and events related to changes in monitored files and directories.
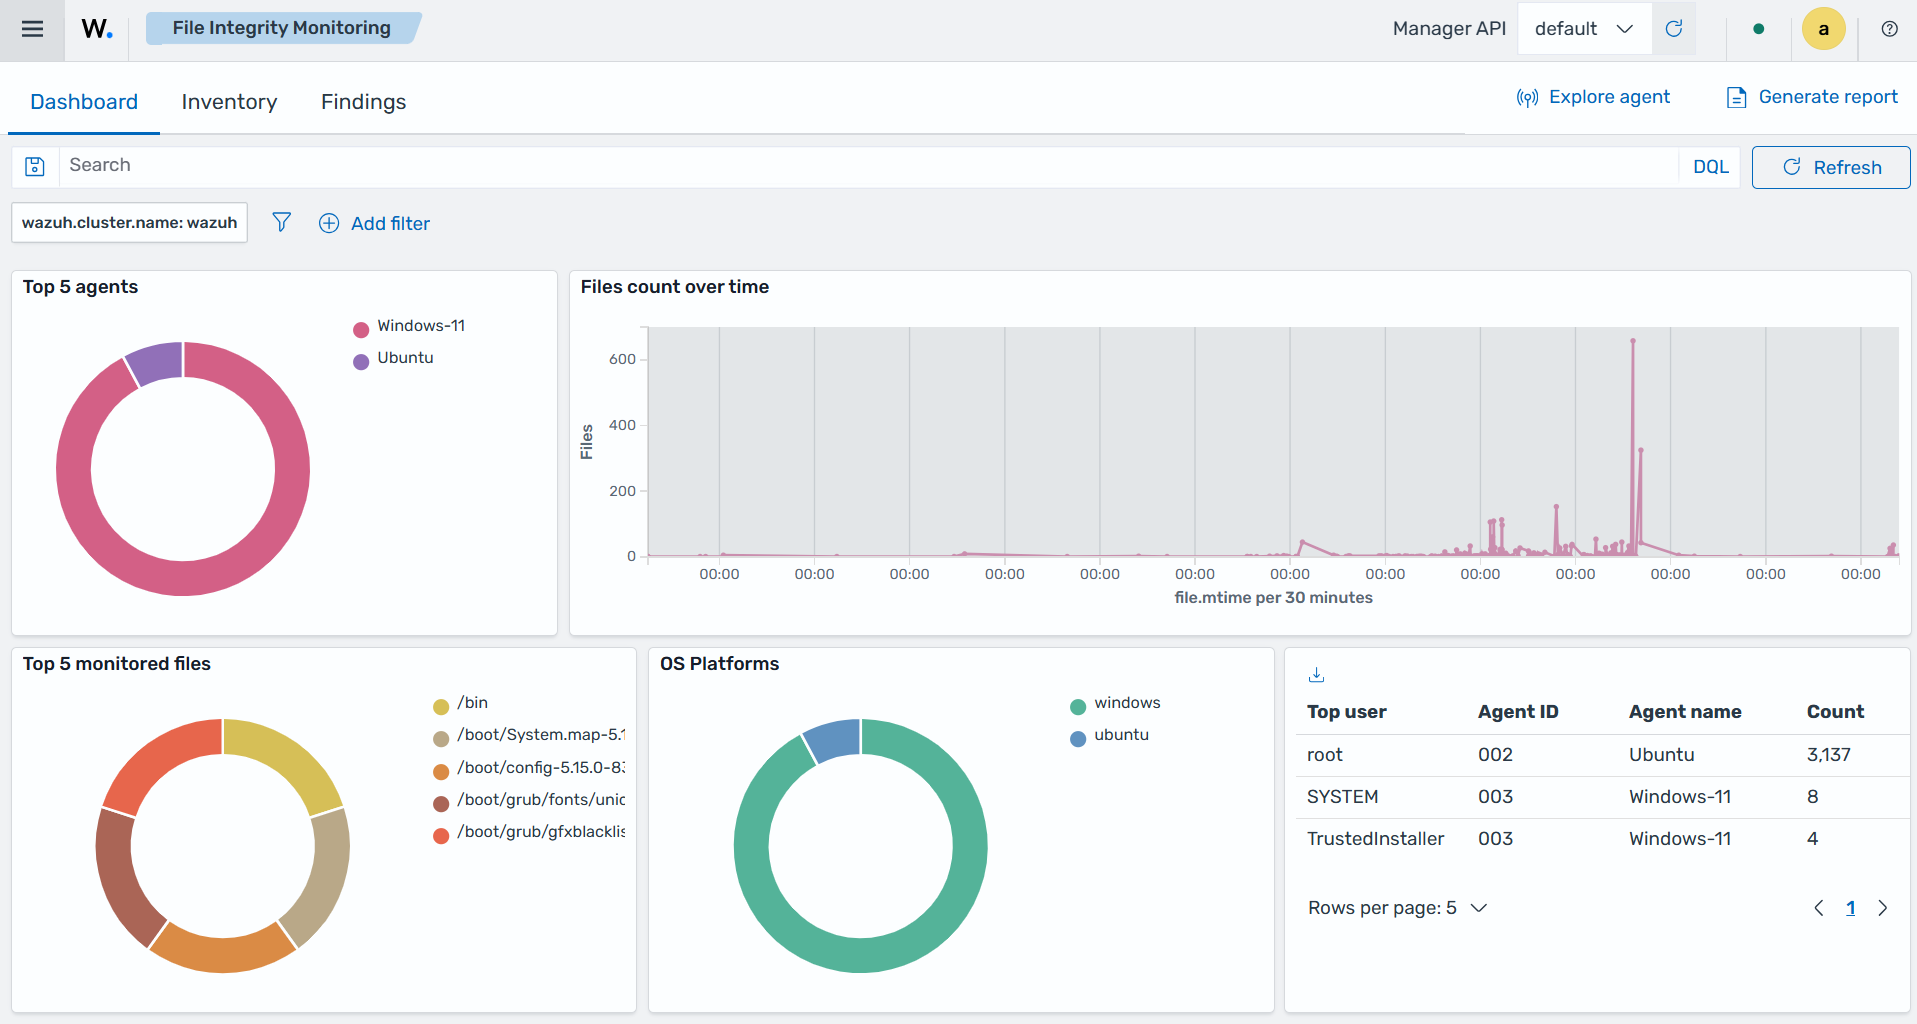
    File integrity monitoring

    Threat intelligence

    This section of the Wazuh dashboard provides dashboards for threat intelligence capabilities, including threat hunting, vulnerability detection, and MITRE ATT&CK analysis.

    Threat Hunting

    This dashboard provides visibility into security events and suspicious activity to support proactive threat investigation and analysis.
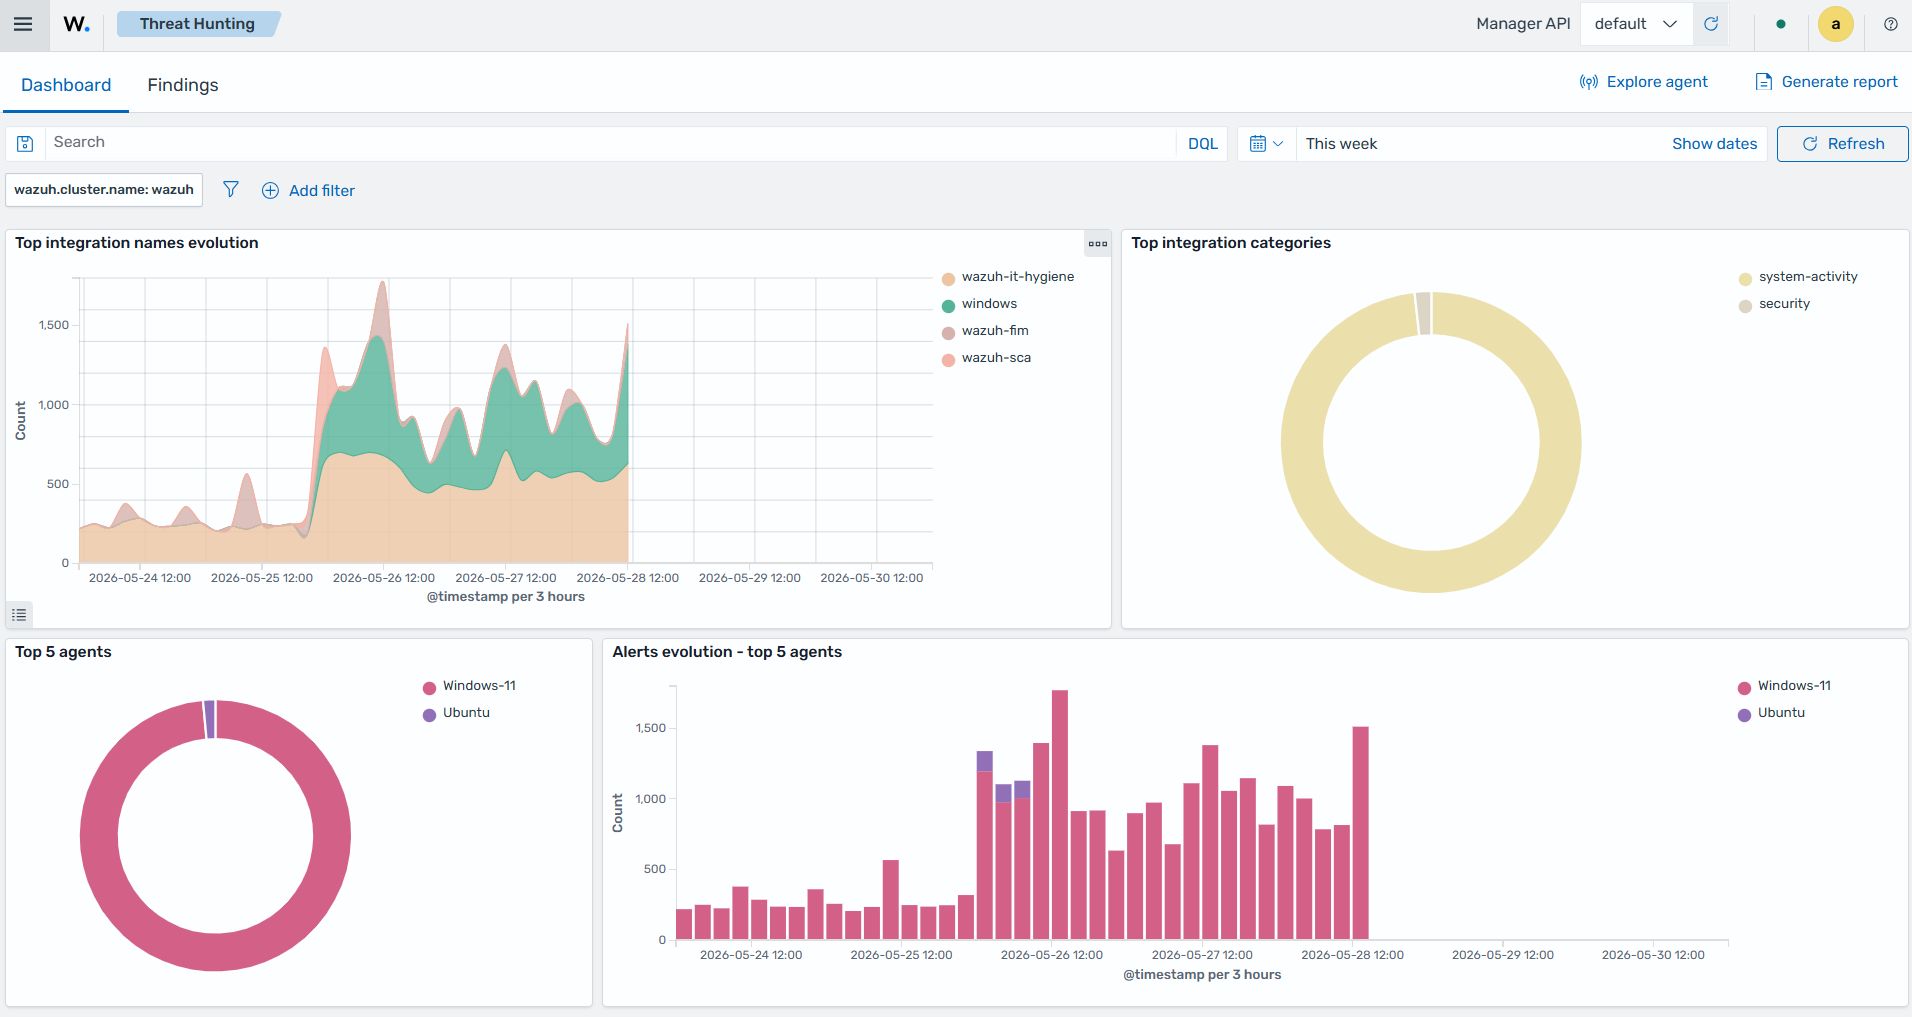
    Threat Hunting

    Vulnerability detection

    This dashboard shows detected vulnerabilities, affected endpoints, severity levels, and remediation-related information across monitored systems.
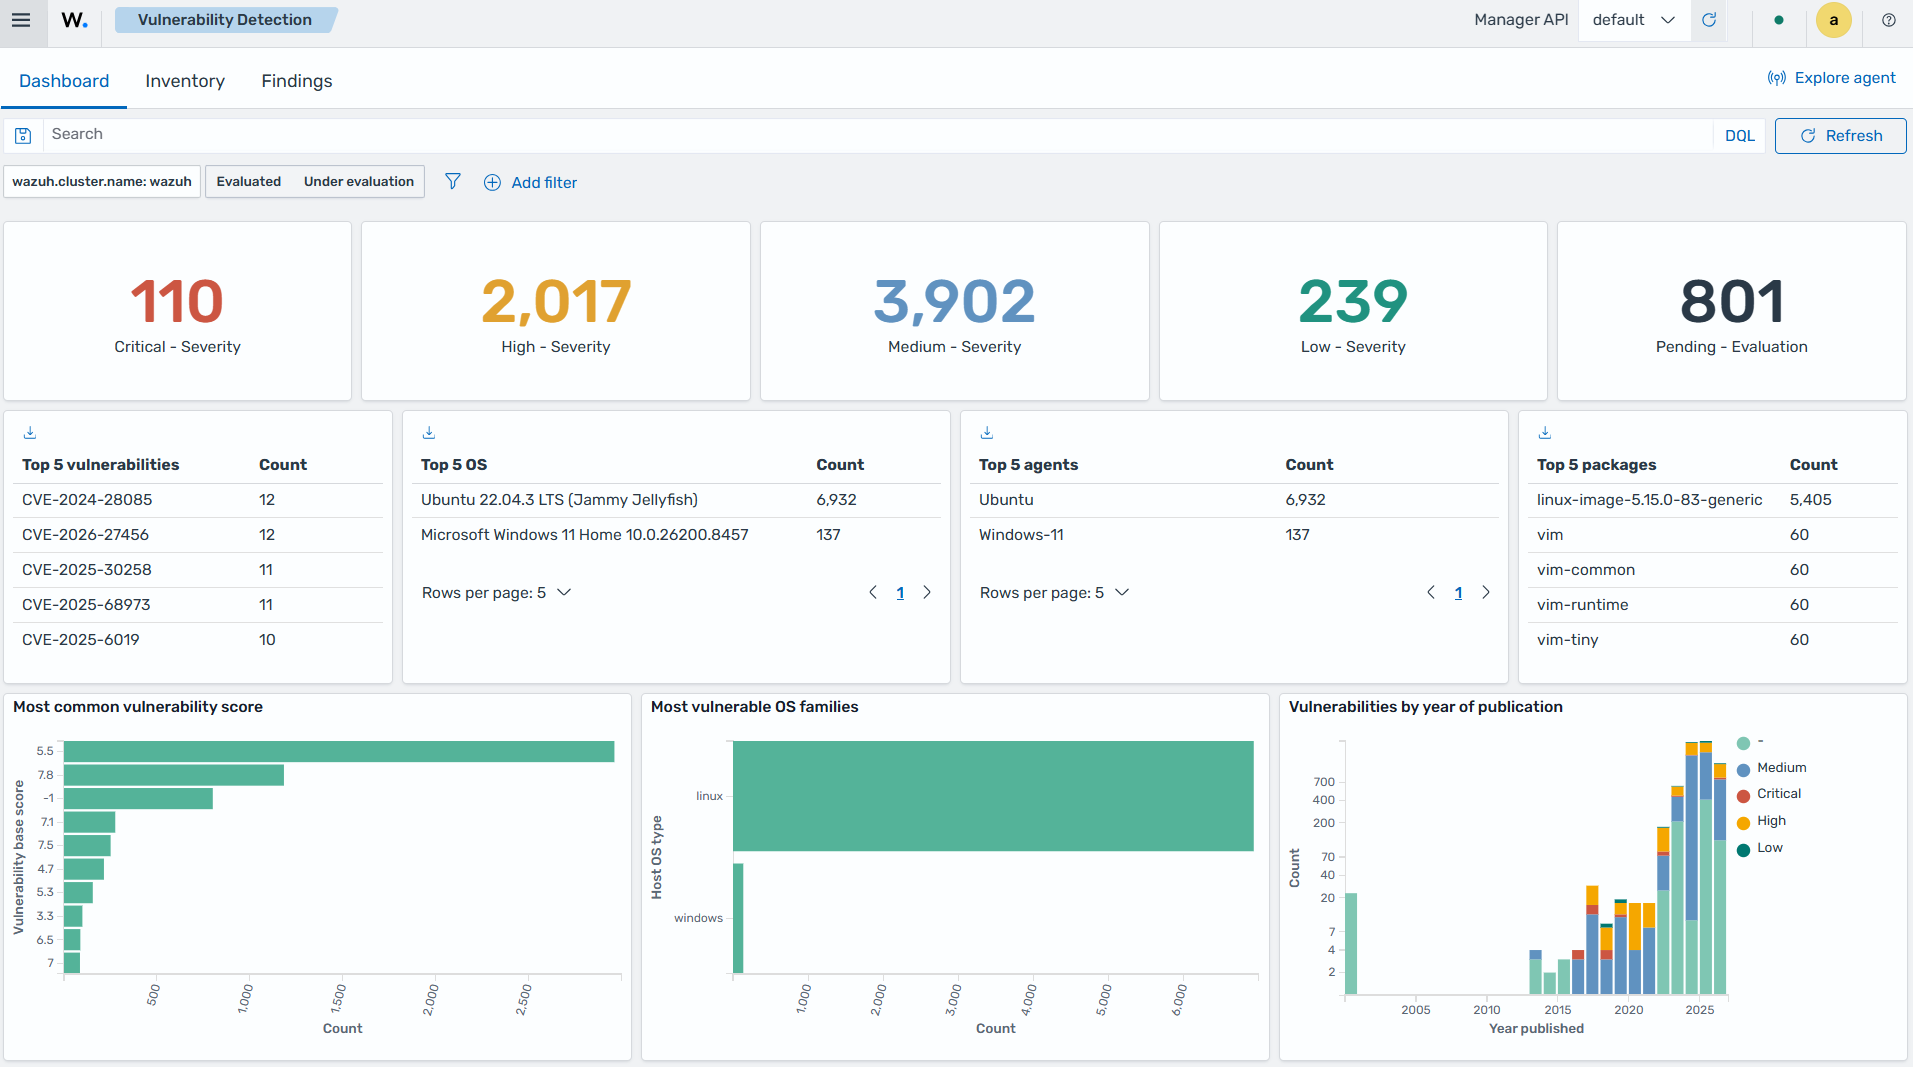
    Vulnerability detection

    MITRE ATT&CK

    This dashboard maps detected security events and techniques to the MITRE ATT&CK framework to support threat analysis and adversary behavior tracking.
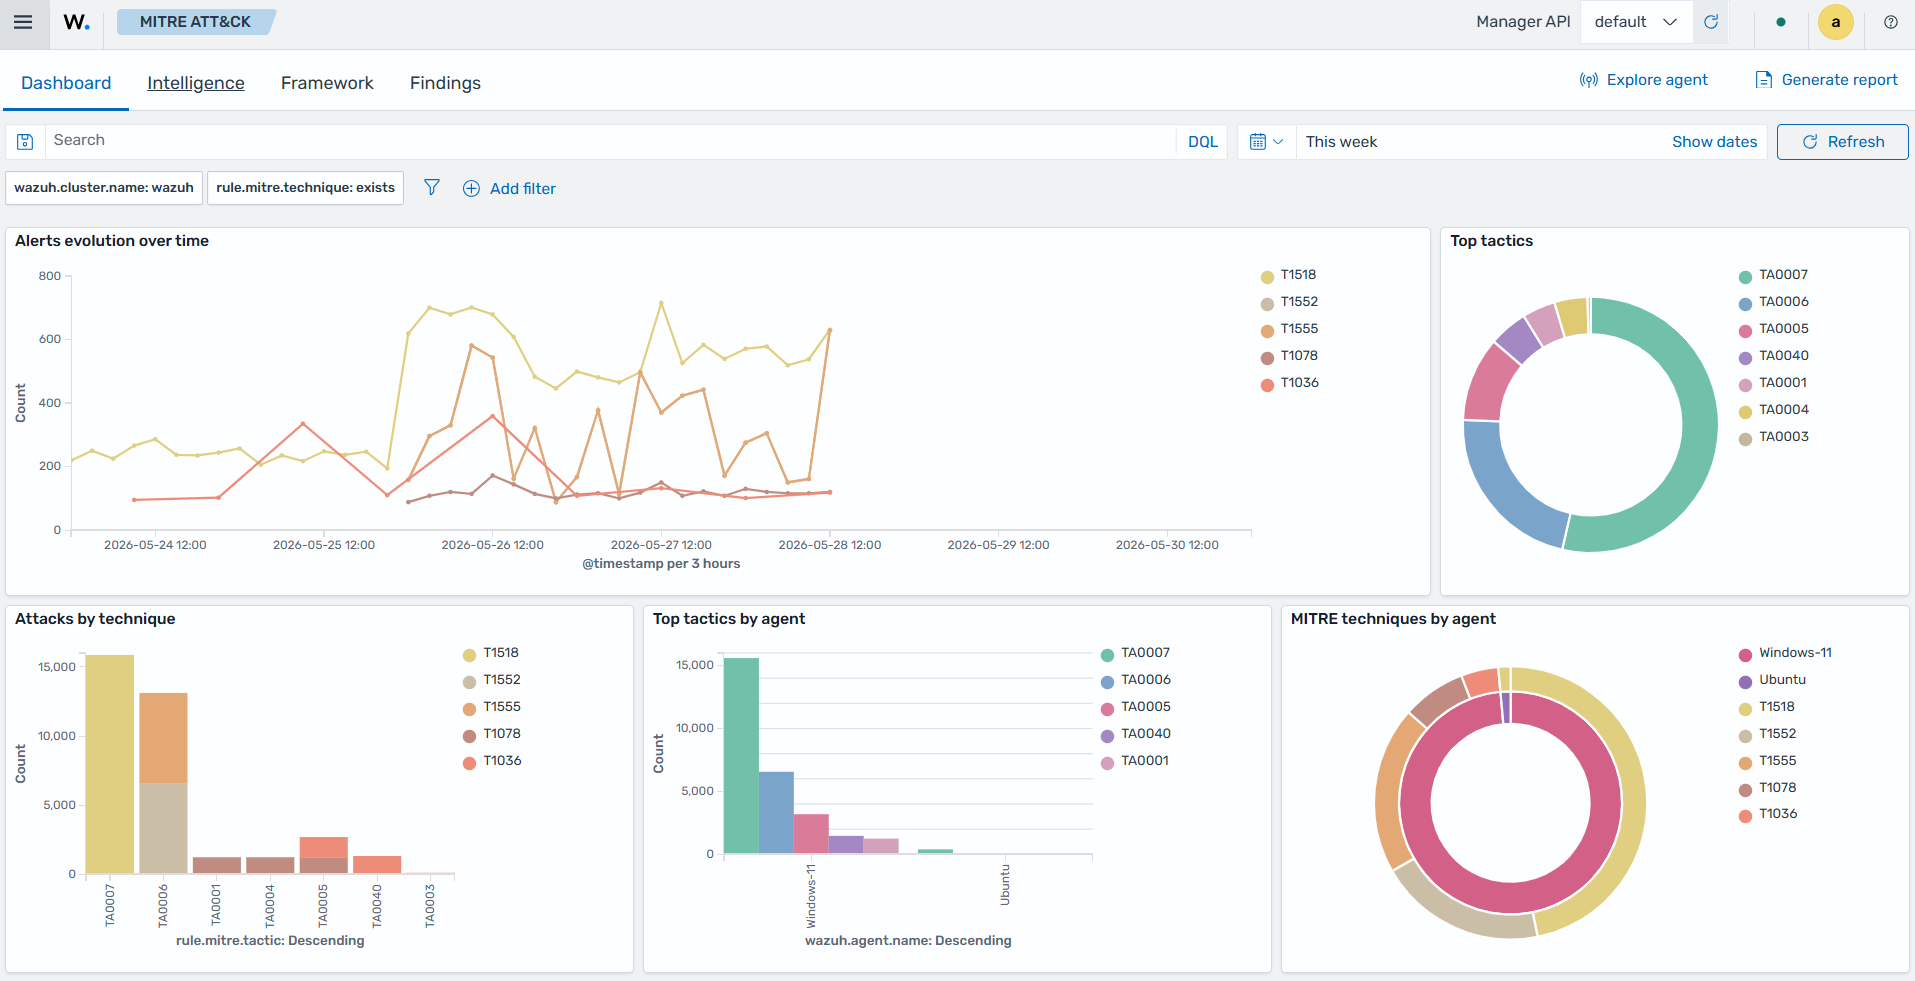
    MITRE ATT&CK

    Security operations

    This section shows dashboards for IT hygiene data, such as system inventory and vulnerabilities, as well as regulatory standards.

    IT Hygiene

    This dashboard shows IT hygiene data, including system inventory information, installed packages, running processes, open ports, and detected vulnerabilities across monitored endpoints.
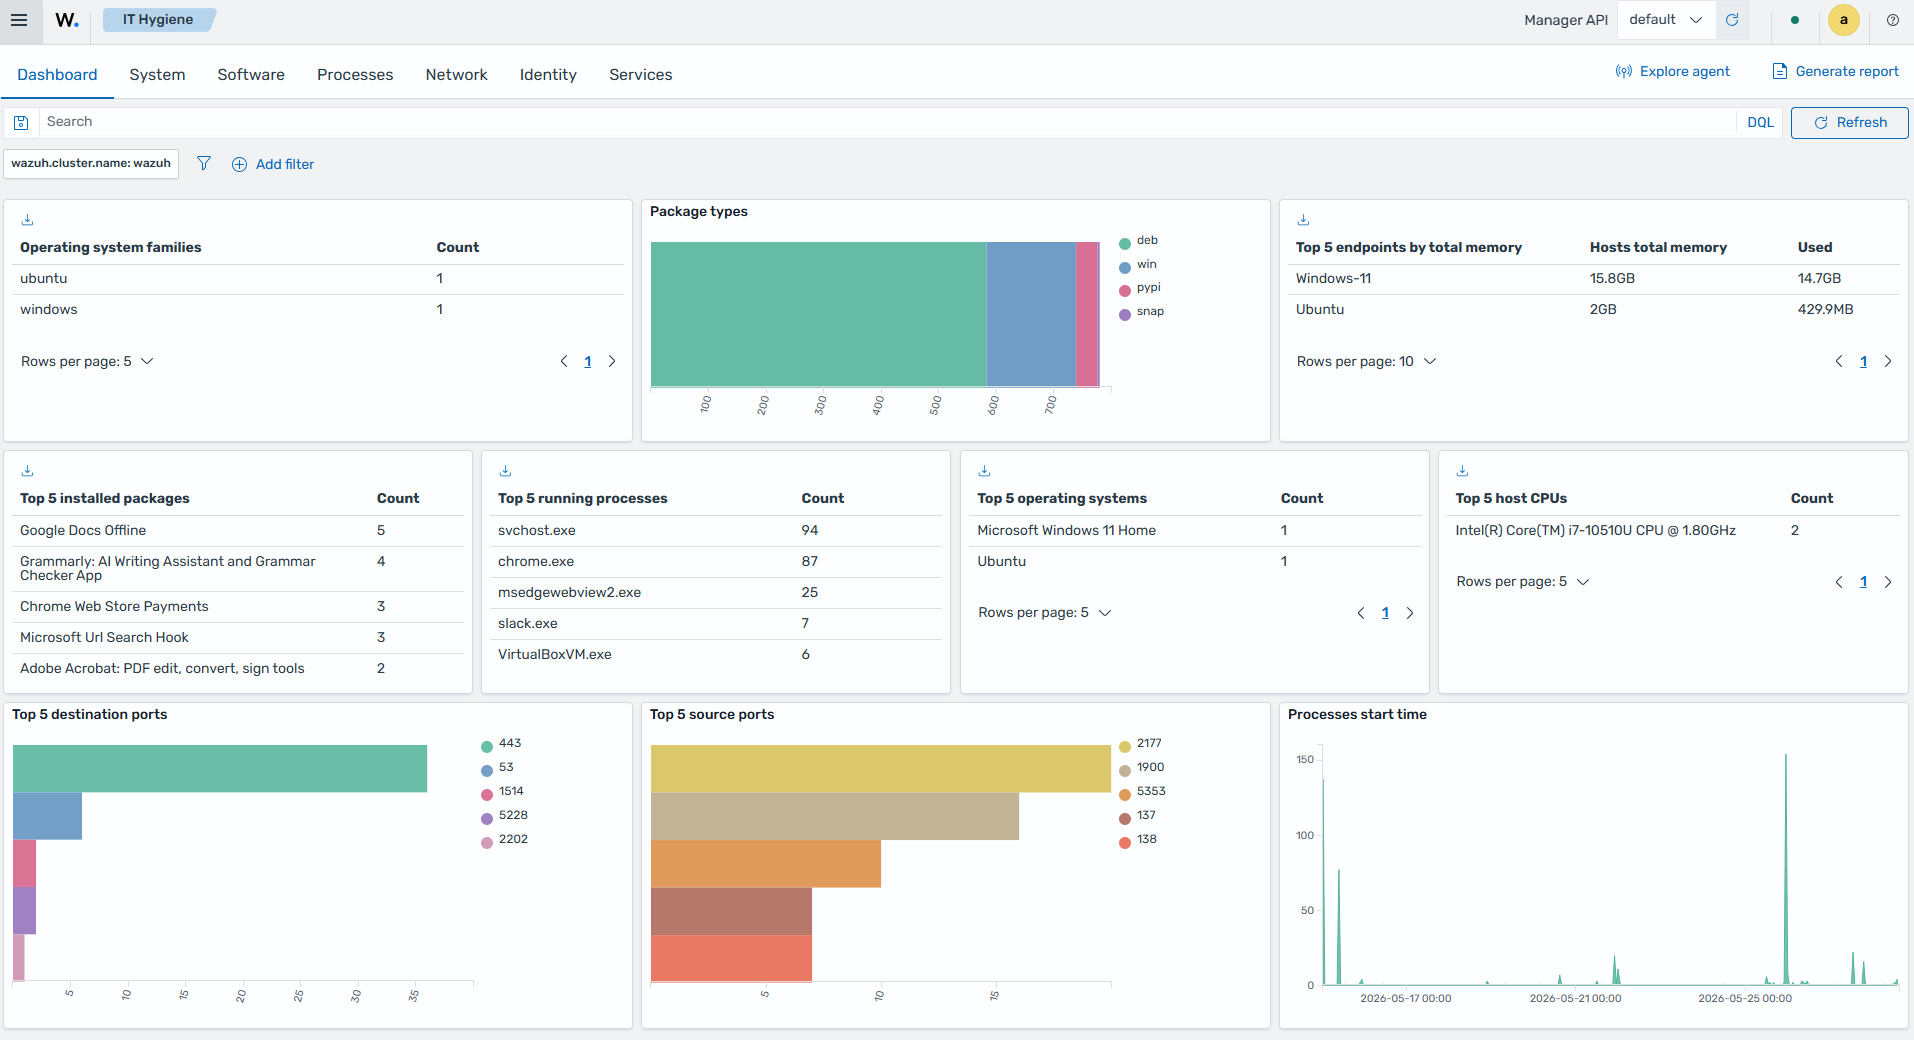
    IT Hygiene

    Regulatory compliance

    This dashboard shows compliance monitoring data mapped to regulatory standards and security benchmarks, including PCI DSS, HIPAA, GDPR, and CIS controls.
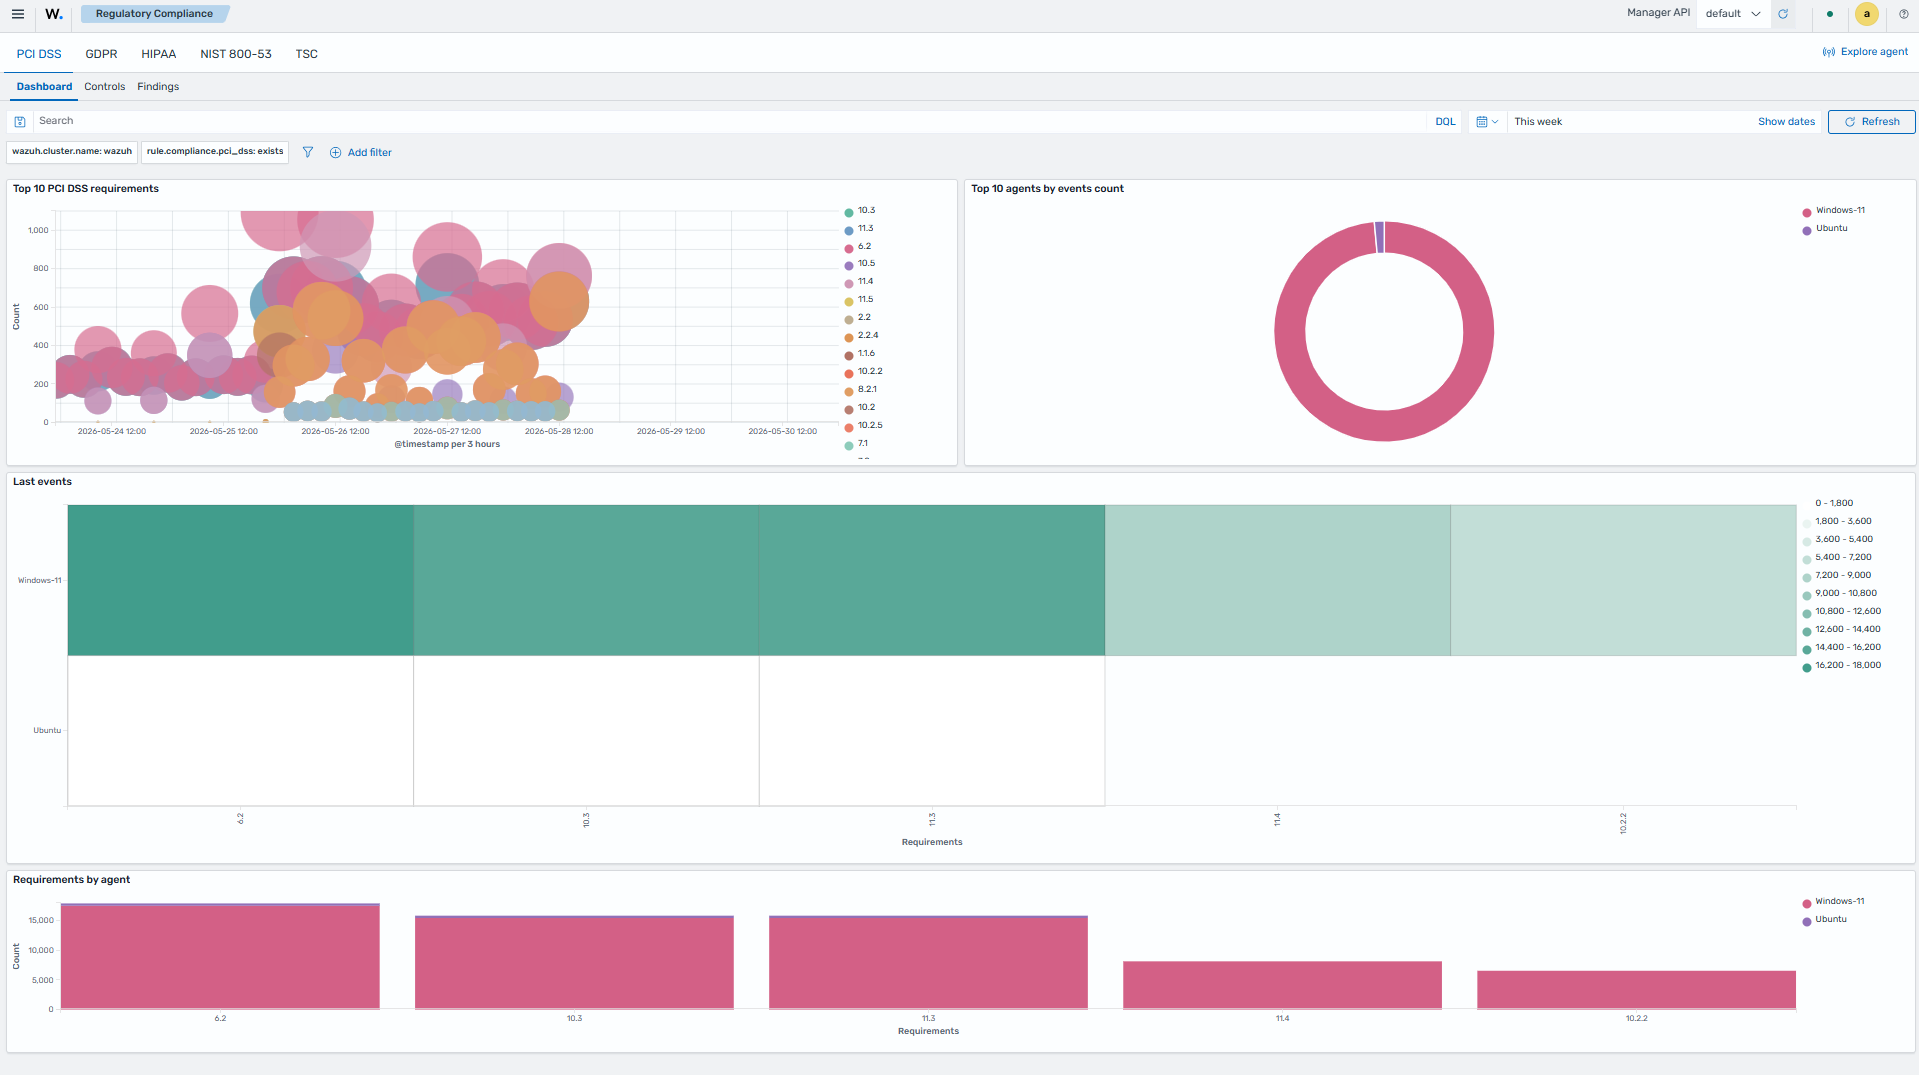
    Regulatory compliance

    Cloud security

    This section shows dashboards for monitoring cloud workloads, cloud service activity, security events, and compliance data across supported cloud platforms and services, including Docker, Amazon Web Services (AWS), Google Cloud, GitHub, Office 365, and Microsoft Graph Services.
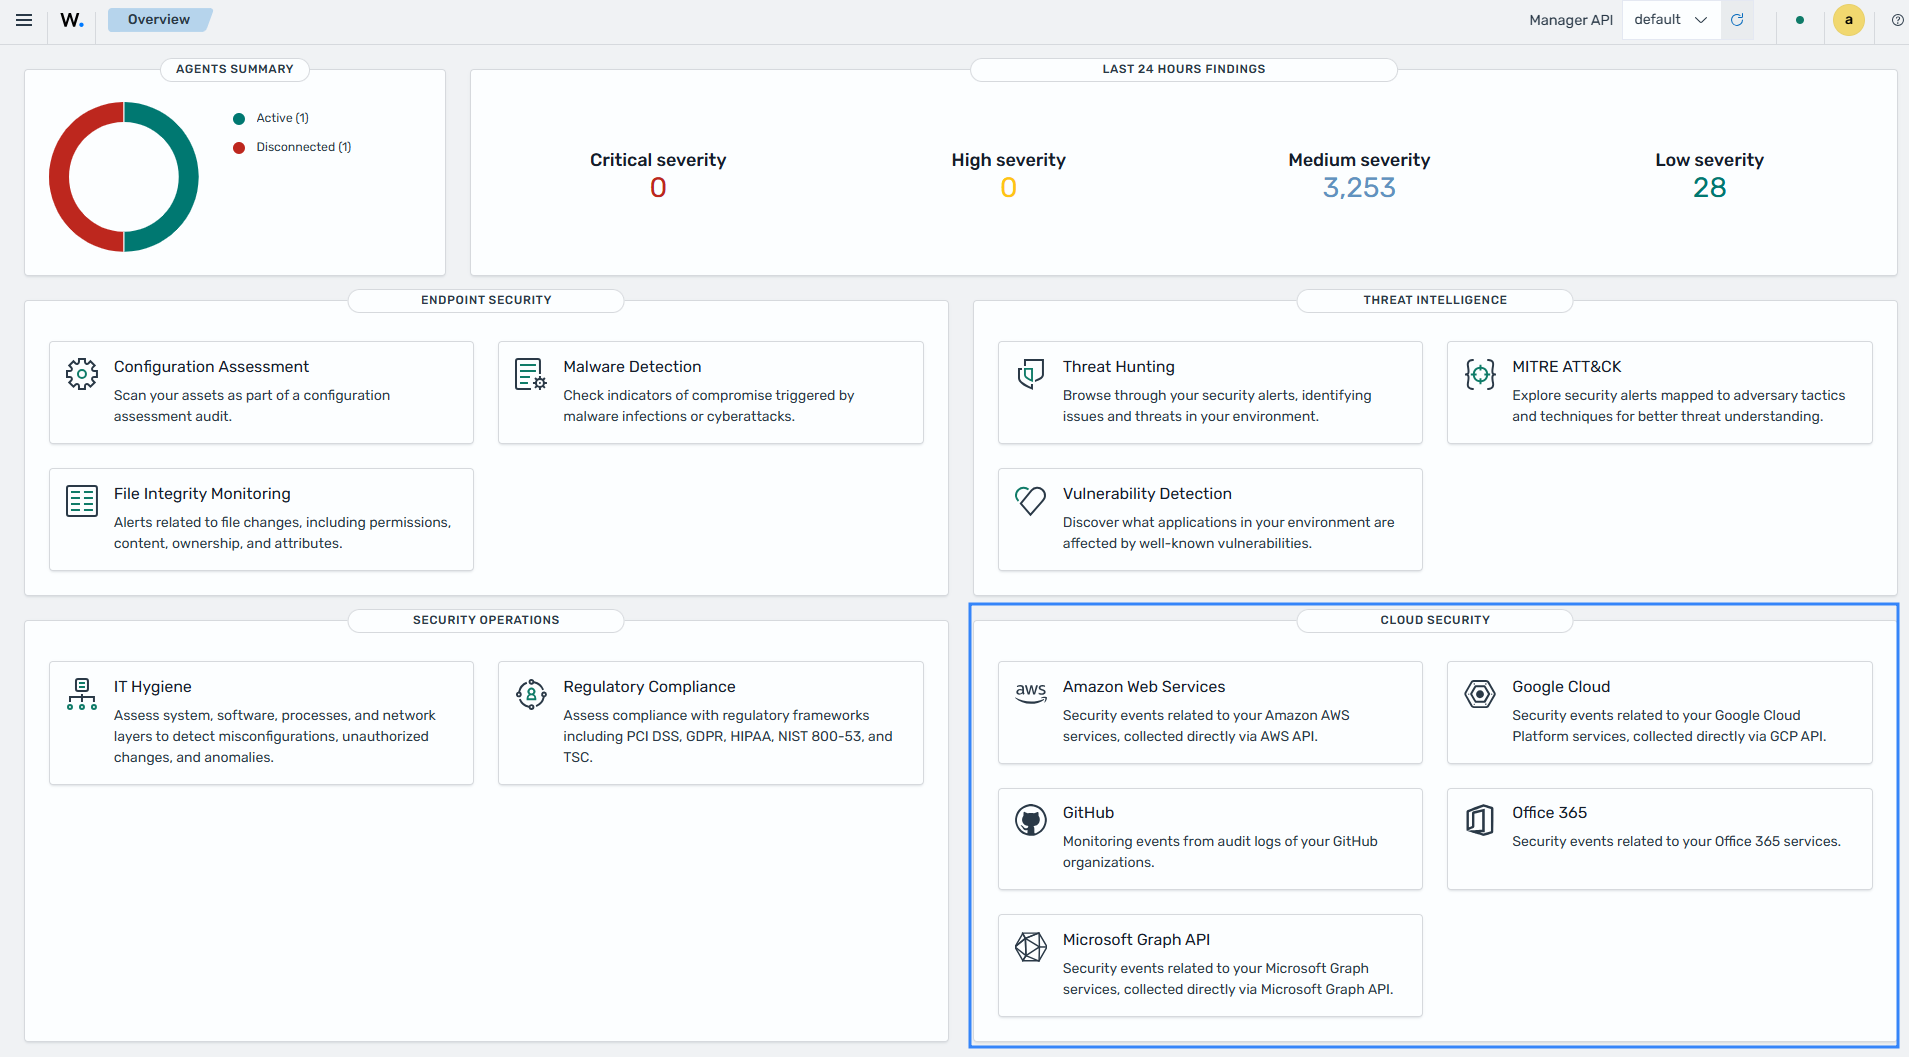
    Cloud security

    Security analytics

    Wazuh Security Analytics section provides options to manage the full lifecycle of log normalization and event-based detection. It centralizes the configuration of integrations, decoders, key-value databases (KVDBs), detectors, and detection rules within a unified interface. The Security Analytics dashboard also includes a log test tool that allows users to test Wazuh rules and decoders directly from the Wazuh dashboard.
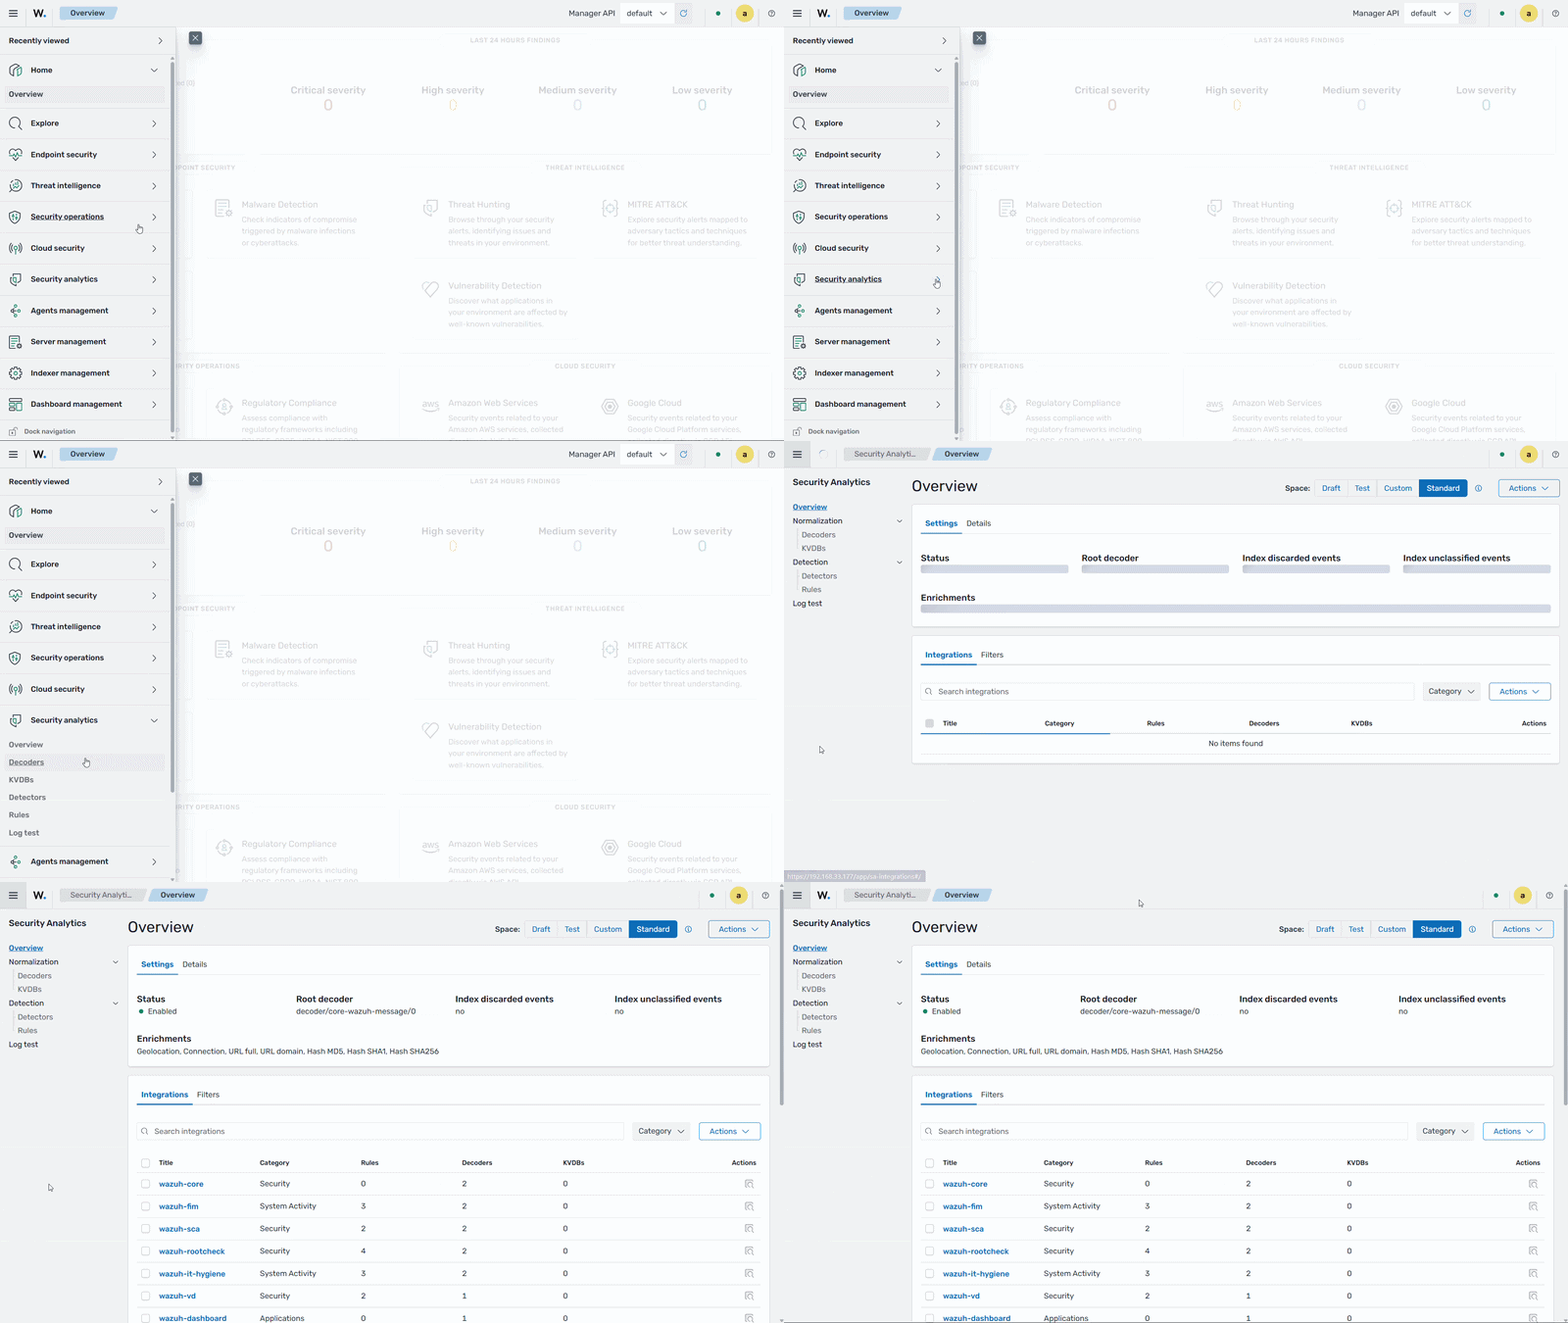
    Security analytics

    Integrations

    This section allows users to view and manage integrations available across the active spaces (Draft, Test, Custom, and Standard). An integration is the top-level organizational unit in Security Analytics that groups related decoders and rules for a specific log source or use case. This section displays all integrations available across the active spaces, along with their status and associated metadata.
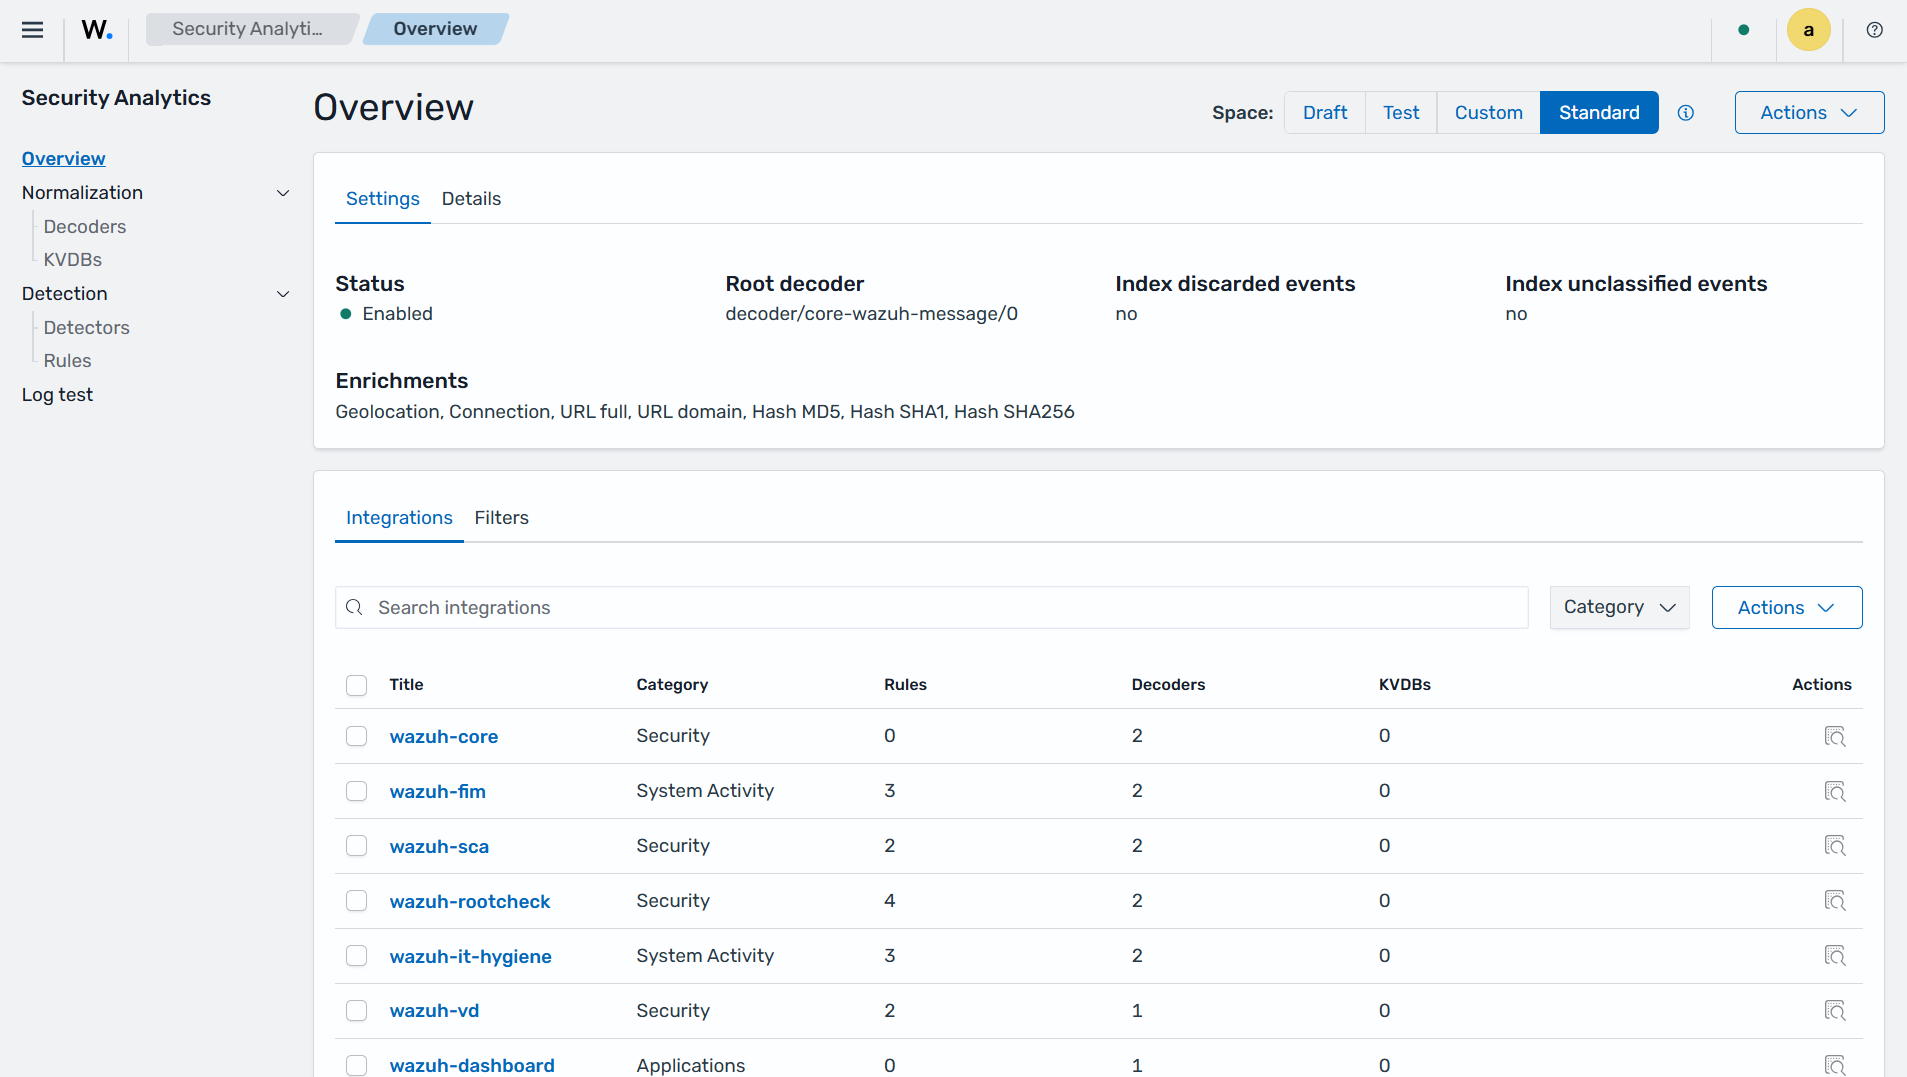
    Integrations

    Decoders

    The Decoders section allows users to query existing decoders and manage custom decoders.
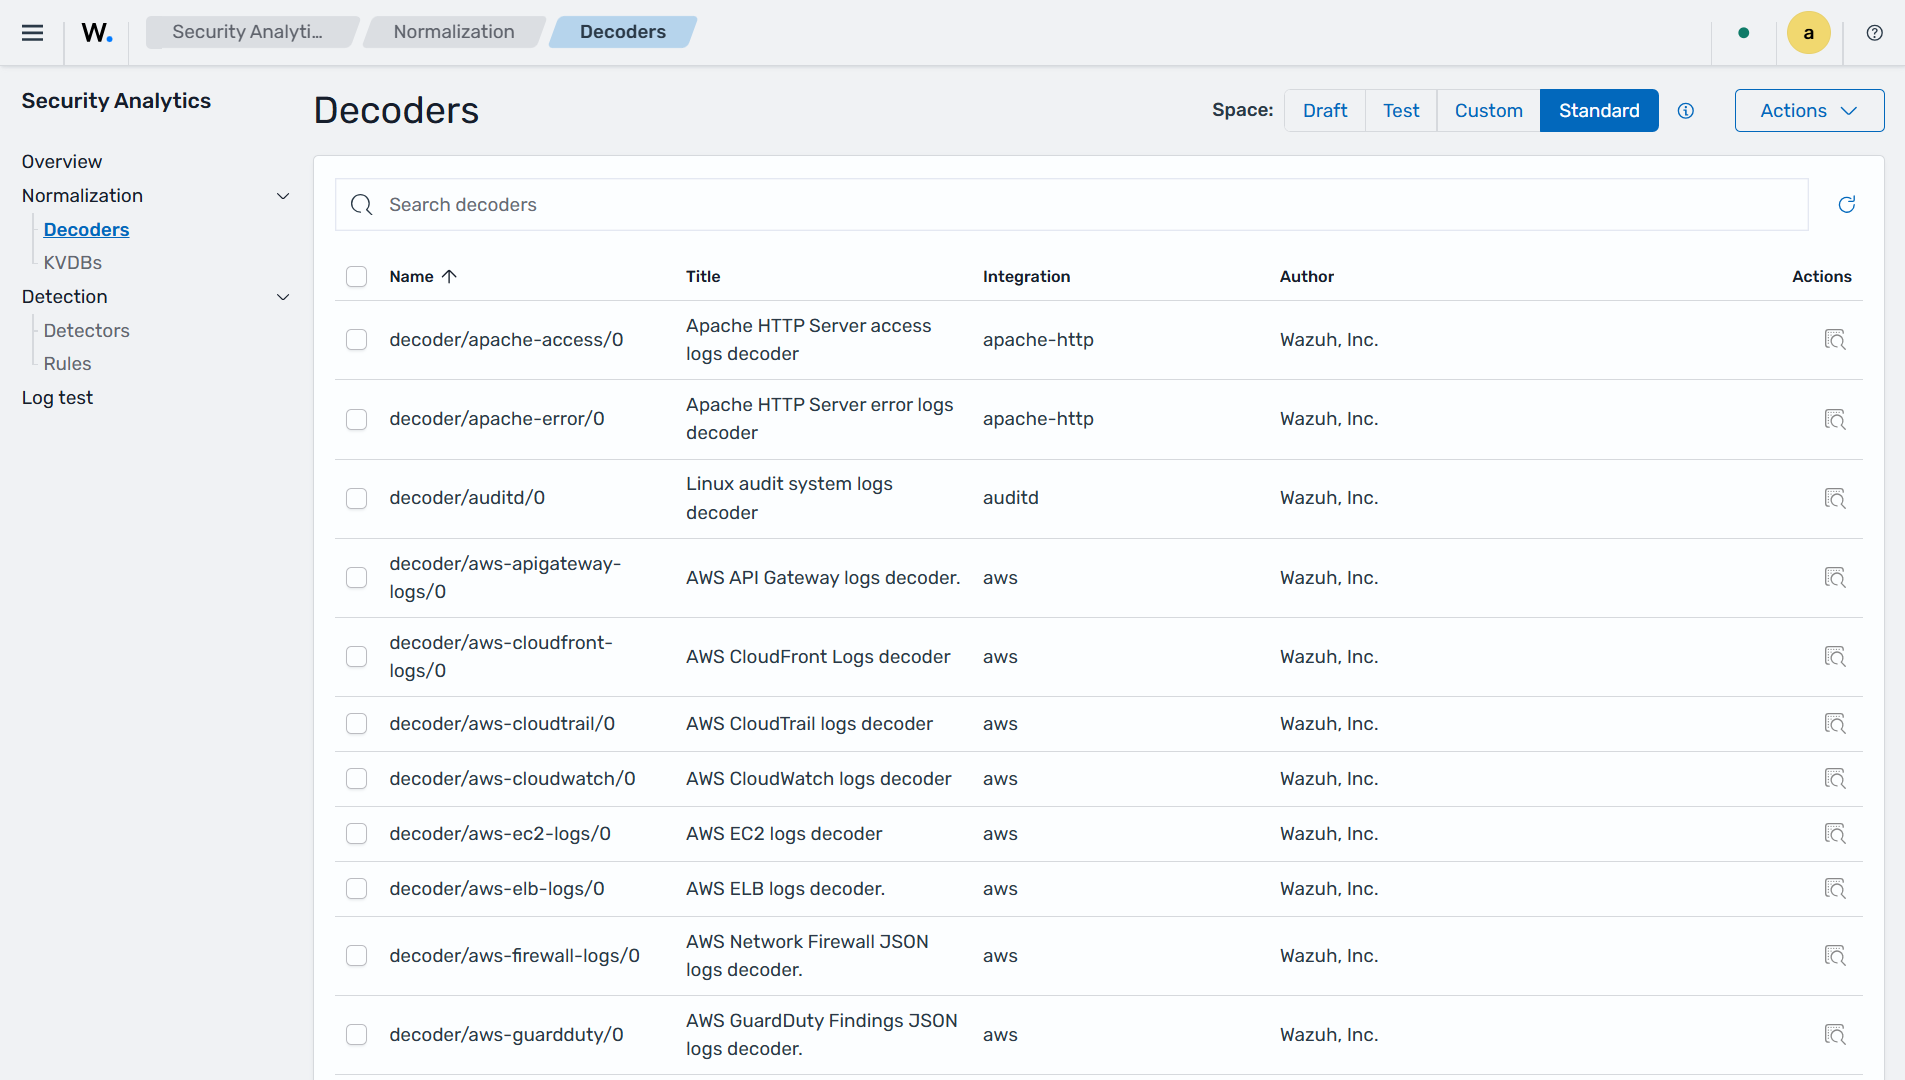
    Decoders

    Key-Value Database (KVDB)

    The KVDB section allows users to query existing KVDBs and manage custom KVDBs. A KVDB is a lookup table that can be referenced in the decoder or rule logic to enrich events with additional context. KVDB lists can act as either allow or deny lists and replace the Constant database lists used in Wazuh 4.x version.
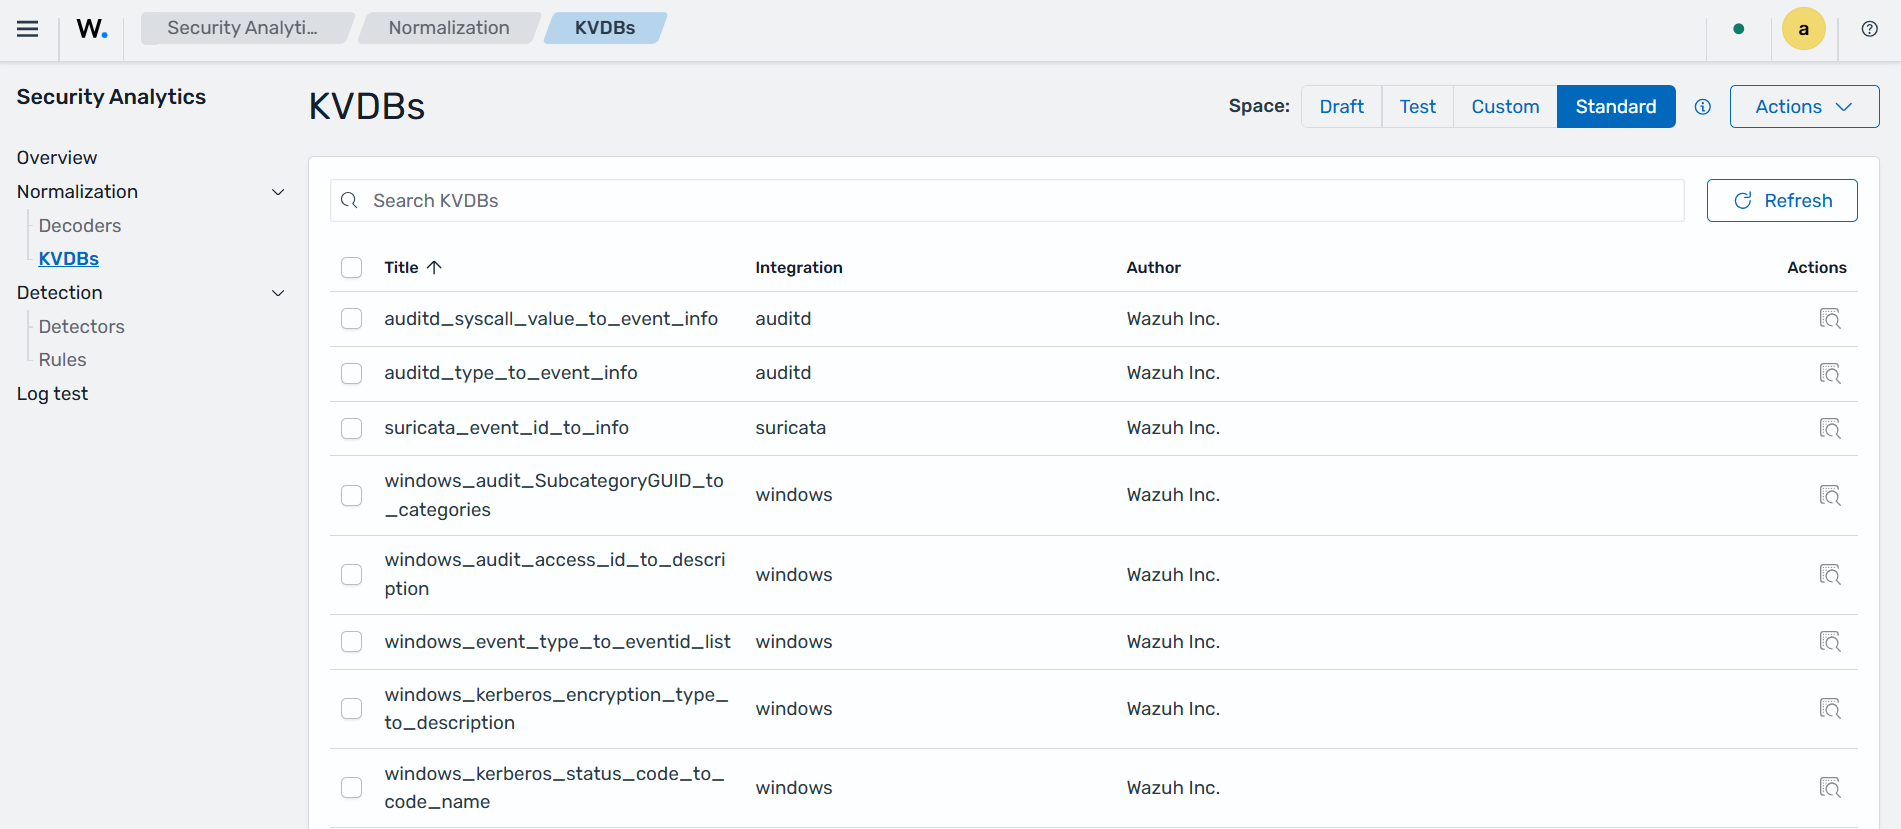
    KVDB

    Detectors

    The Detectors section allows users to query existing detectors and manage custom detectors. A detector connects detection rules to a specific data source (an index or alias) and runs continuously to identify security findings. This allows organizations to apply specific detection logic to selected log sources for continuous threat monitoring.
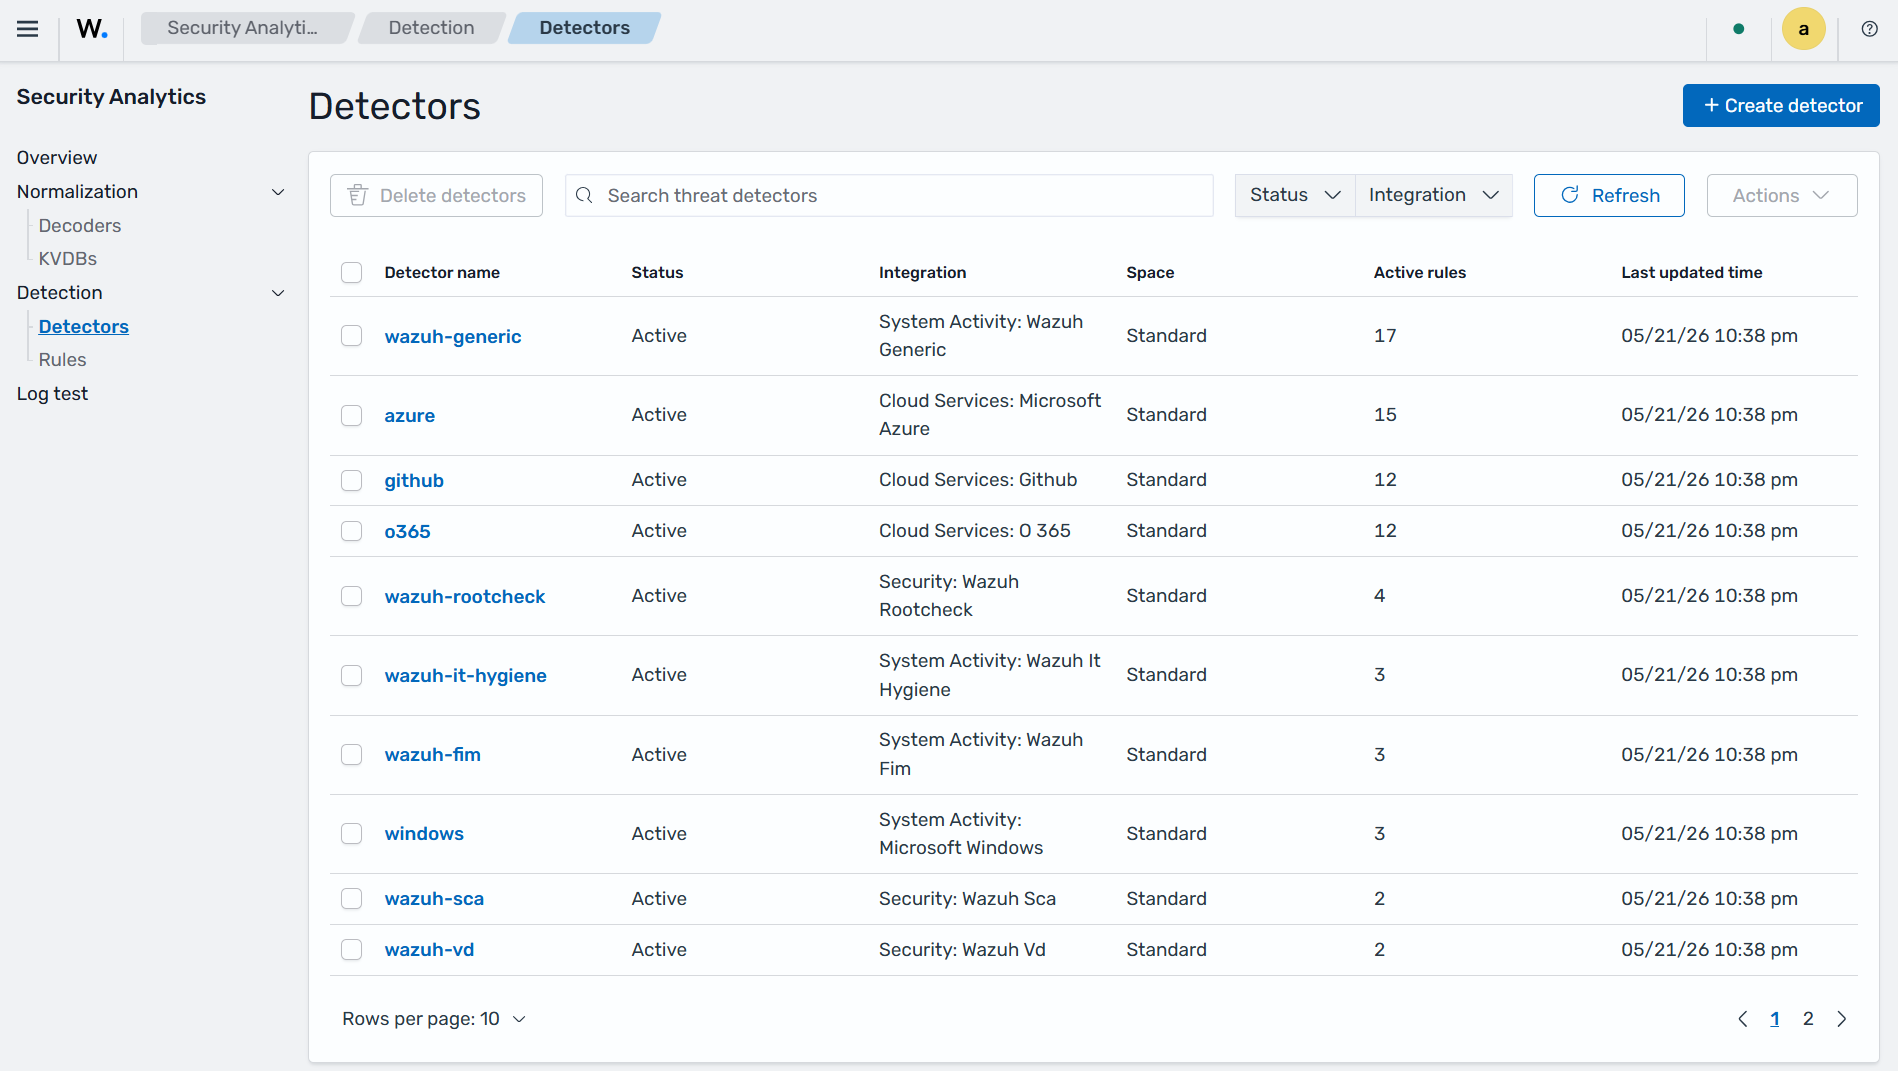
    Detectors

    Rules

    The Rules section allows users to query existing rules and manage custom rules.
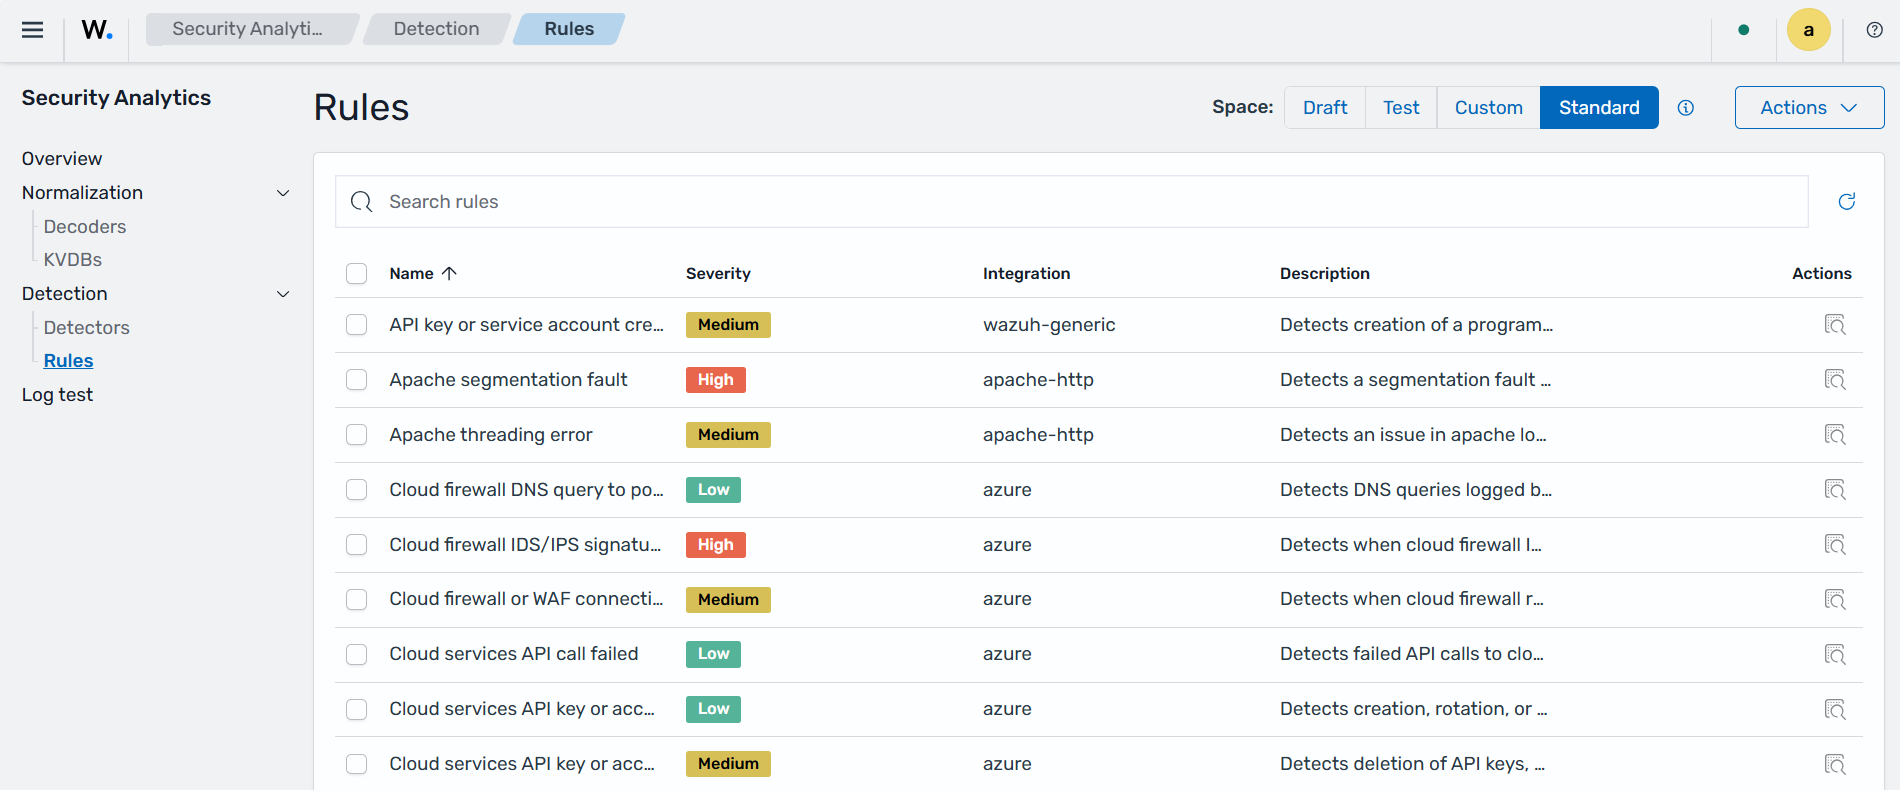
    Rules

    Log test

    The Wazuh Log Test tool allows users to test Wazuh rules and decoders from the Wazuh dashboard.
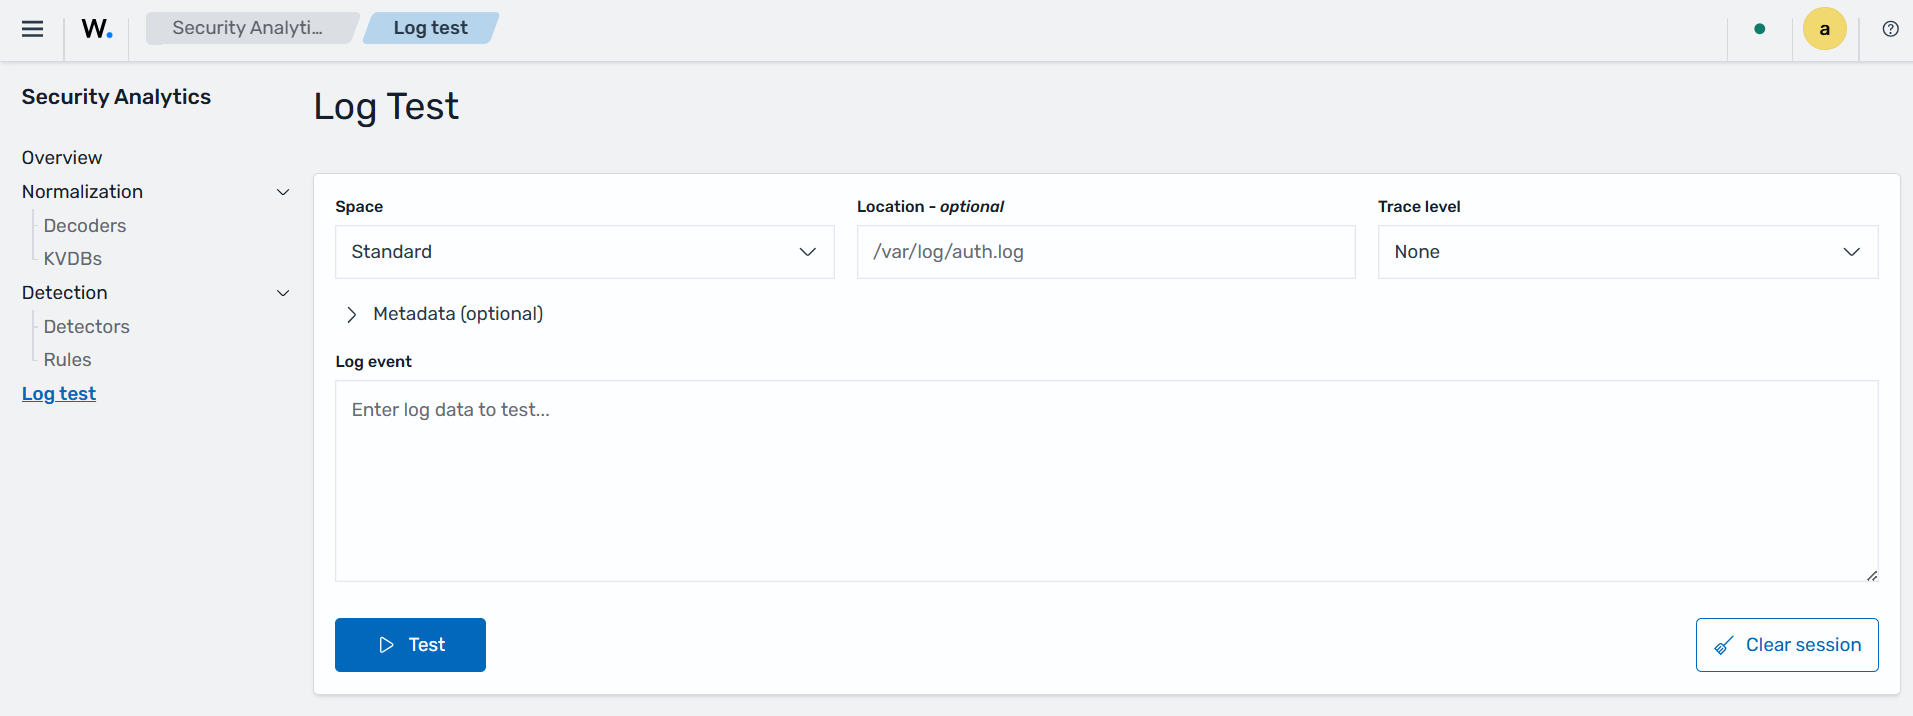
    Log test

    Agents management

    Wazuh Agents management section offers options for managing agents, agent groups, and agent configurations.
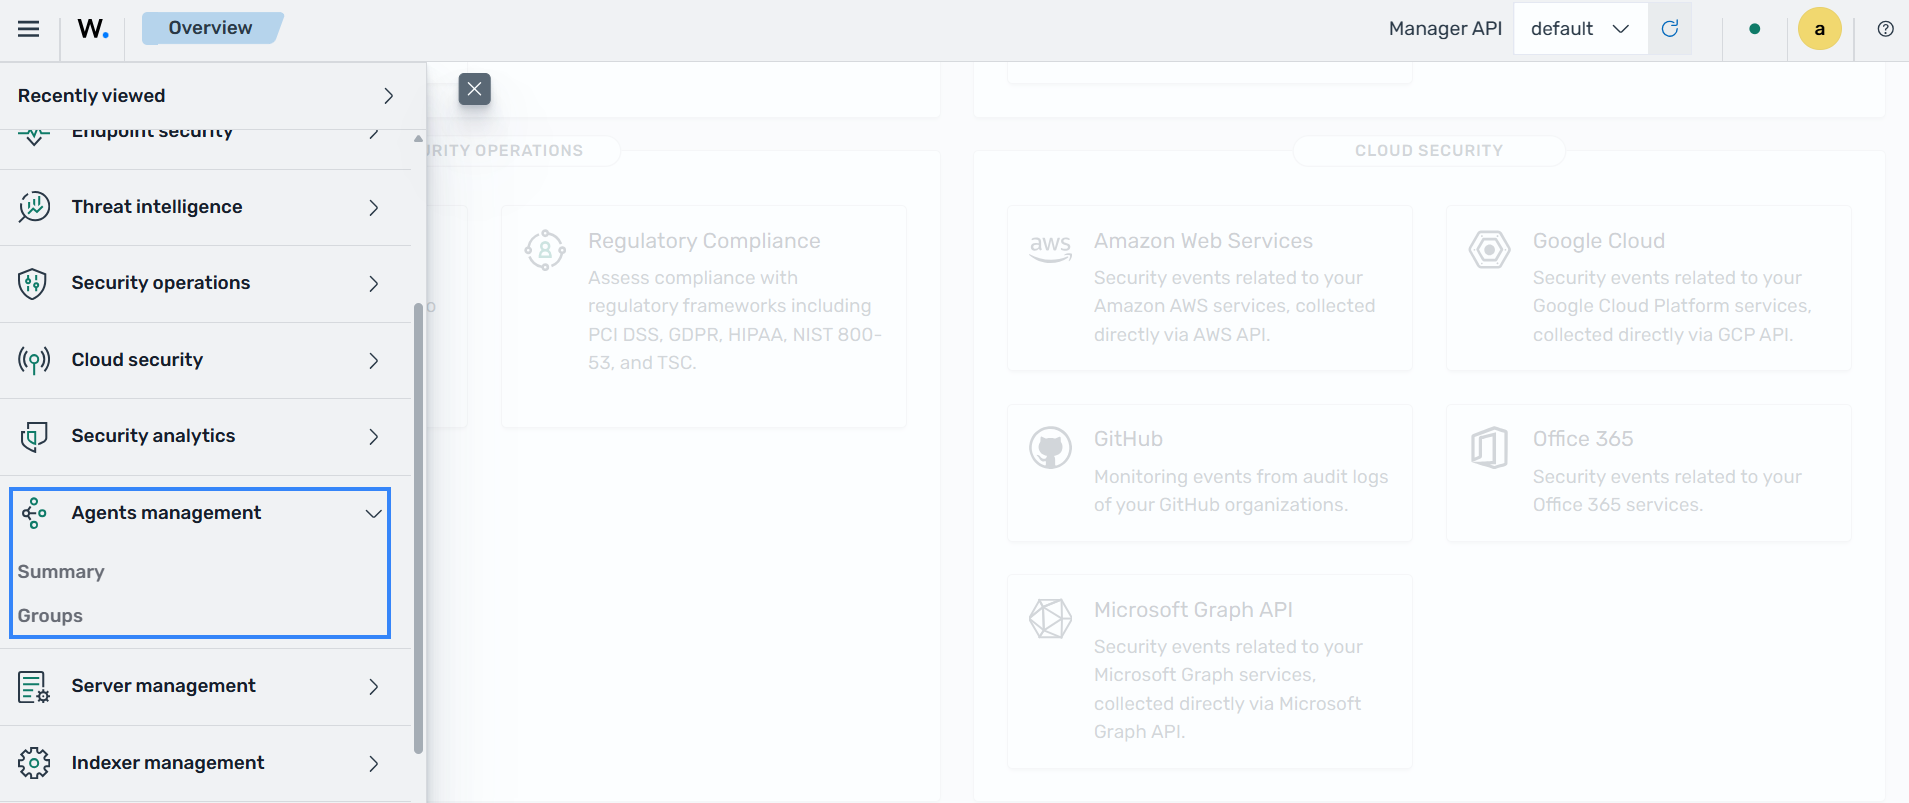
    Agents management

    Summary

    This section shows details of monitored endpoints and options for deploying Wazuh agents.
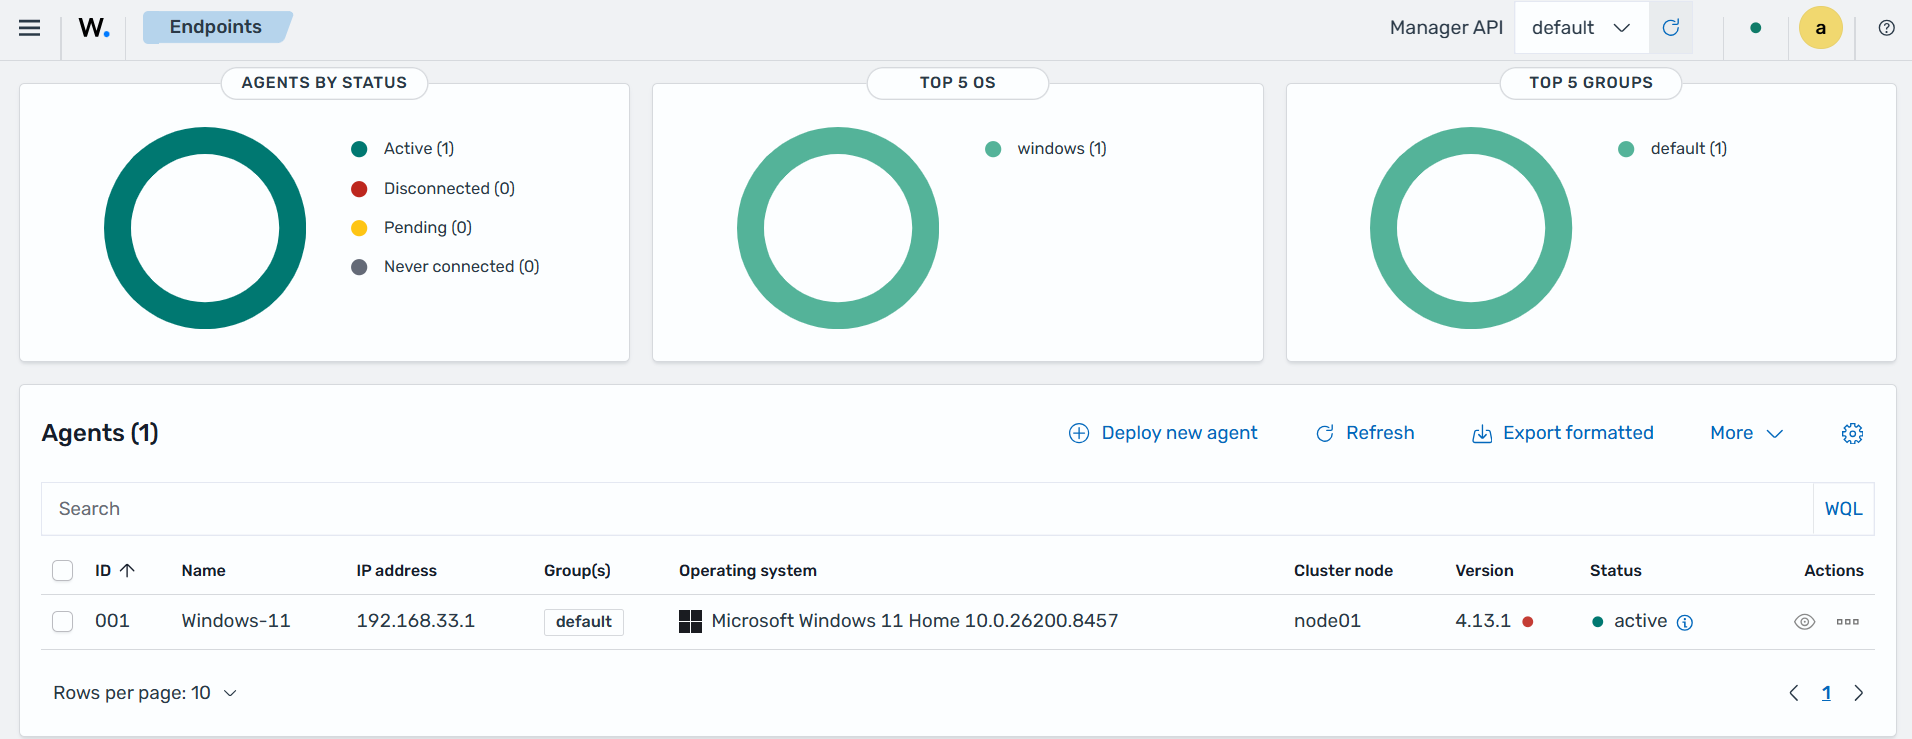
    Endpoints summary

    Groups

    Users can view existing groups, create new endpoint groups, and organize endpoints based on these groups.
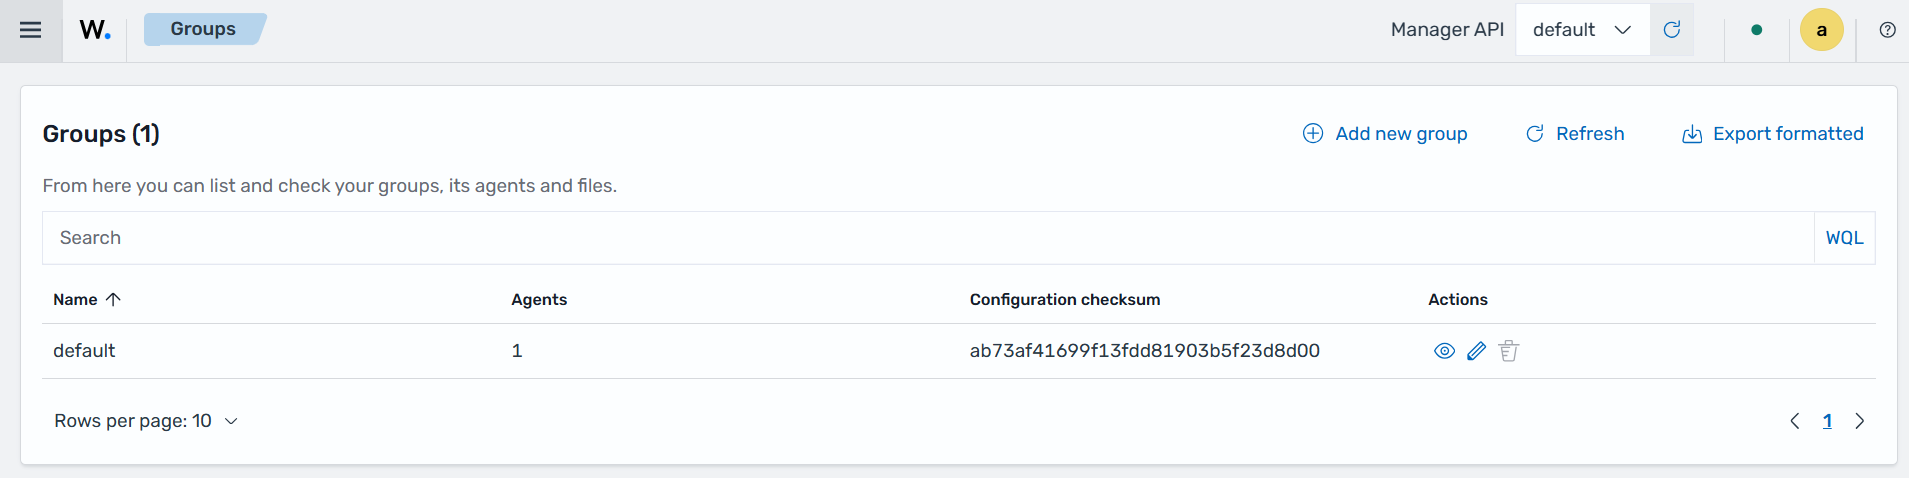
    Endpoint groups

    Server management

    Wazuh Server Management section provides options for managing the Wazuh manager and security configurations. It allows users to manage users, roles, policies, and review Wazuh manager logs on the Wazuh dashboard.
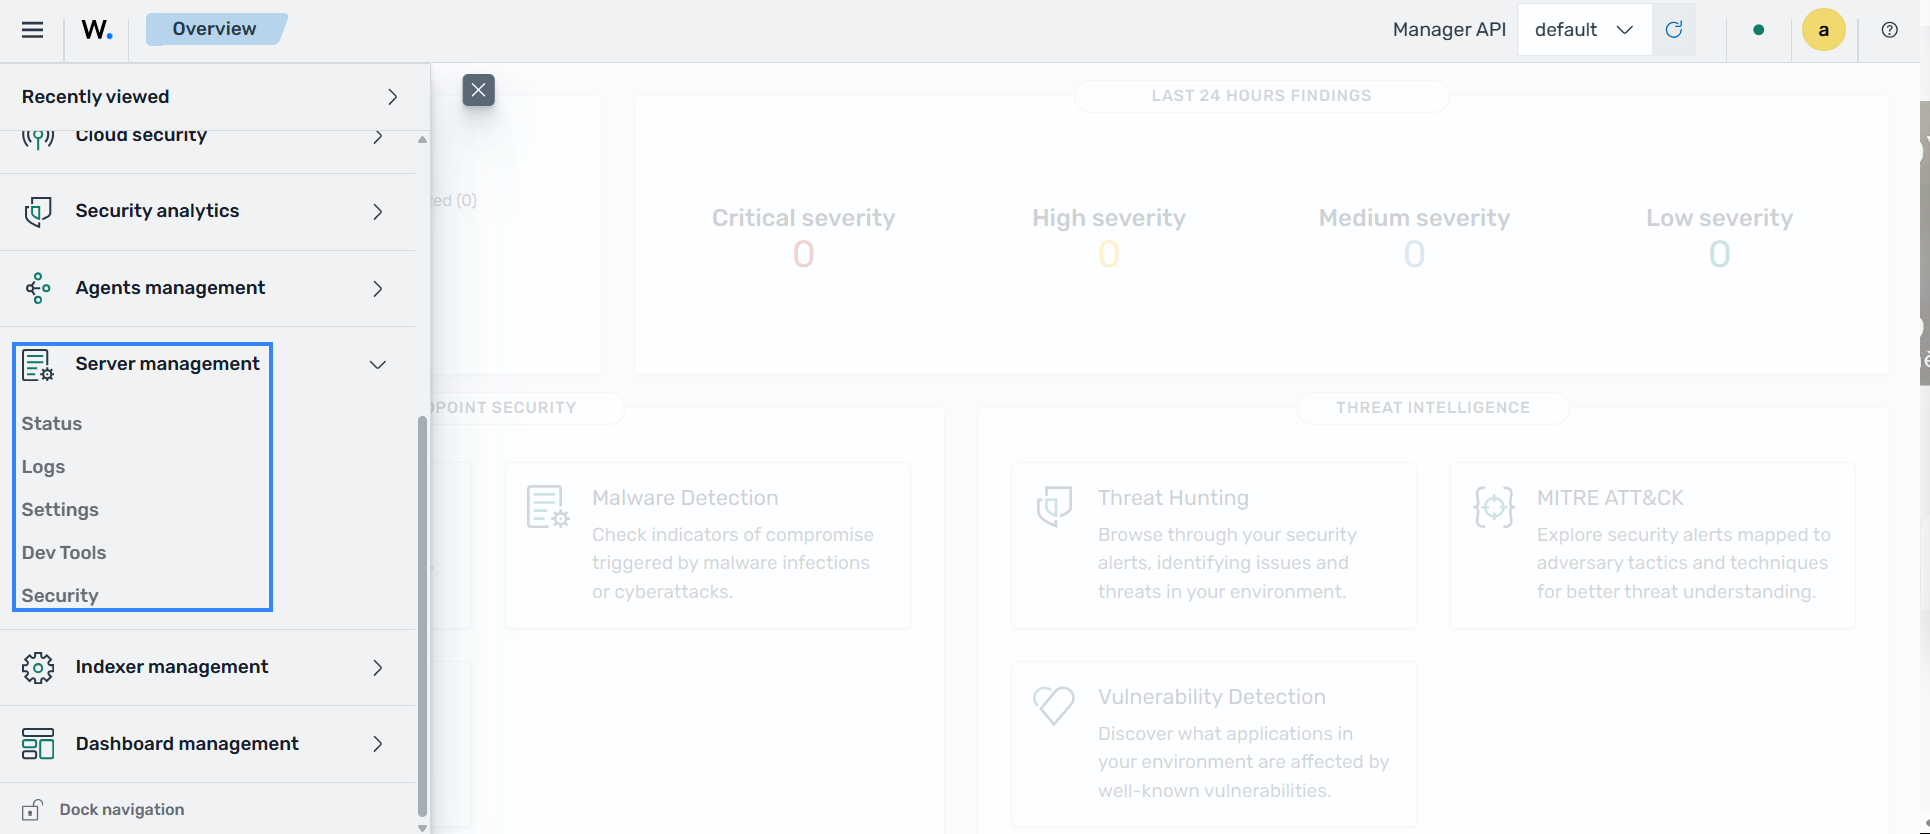
    Server management

    Status

    Users can view the status of different Wazuh daemons, the overall Wazuh agent status, Wazuh manager information, and more.
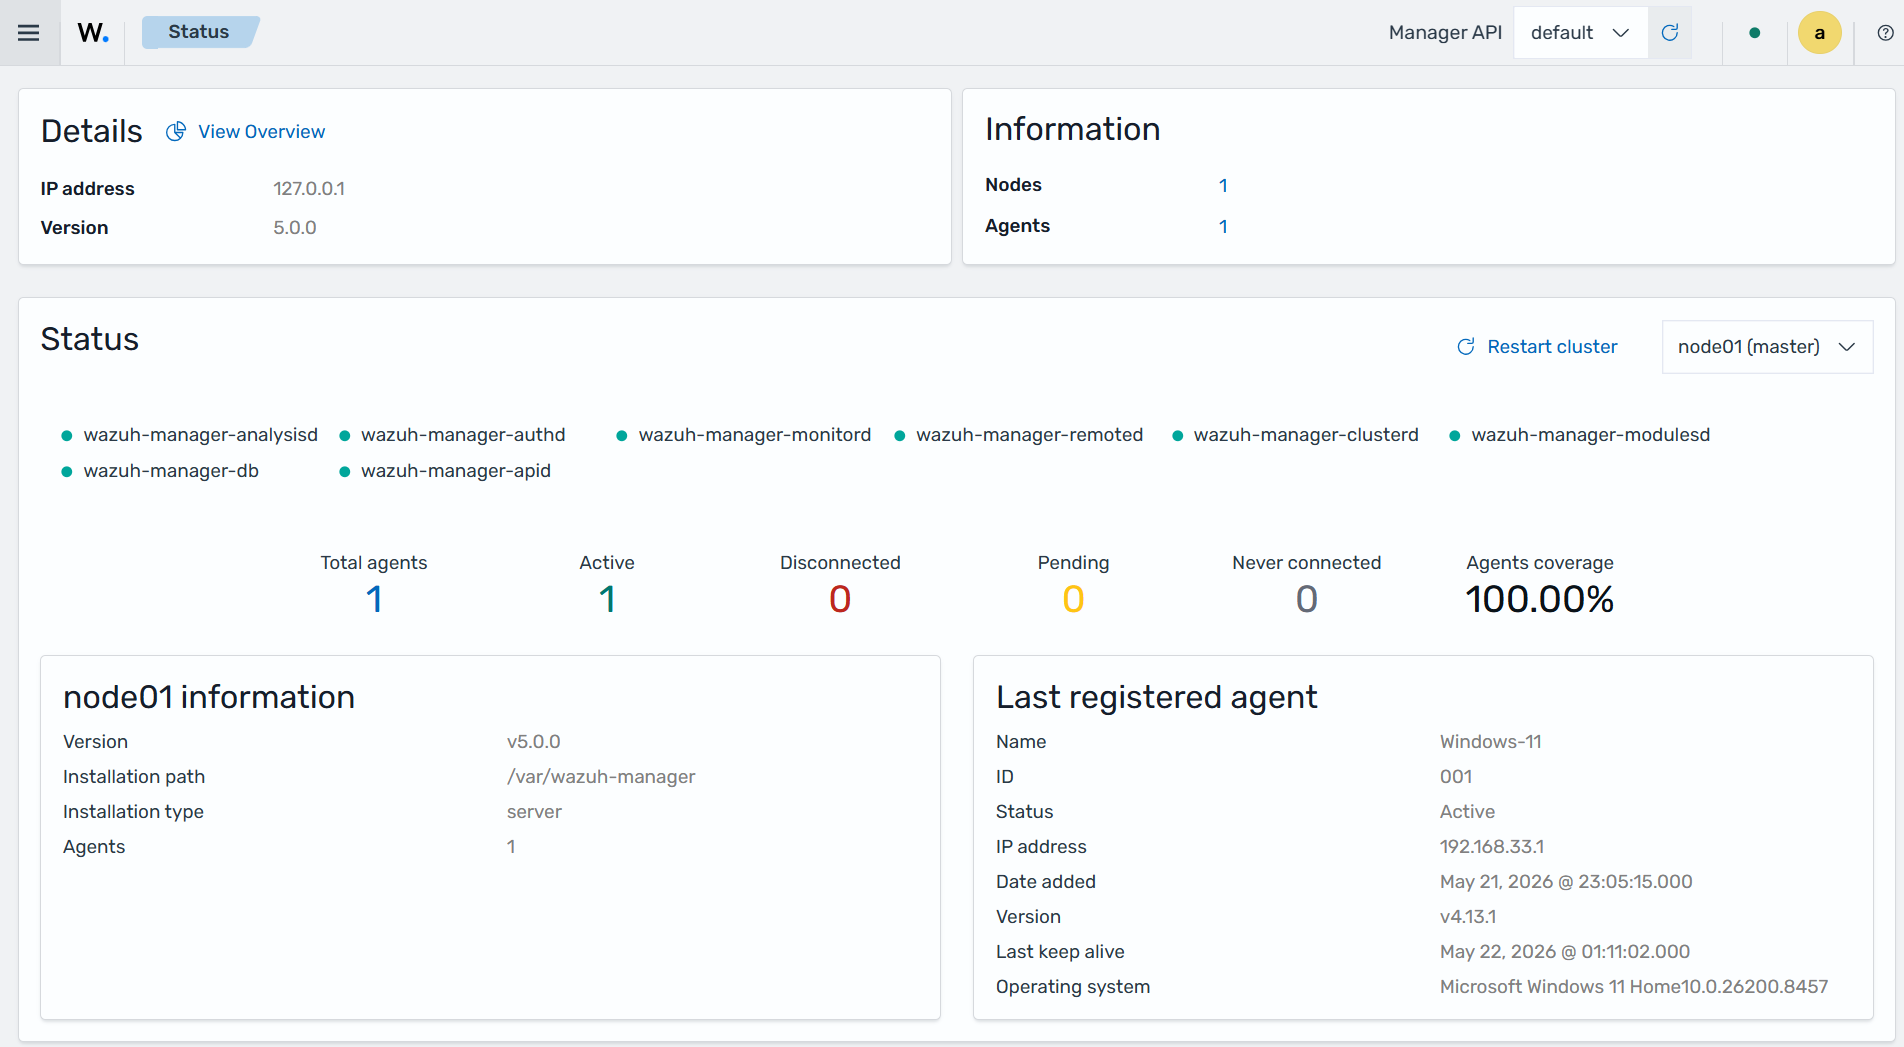
    Status

    Logs

    Logs stored in /var/wazuh-manager/logs/wazuh-manager.log in the Wazuh manager are shown in the section below.
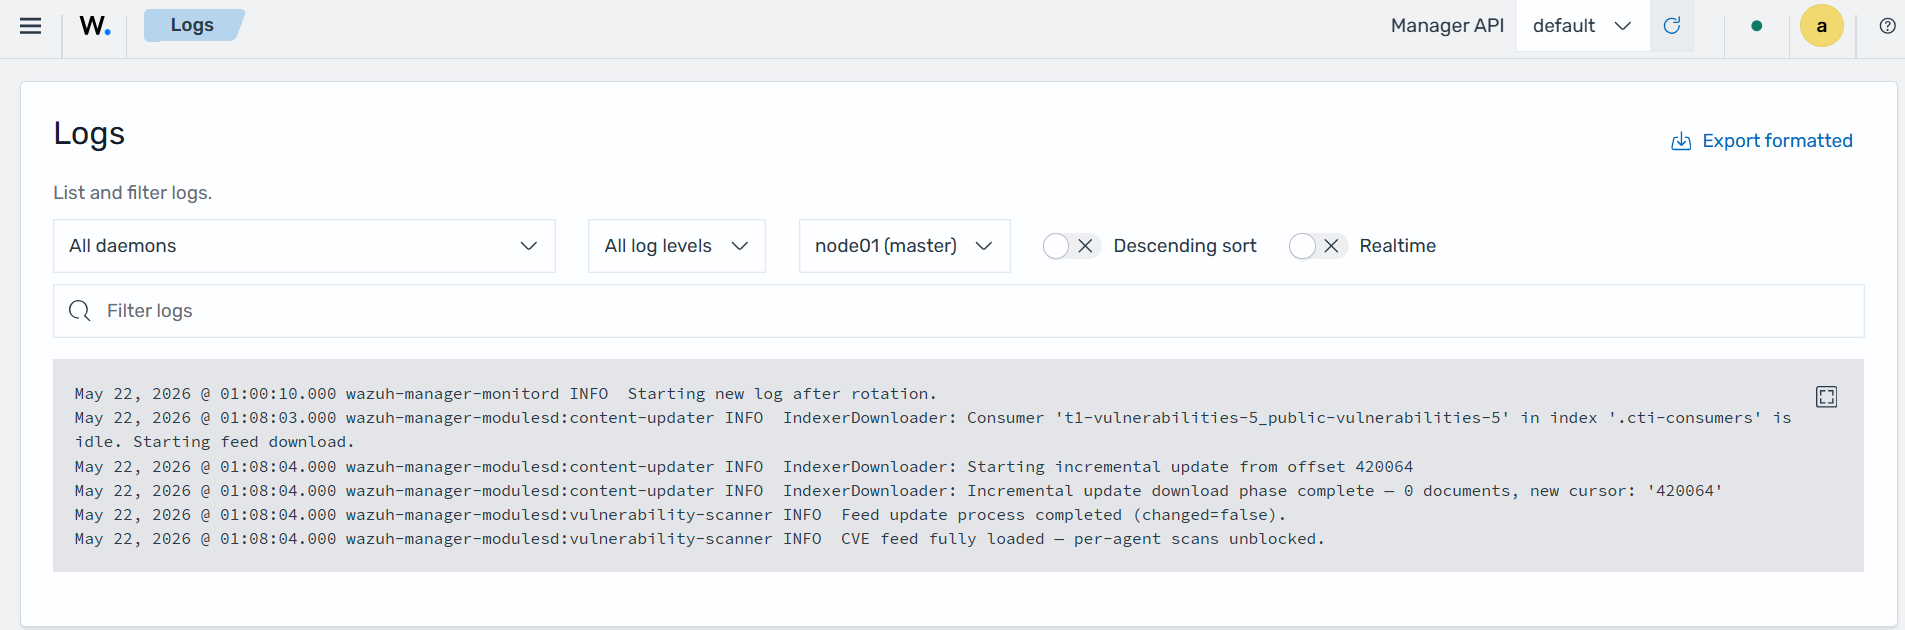
    Logs

    Settings

    Users can modify the Wazuh manager configuration file located at /var/wazuh-manager/etc/ossec.conf from the Wazuh dashboard.
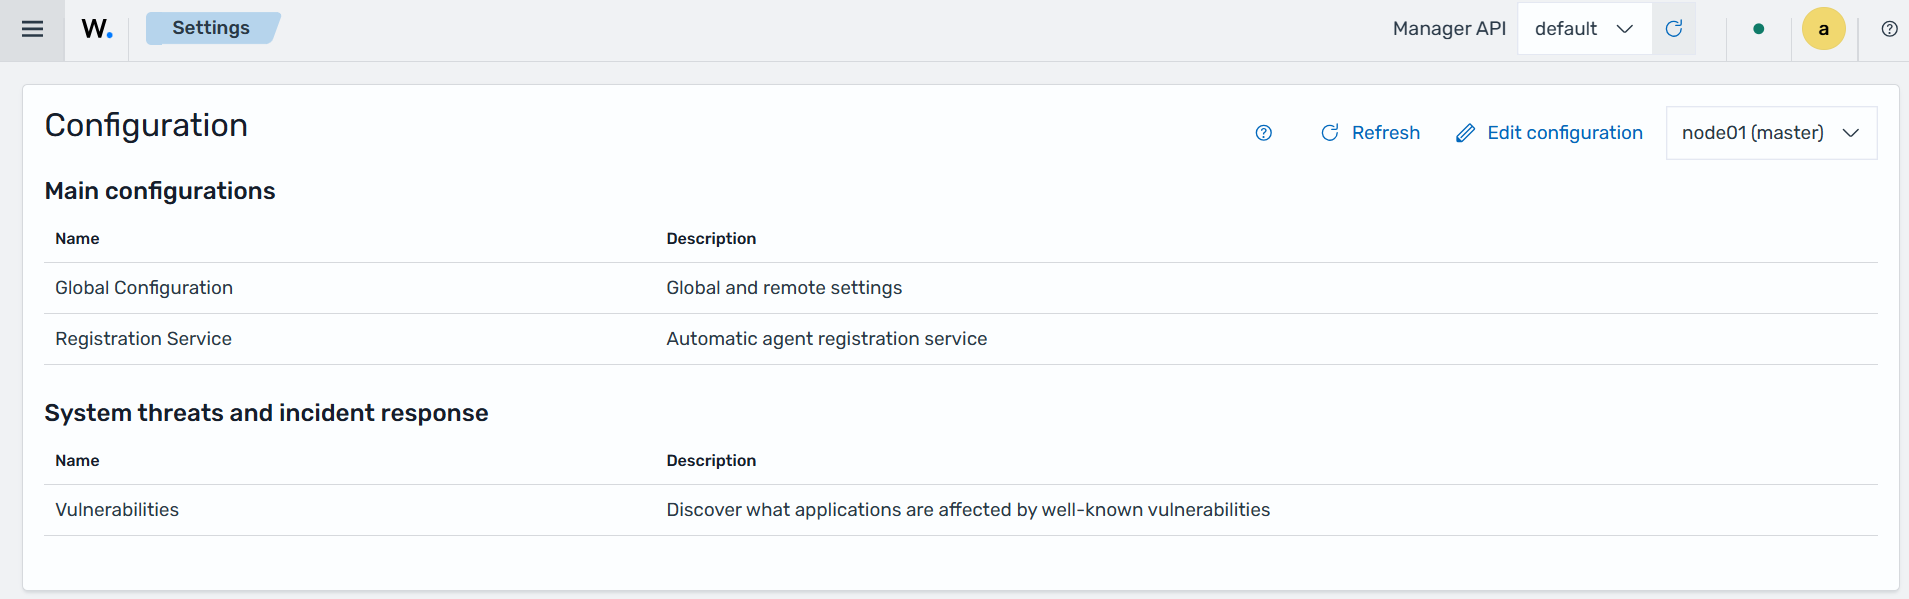
    Settings

    Dev Tools

    This section allows users to send queries using the Wazuh manager API. It can be used to retrieve information and perform operations related to agent management, security configuration, cluster management, file integrity monitoring, security events, inventory data, vulnerabilities, and other Wazuh platform features.
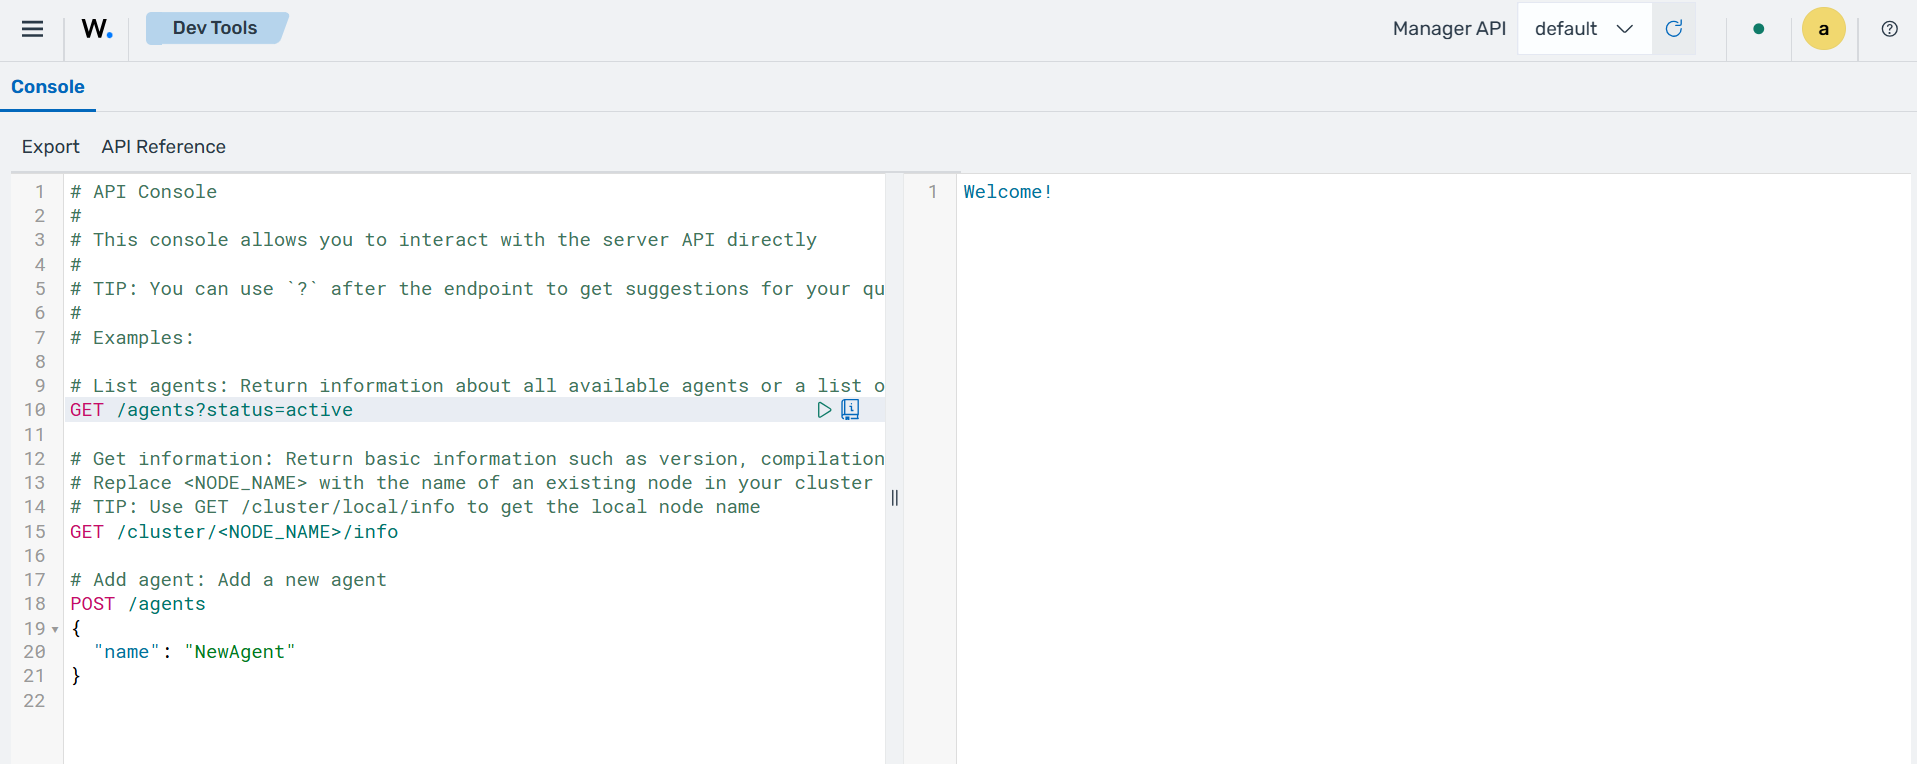
    Dev Tools

    Security

    This section provides role-based access control (RBAC) configuration options for the Wazuh platform. It allows administrators to manage internal users, roles, role mappings, and policies used to control access to Wazuh resources and features.
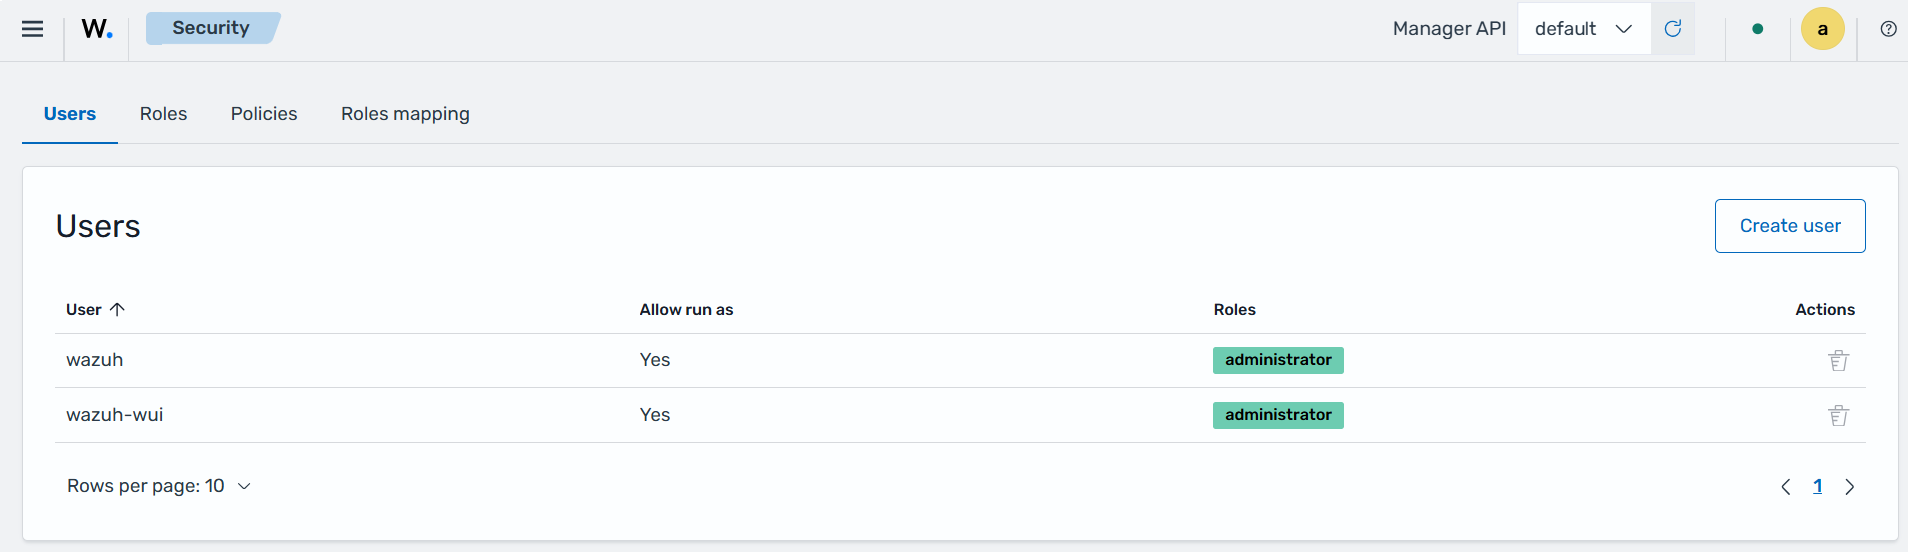
    Security - Users

    The Roles tab shows the existing roles alongside the policies assigned to those roles. It also includes the option for creating users.
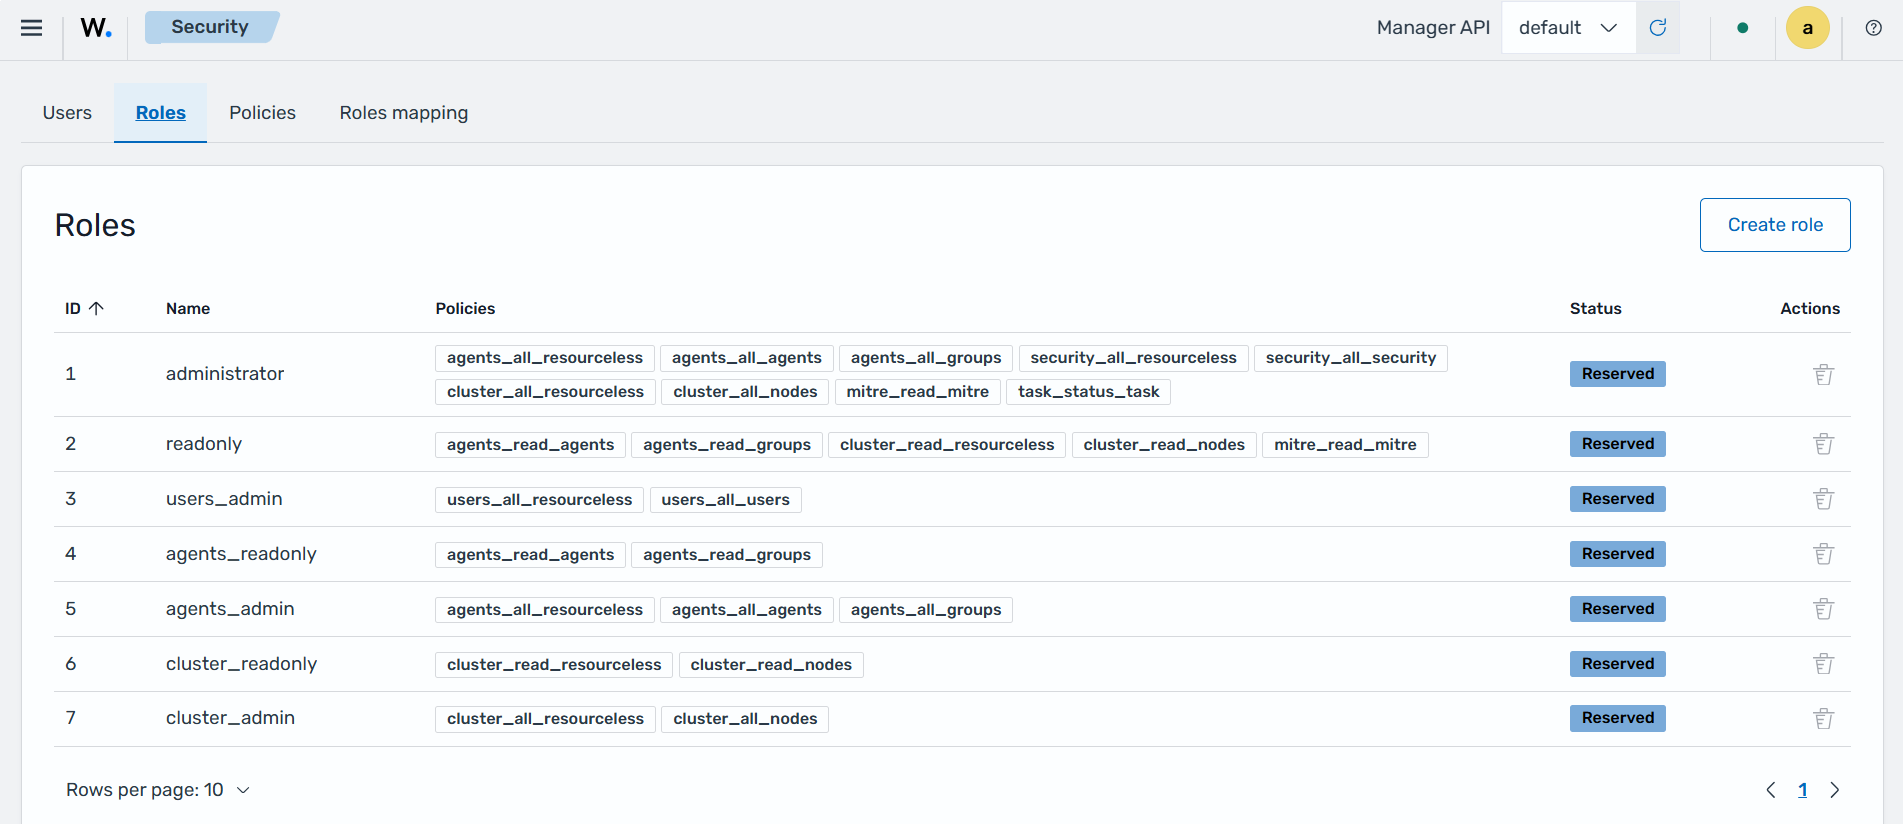
    Security - Roles

    The Policies tab shows the policies that define the actions that can be performed by the internal users. These policies are assigned to roles.
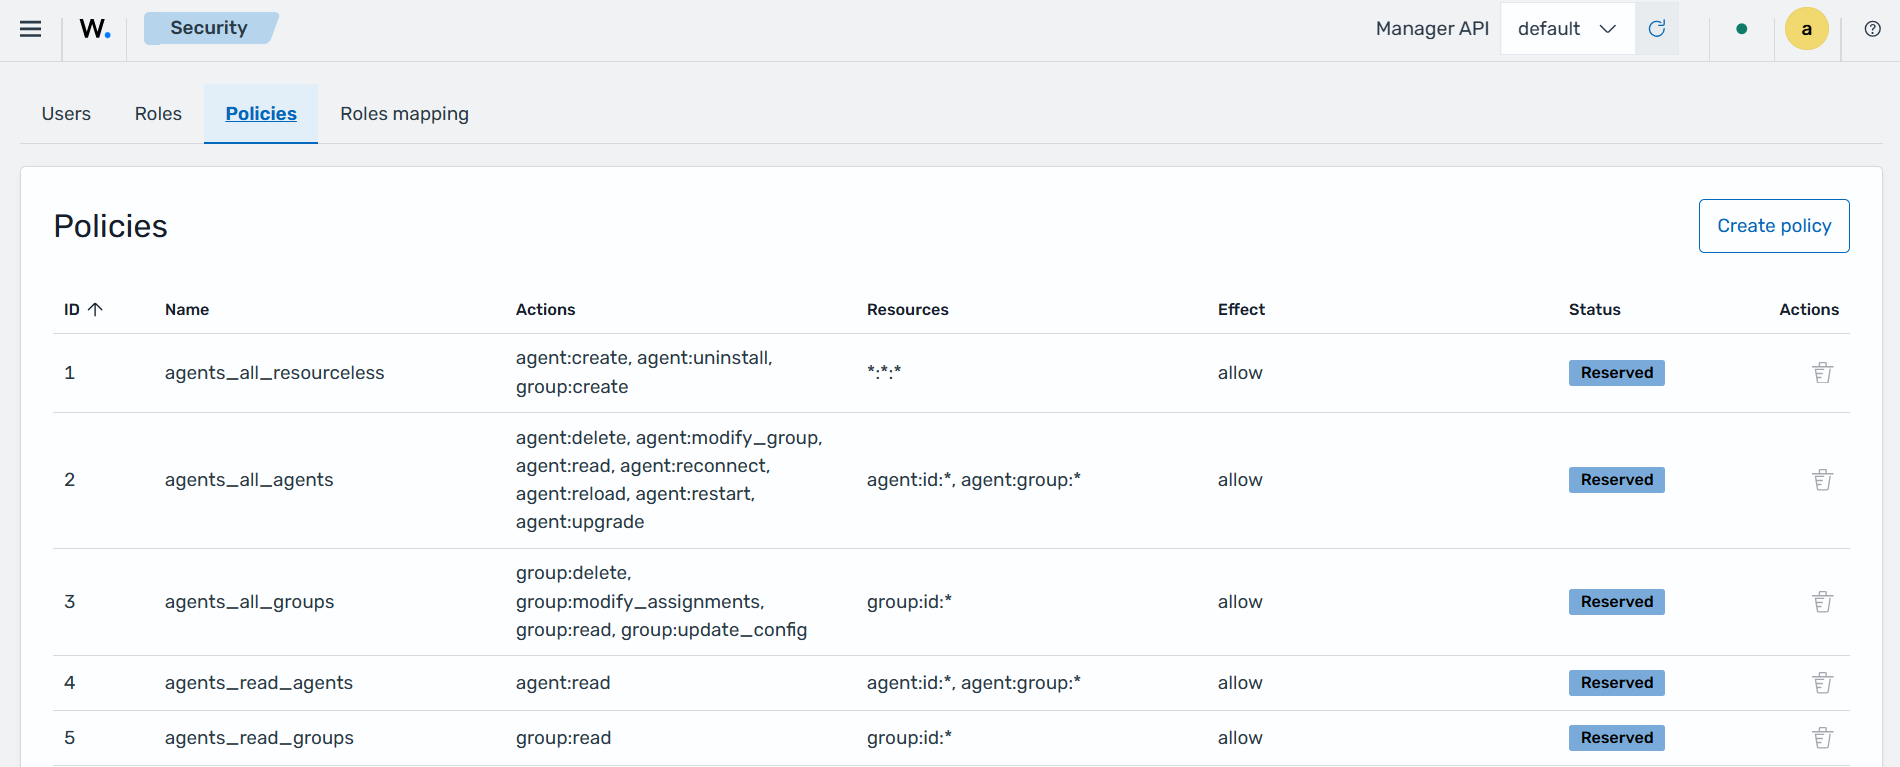
    Security - Policies

    The Roles mapping tab presents users with the option to assign different roles and policies to internal users.
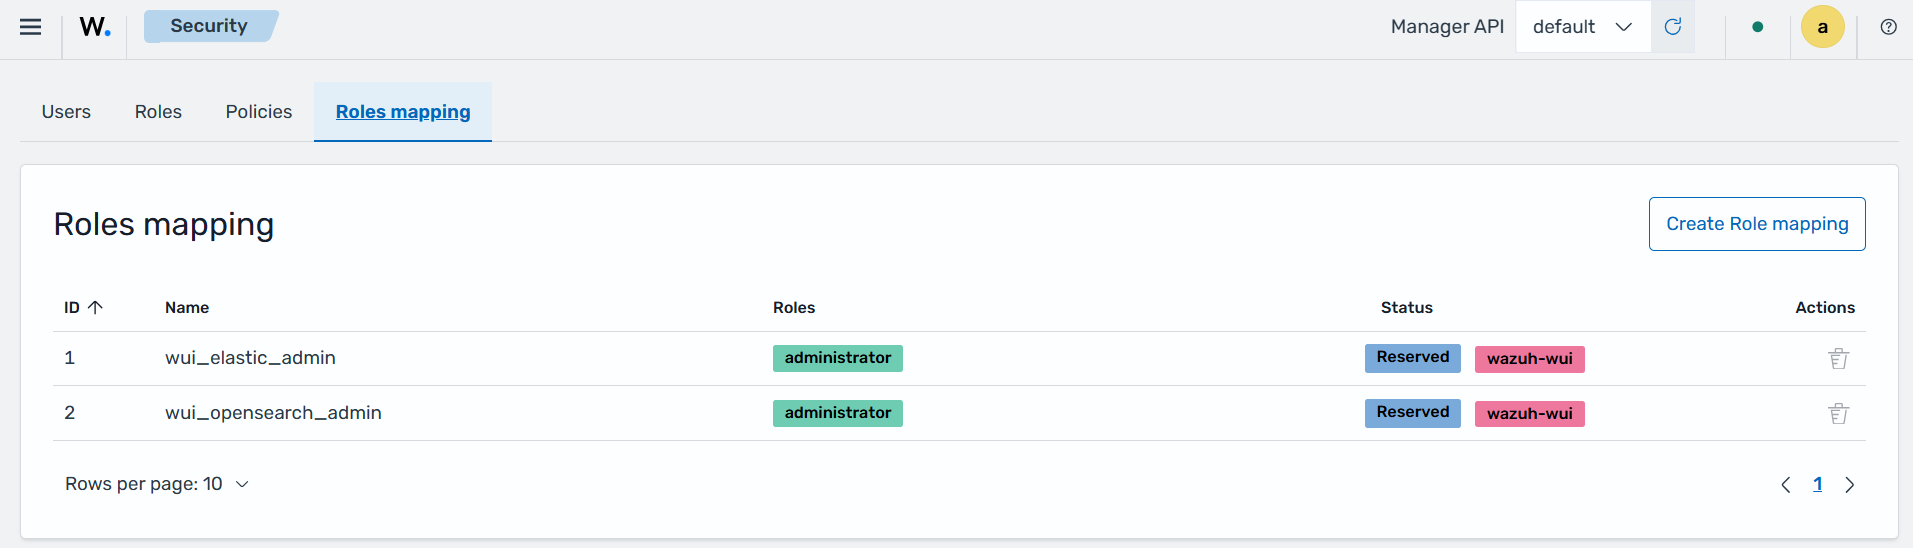
    Security - Roles mapping

    Indexer management

    The Wazuh indexer is a scalable search and analytics engine that stores and indexes events forwarded by the Wazuh manager, enabling near real-time data analysis. It manages threat intelligence updates, including decoders, detection rules, vulnerability feeds, and Indicators of Compromise (IoCs) from the Wazuh Cyber Threat Intelligence (CTI) platform.
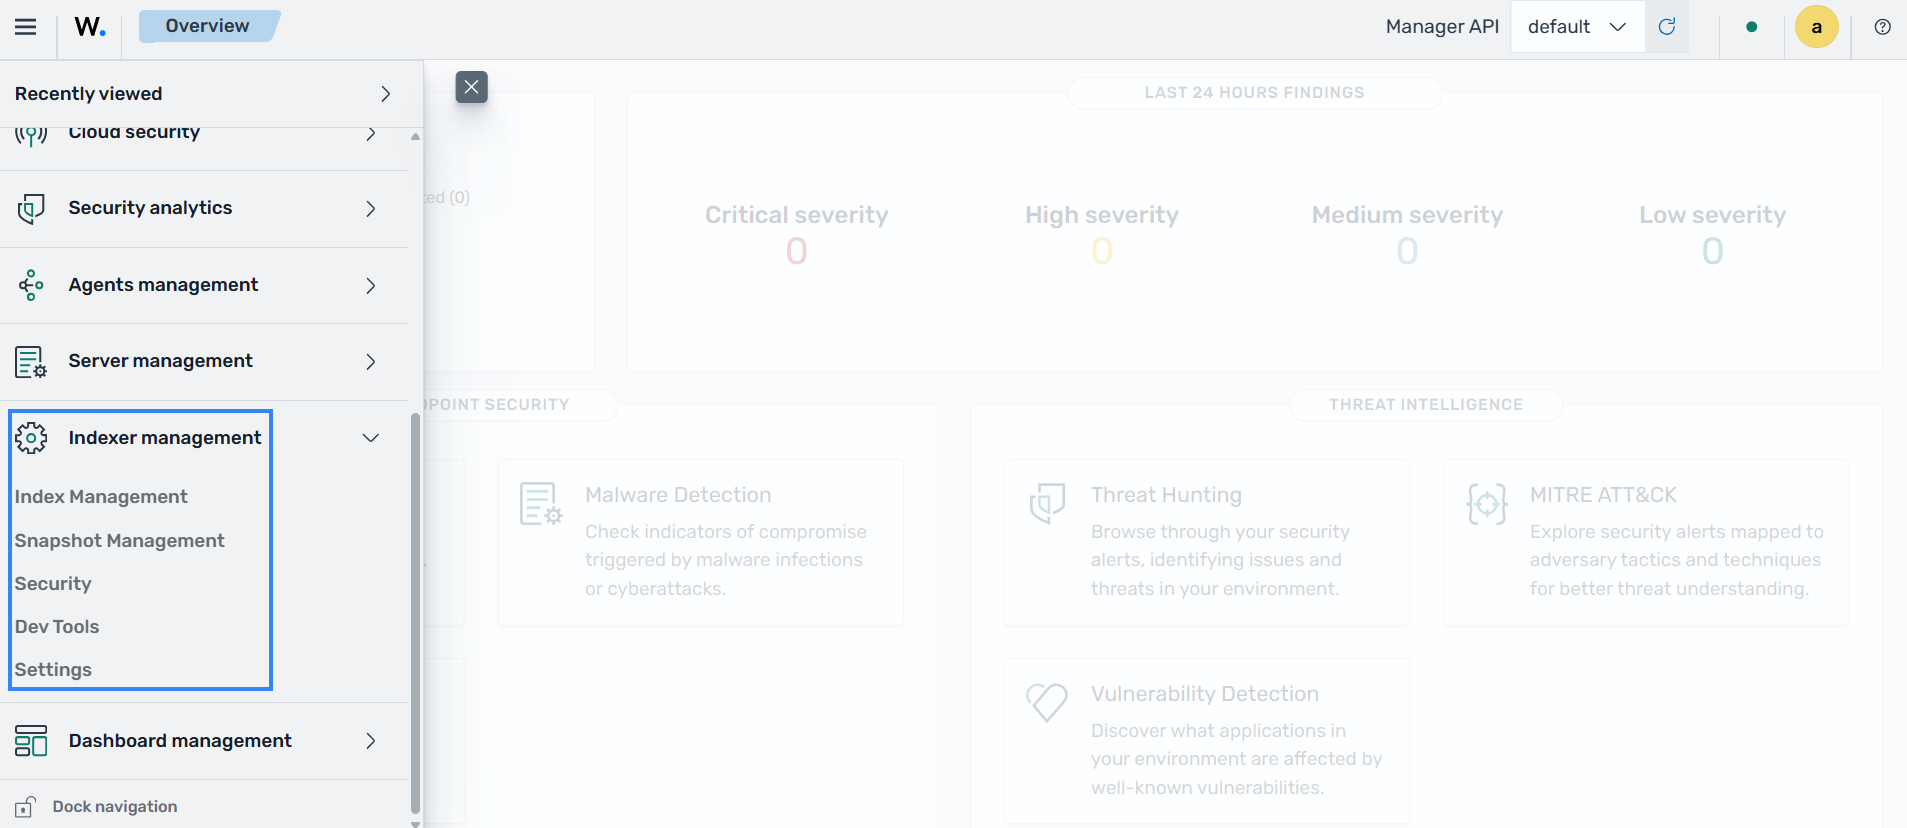
    Indexer management

    Index Management

    The Indexer Management section provides tools for managing the storage, organization, and lifecycle of data in the Wazuh indexer. It allows users to create and manage state management policies, indices, data streams, templates, aliases, rollup jobs, and transform jobs. Please see the Wazuh indexer documentation to find out more.
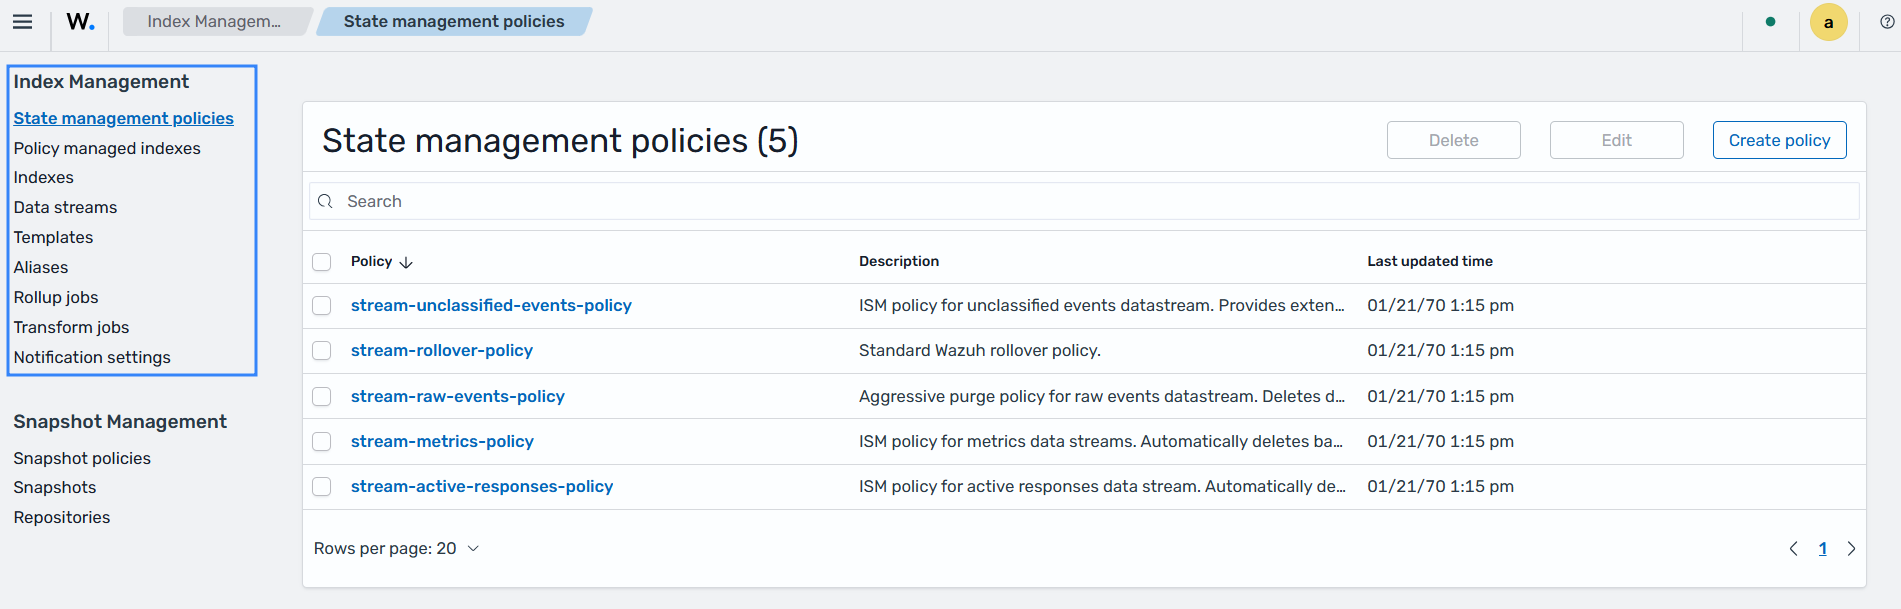
    Index management

    Snapshot Management

    The Snapshot Management section provides tools for creating, storing, and managing backups of data in the Wazuh indexer. It allows users to configure snapshot policies for automated backups, view and manage existing snapshots, and configure snapshot repositories where snapshots are stored.
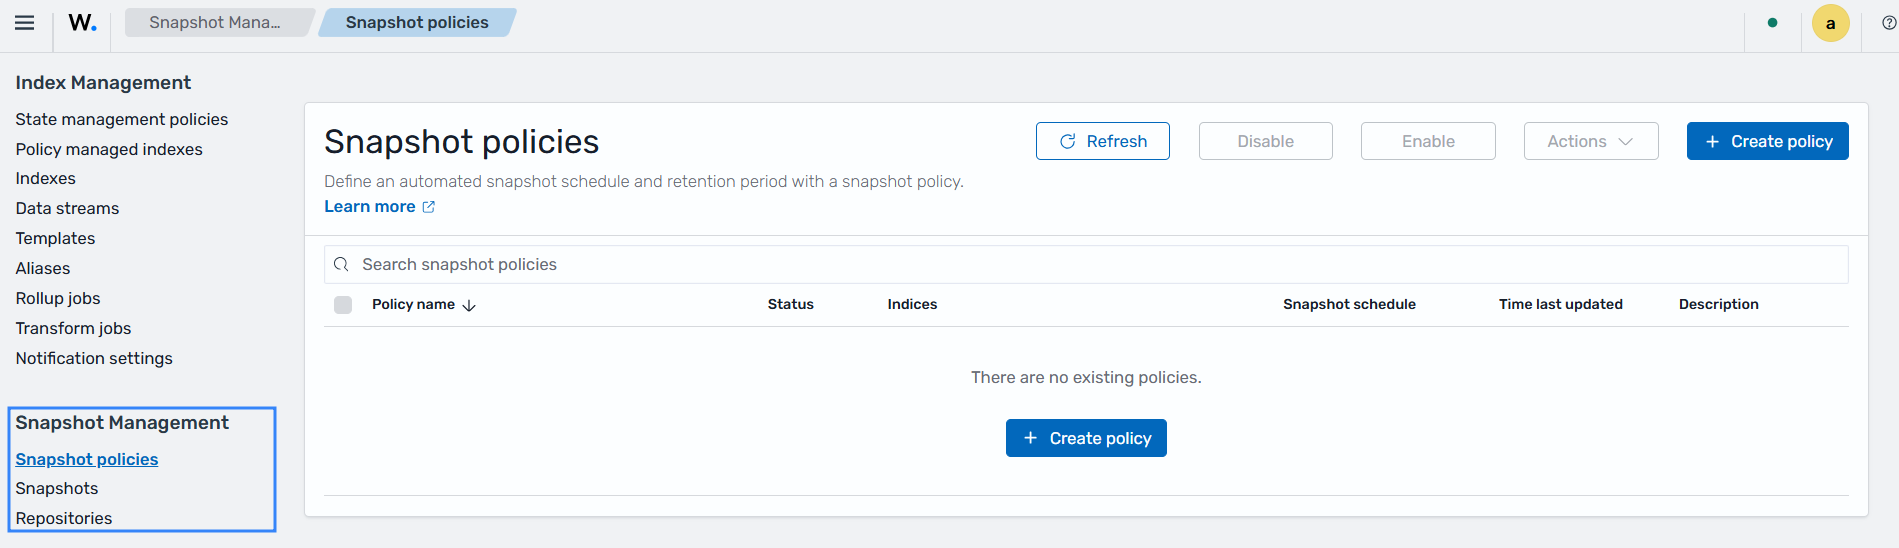
    Snapshot management

    Security (Indexer)

    This section includes the configuration for access to Wazuh resources based on the roles and permissions assigned to the users. Please see the Wazuh RBAC documentation to find out more.
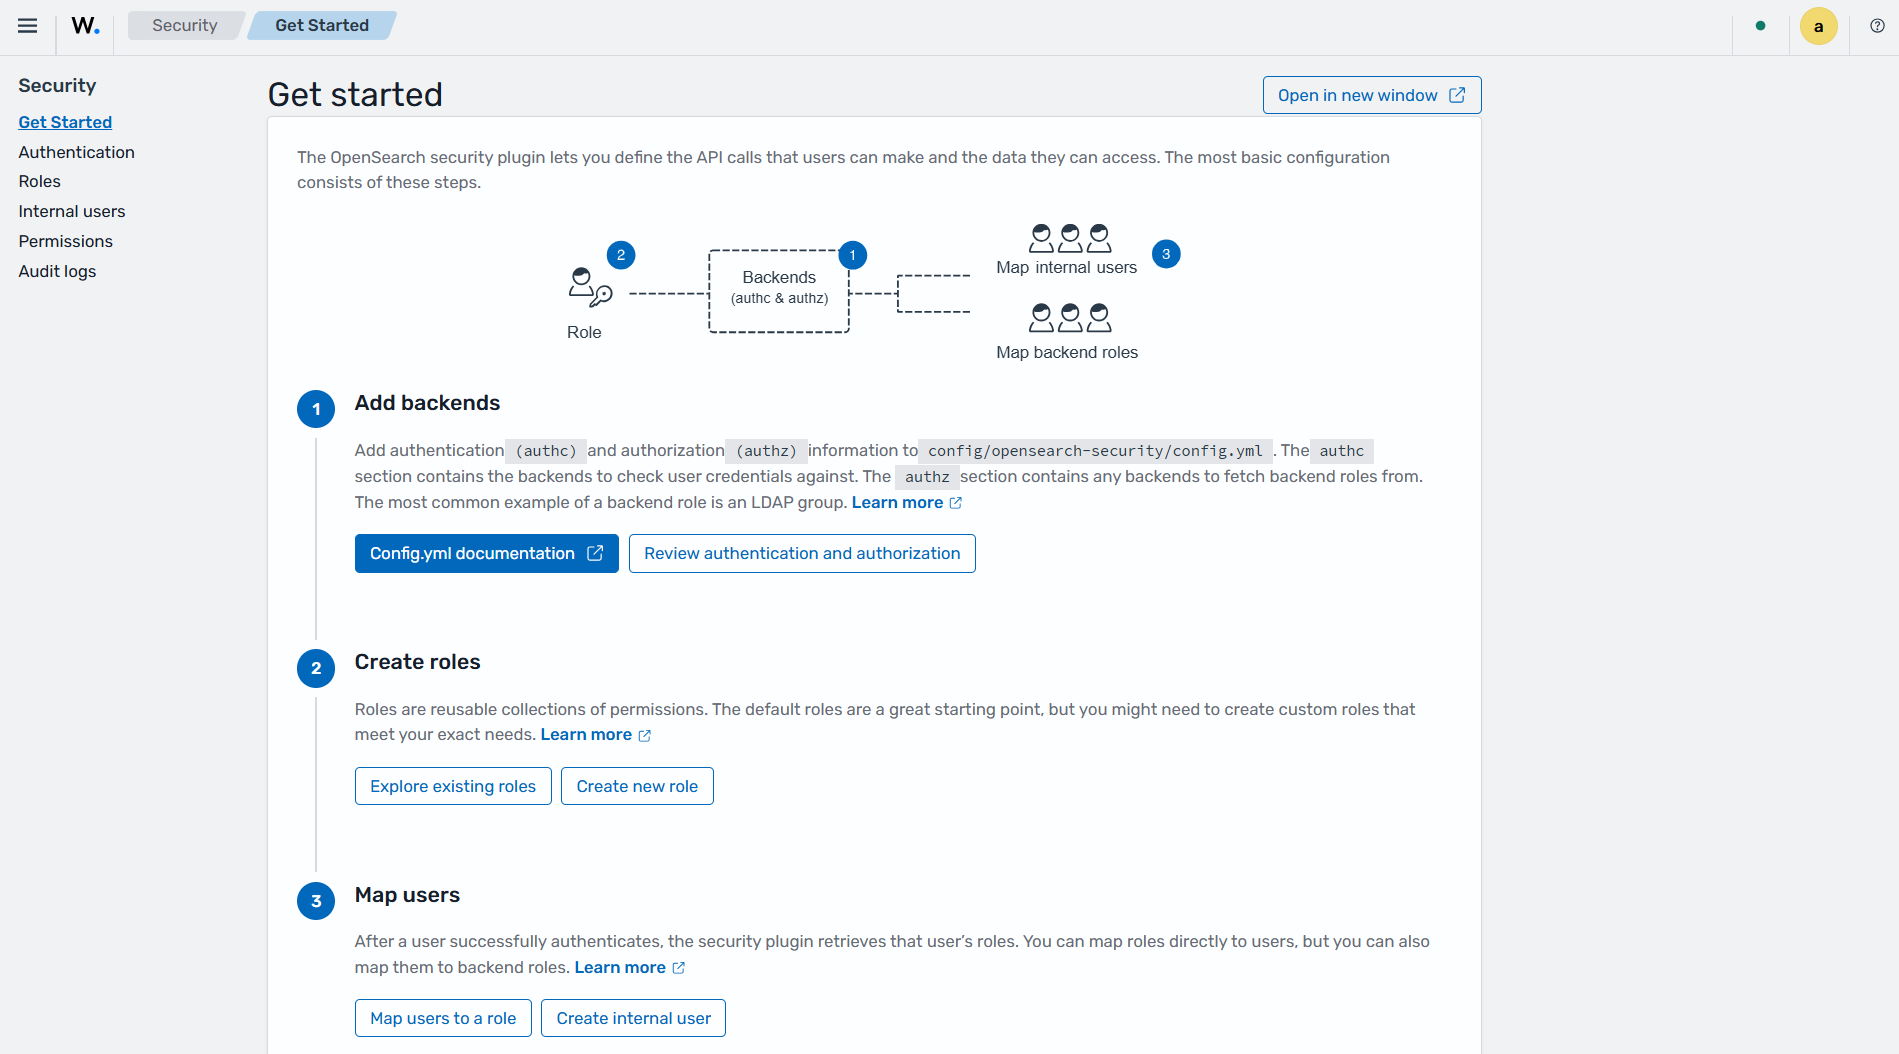
    Security - Indexer

    Dev Tools

    This section allows users to send queries using the Wazuh indexer API. It can be used for indexer operations such as cluster management, querying index data, troubleshooting issues, and debugging errors.
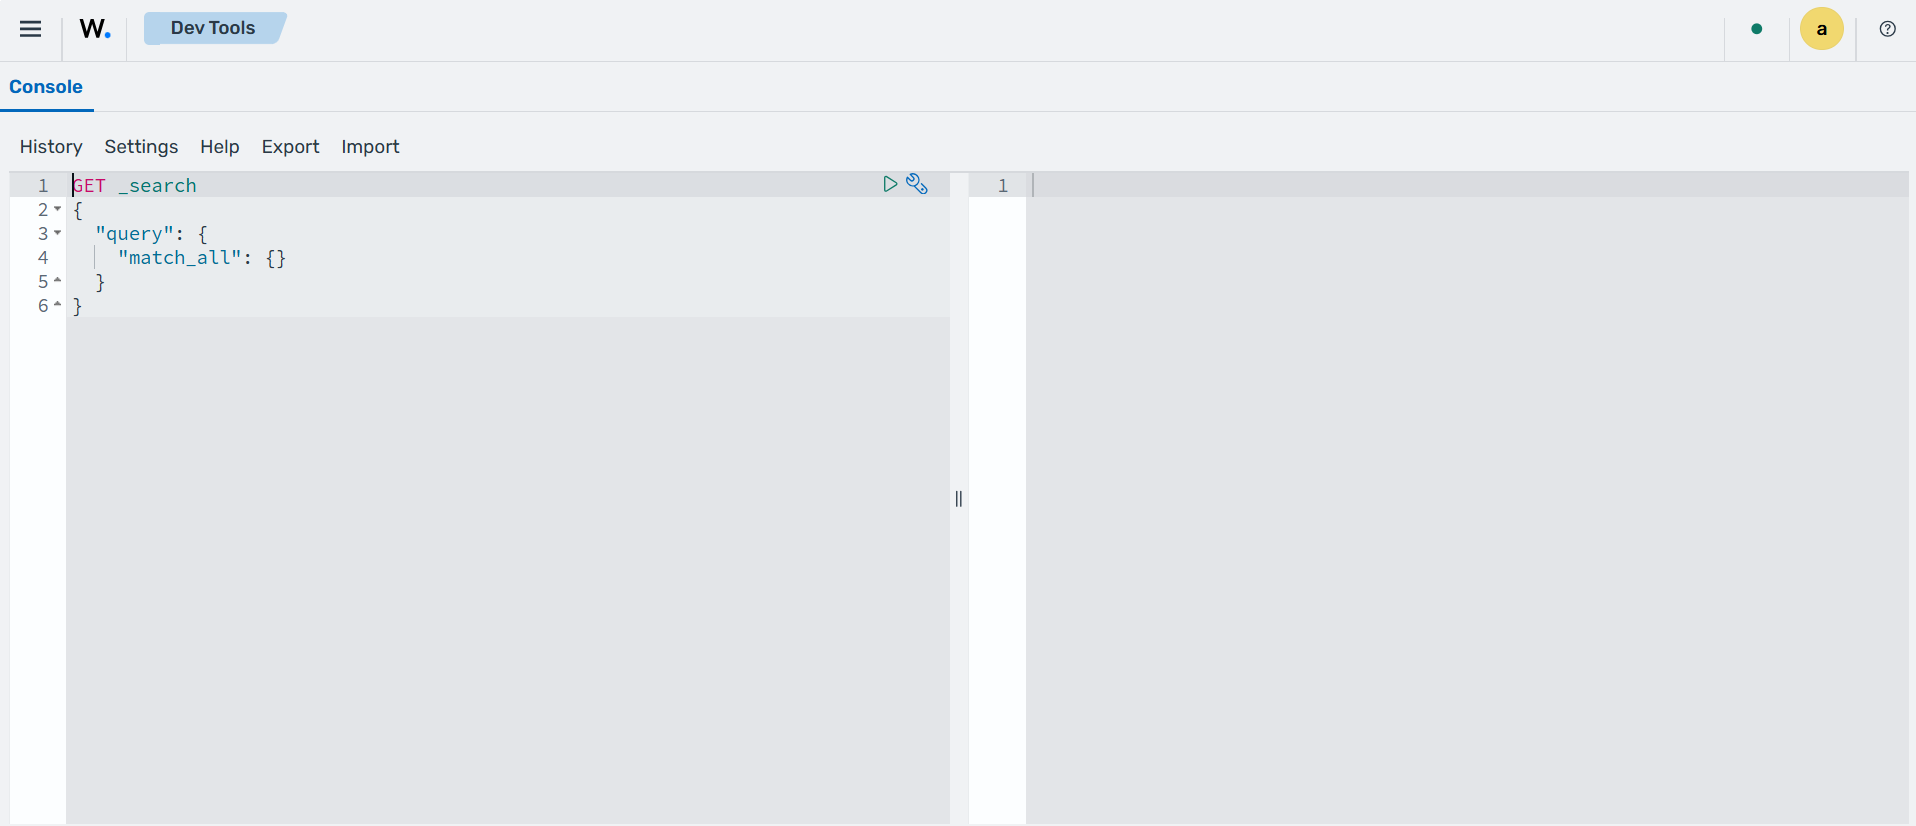
    Dev Tools - Indexer

    Settings

    This section allows you to enable or disable indexing of raw events into the wazuh-events-raw-v5 indices. The wazuh-events-raw-v5\* index stores all events received from the Wazuh manager regardless of whether they trigger an alert. In Wazuh 4.x, similar data was stored in the wazuh-archives-\* indices.

    Settings - Indexer

    Dashboard management

    The Wazuh Dashboard Management section includes the options for creating and managing your index patterns, data sources, saved objects, and advanced settings you can make to your Wazuh dashboard.
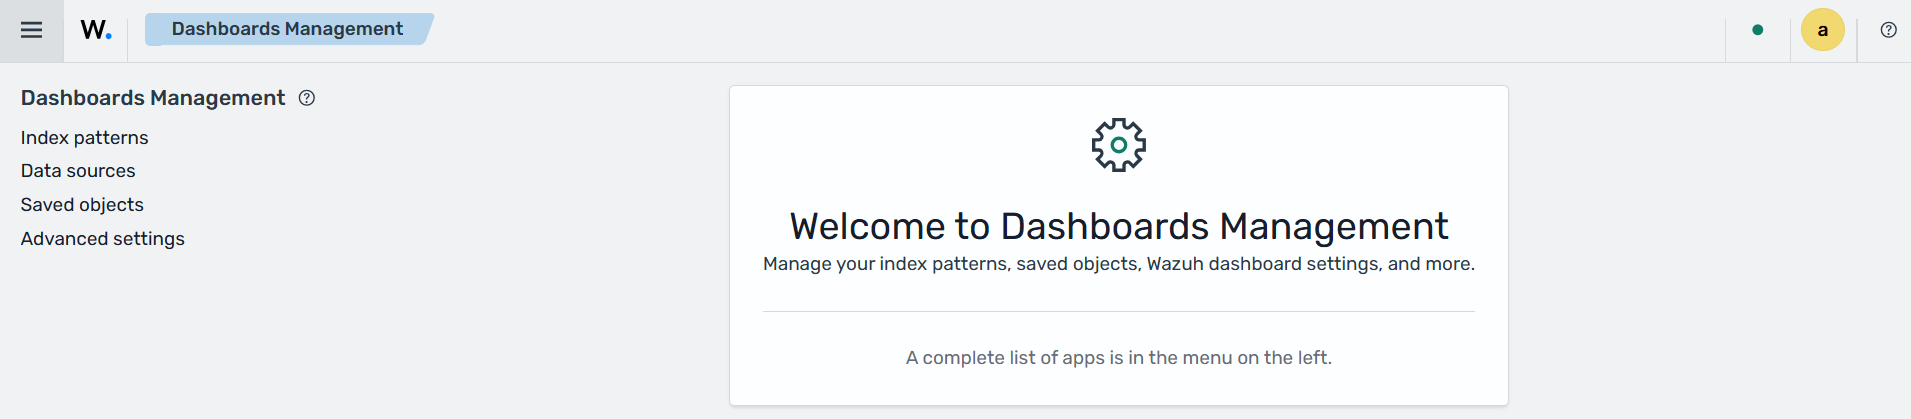
    Dashboard management

    Data sources

    The Data sources section allows you to manage direct query data source connections.
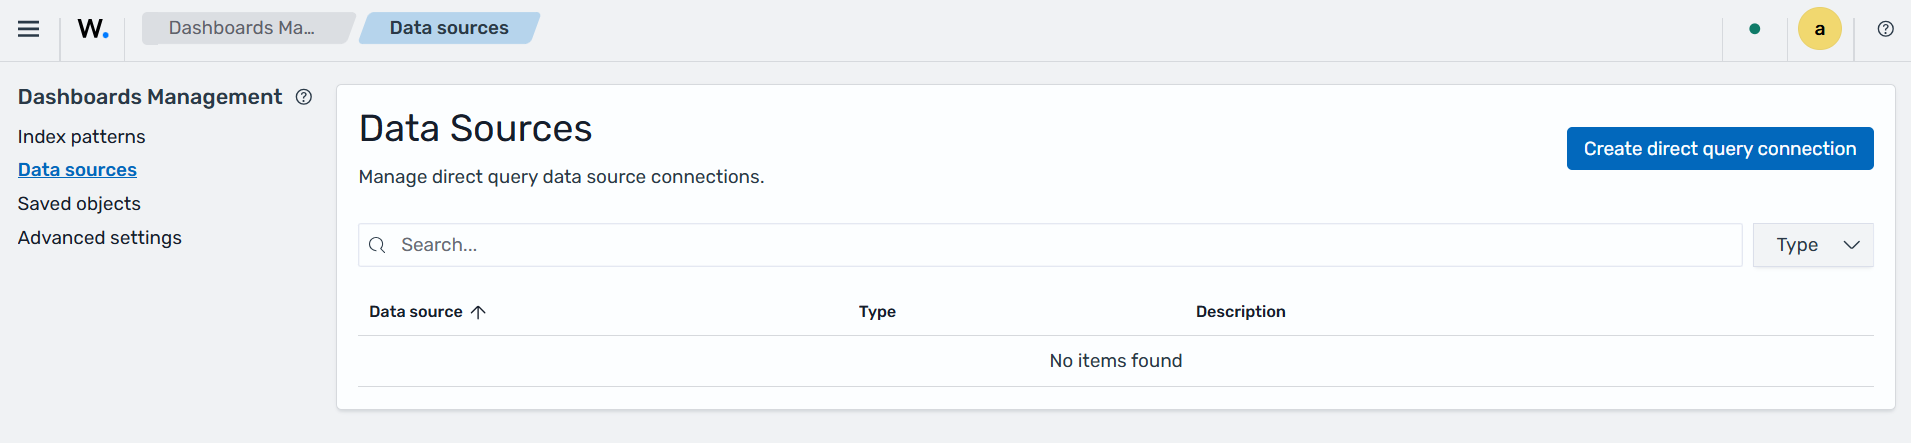
    Data sources

    Saved Objects

    The Saved Objects section allows users to query, import, and export existing saved objects.
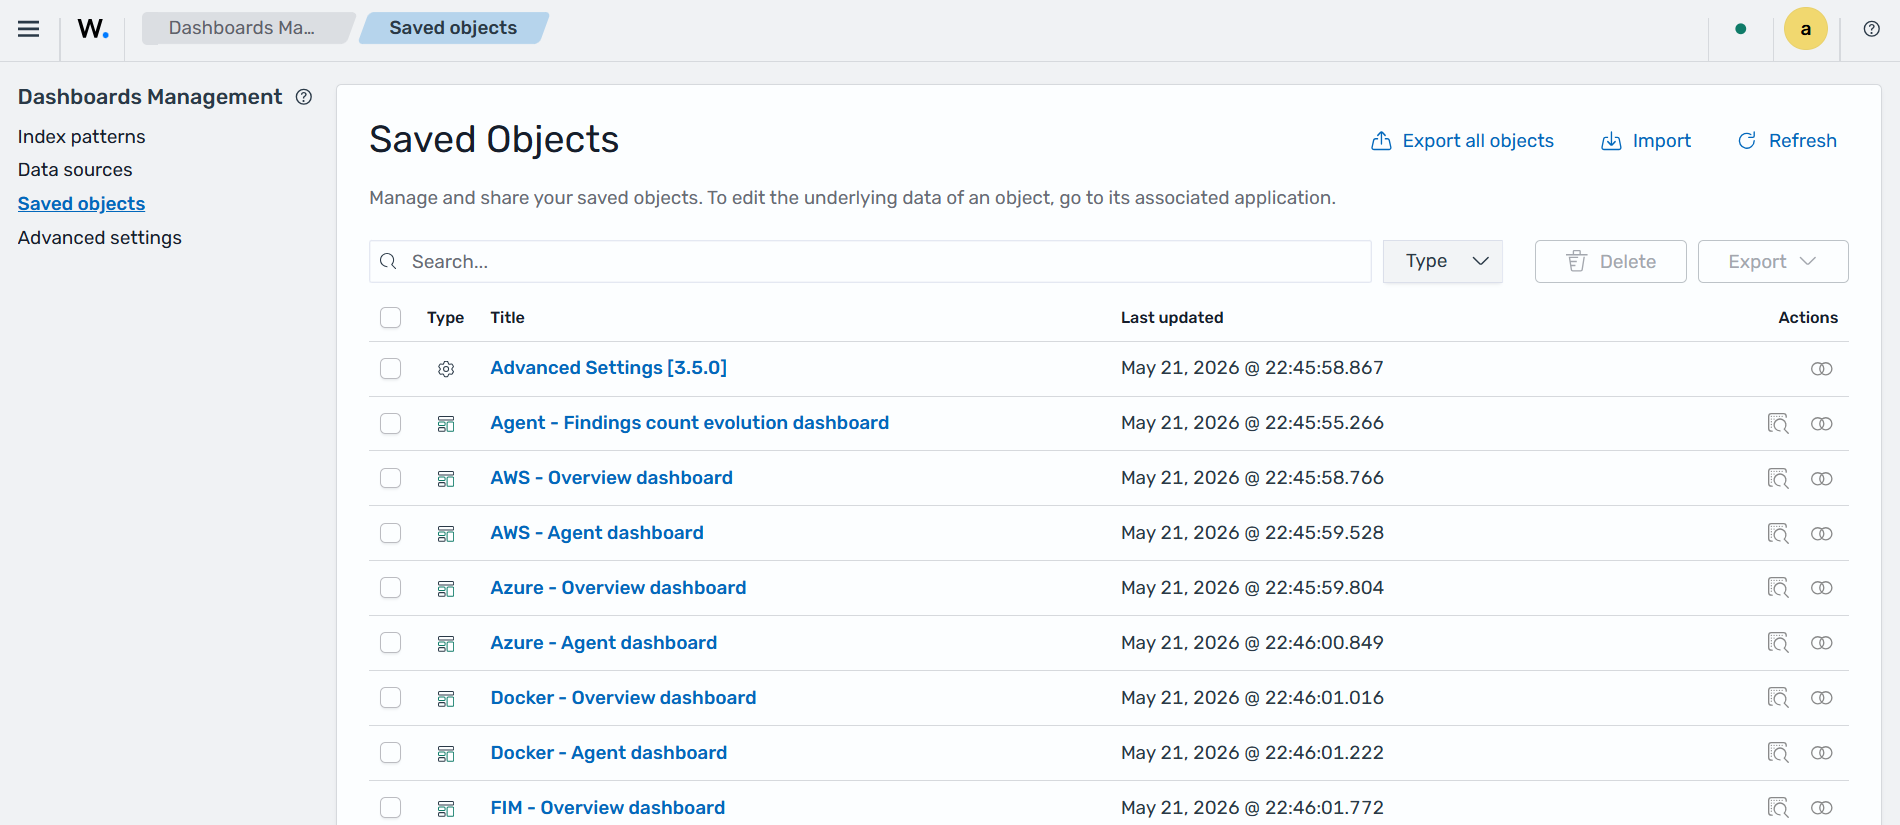
    Saved objects

    Advanced settings

    The Advanced Settings section provides options for customizing the behavior and appearance of the Wazuh dashboard. Users can configure settings related to features such as Detection Insights, Discover, Notifications, Search, Timeline, VisBuilder, Visualization, as well as dashboard appearance and user experience preferences. These settings help tailor the dashboard to specific monitoring, analysis, and operational requirements.
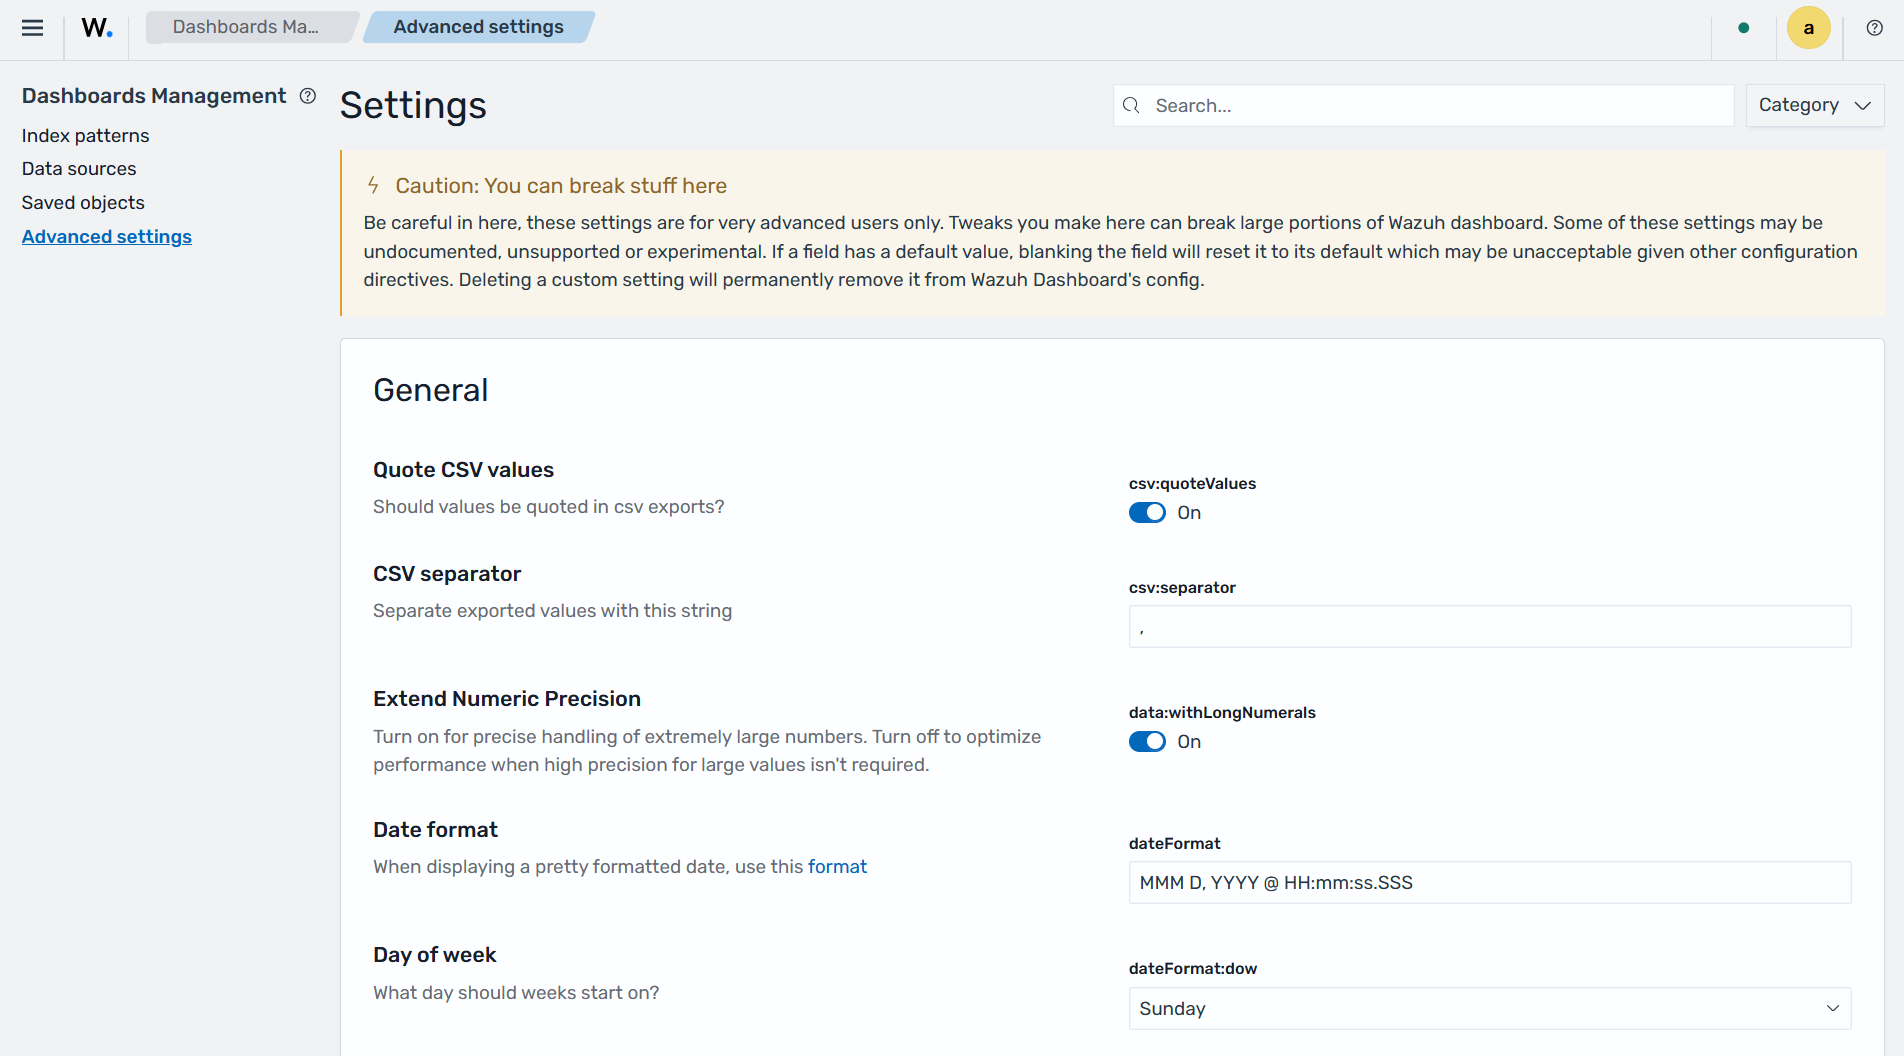
    Advanced settings
    Wazuh dashboard Wazuh dashboard configurations
    On this page
    • Navigating the Wazuh dashboard
      • Dashboards
        • Endpoint security
          • Configuration Assessment
          • Malware detection
          • File integrity monitoring
        • Threat intelligence
          • Threat Hunting
          • Vulnerability detection
          • MITRE ATT&CK
        • Security operations
          • IT Hygiene
          • Regulatory compliance
        • Cloud security
        • Security analytics
          • Integrations
          • Decoders
          • Key-Value Database (KVDB)
          • Detectors
          • Rules
          • Log test
      • Agents management
        • Summary
        • Groups
      • Server management
        • Status
        • Logs
        • Settings
        • Dev Tools
        • Security
      • Indexer management
        • Index Management
        • Snapshot Management
        • Security (Indexer)
        • Dev Tools
        • Settings
      • Dashboard management
        • Data sources
        • Saved Objects
        • Advanced settings
    Explore
    • Overview
    • XDR
    • SIEM
    Services
    • Wazuh Cloud
    • Professional support
    • Consulting services
    • Training courses
    Company
    • About us
    • Customers
    • Partners
    Documentation
    • Quickstart
    • Getting started
    • Installation guide
    Resources
    • Blog
    • Community
    • Legal
    © 2026 Wazuh Inc.
    Contact us
    +1 (844) 349 2984
    • X
    • LinkedIn
    • Reddit
    • GitHub
    • Discord
    • Slack
    • Mailing list
    Navigating the Wazuh dashboard: Dashboards
    Next image
    Navigating the Wazuh dashboard: Dashboards
    Image 1 of 40
    Navigating the Wazuh dashboard: Overview
    Previous image
    Next image
    Navigating the Wazuh dashboard: Overview
    Image 2 of 40
    Configuration Assessment
    Previous image
    Next image
    Configuration Assessment
    Image 3 of 40
    Malware detection
    Previous image
    Next image
    Malware detection
    Image 4 of 40
    File integrity monitoring
    Previous image
    Next image
    File integrity monitoring
    Image 5 of 40
    Threat Hunting
    Previous image
    Next image
    Threat Hunting
    Image 6 of 40
    Vulnerability detection
    Previous image
    Next image
    Vulnerability detection
    Image 7 of 40
    MITRE ATT&CK
    Previous image
    Next image
    MITRE ATT&CK
    Image 8 of 40
    IT Hygiene
    Previous image
    Next image
    IT Hygiene
    Image 9 of 40
    Regulatory compliance
    Previous image
    Next image
    Regulatory compliance
    Image 10 of 40
    Cloud security
    Previous image
    Next image
    Cloud security
    Image 11 of 40
    Security analytics
    Previous image
    Next image
    Security analytics
    Image 12 of 40
    Integrations
    Previous image
    Next image
    Integrations
    Image 13 of 40
    Decoders
    Previous image
    Next image
    Decoders
    Image 14 of 40
    KVDB
    Previous image
    Next image
    KVDB
    Image 15 of 40
    Detectors
    Previous image
    Next image
    Detectors
    Image 16 of 40
    Rules
    Previous image
    Next image
    Rules
    Image 17 of 40
    Log test
    Previous image
    Next image
    Log test
    Image 18 of 40
    Agents management
    Previous image
    Next image
    Agents management
    Image 19 of 40
    Endpoints summary
    Previous image
    Next image
    Endpoints summary
    Image 20 of 40
    Endpoint groups
    Previous image
    Next image
    Endpoint groups
    Image 21 of 40
    Server management
    Previous image
    Next image
    Server management
    Image 22 of 40
    Status
    Previous image
    Next image
    Status
    Image 23 of 40
    Logs
    Previous image
    Next image
    Logs
    Image 24 of 40
    Settings
    Previous image
    Next image
    Settings
    Image 25 of 40
    Dev Tools
    Previous image
    Next image
    Dev Tools
    Image 26 of 40
    Security - Users
    Previous image
    Next image
    Security - Users
    Image 27 of 40
    Security - Roles
    Previous image
    Next image
    Security - Roles
    Image 28 of 40
    Security - Policies
    Previous image
    Next image
    Security - Policies
    Image 29 of 40
    Security - Roles mapping
    Previous image
    Next image
    Security - Roles mapping
    Image 30 of 40
    Indexer management
    Previous image
    Next image
    Indexer management
    Image 31 of 40
    Index management
    Previous image
    Next image
    Index management
    Image 32 of 40
    Snapshot management
    Previous image
    Next image
    Snapshot management
    Image 33 of 40
    Security - Indexer
    Previous image
    Next image
    Security - Indexer
    Image 34 of 40
    Dev Tools - Indexer
    Previous image
    Next image
    Dev Tools - Indexer
    Image 35 of 40
    Settings - Indexer
    Previous image
    Next image
    Settings - Indexer
    Image 36 of 40
    Dashboard management
    Previous image
    Next image
    Dashboard management
    Image 37 of 40
    Data sources
    Previous image
    Next image
    Data sources
    Image 38 of 40
    Saved objects
    Previous image
    Next image
    Saved objects
    Image 39 of 40
    Advanced settings
    Previous image
    Advanced settings
    Image 40 of 40