Monitoring disk space utilization
In this use case, we configure the Command module to check the usage of the root partition on a Linux endpoint every five minutes. Wazuh generates a finding when usage reaches 80%.
Configuration
Linux endpoint
Create a Bash script named
disk-usage.shin the/usr/local/bin/directory. The script prints a warning line only when the root partition usage reaches the threshold of 80%:# tee /usr/local/bin/disk-usage.sh > /dev/null << 'EOF' #!/bin/bash THRESHOLD=80 USAGE=$(df -P / | awk 'NR==2 {gsub("%",""); print $5}') if [ "$USAGE" -ge "$THRESHOLD" ]; then echo "disk-usage: WARNING root partition at ${USAGE}%" fi EOF
Make the
/usr/local/bin/disk-usage.shscript executable:# chmod +x /usr/local/bin/disk-usage.sh
Get the SHA256 hash of the
/usr/local/bin/disk-usage.shscript:# sha256sum /usr/local/bin/disk-usage.sh
Append the configuration below to the Wazuh agent
/var/ossec/etc/ossec.conffile. Replace<SHA256_HASH>with the value from the previous step:<ossec_config> <wodle name="command"> <disabled>no</disabled> <tag>disk-usage</tag> <command>/usr/local/bin/disk-usage.sh</command> <interval>5m</interval> <run_on_start>yes</run_on_start> <timeout>10</timeout> <verify_sha256><SHA256_HASH></verify_sha256> </wodle> </ossec_config>
Where:
The value
/usr/local/bin/disk-usage.shof the<command>option is the script the Command module executes. The script is the first argument, so the checksum verification applies to the script itself.The value
5mof the<interval>option specifies that the script runs every five minutes.The value of the
<verify_sha256>option is the hash the Command module compares against the script before every execution. When the hashes don't match, the module ignores the command.
Restart the Wazuh agent to apply the changes:
# systemctl restart wazuh-agent
Wazuh dashboard
Perform the steps below to create a custom decoder and rule to analyze the event received from the monitored Linux endpoint. If you haven't already done so, perform step 1 of the Wazuh dashboard section under Example configuration.
Navigate to Security Analytics > Normalization > Decoders. Perform the following to create a root and child decoder.
Select the space Draft
Click Actions > Create, select the integration
command-integration, paste the root decoder below in the YAML Editor, and click Create decoder:name: "decoder/core-wazuh-message/0" metadata: author: "Wazuh, Inc." date: "2026-06-10T19:32:11Z" description: "Base decoder to process Wazuh message format, parses location part and enriches the events that comes from a Wazuh agent with the host information." documentation: "" modified: "2026-06-10T19:32:11Z" references: - "https://documentation.wazuh.com/" supports: [] title: "Wazuh message decoder" normalize: - map: - _tmp_json: "parse_json($event.original)" enabled: true
Click Actions > Create, select the integration
command-integration, paste the child decoder below in the YAML Editor, and click Create decoder:--- name: "decoder/wazuh-command-monitoring/0" metadata: author: "Wazuh, Inc." date: "2026-07-12T11:14:25Z" description: "Decoder for Wazuh 5.x wodle command execution events. The command wodle emits a structured JSON payload as event.original. The payload contains process metadata (name, path, command line, args, exit code) and the captured standard output under process.io.text. Legacy plain-text format (4.x) is handled by decoder/wazuh-wodle-legacy/0.\n" documentation: "" modified: "2026-07-12T12:06:23Z" references: - "https://documentation.wazuh.com/current/user-manual/capabilities/command-monitoring/index.html" - "https://github.com/wazuh/wazuh/issues/35634" supports: [] title: "Wazuh Wodle decoder" parents: - "decoder/core-wazuh-message/0" check: "string_equal($_tmp_json.event.module, wazuh-wodle-cmd)" normalize: - map: - data_stream.dataset: "wazuh.wodle" - data_stream.type: "logs" - event.dataset: "wazuh.wodle" - event.kind: "event" - event.category: "array_append_unique(process)" - event.type: "array_append_unique(start)" - event.start: "$_tmp_json.event.start" - process.io.text: "$_tmp_json.process.io.text" - process.name: "$_tmp_json.process.name" - process.command_line: "$_tmp_json.process.command_line" - process.executable: "$_tmp_json.process.path" - process.hash.sha256: "$_tmp_json.process.hash.sha256" - check: "exists($process.hash.sha256)" map: - related.hash: "array_append($process.hash.sha256)" - check: "exists($_tmp_json.process.args)" map: - process.args: "$_tmp_json.process.args" - check: "exists($_tmp_json.tags)" map: - tags: "$_tmp_json.tags" - check: "exists($_tmp_json.tags)" map: - tags: "array_append($_tmp_json.tags)" - check: "$_tmp_json.process.exit_code == 0" map: - event.outcome: "success" - check: "exists($_tmp_json.process.exit_code) AND NOT ($_tmp_json.process.exit_code\ \ == 0)" map: - event.outcome: "failure" - check: "NOT exists($_tmp_json.process.exit_code)" map: - event.outcome: "unknown" - map: - _tmp_json: "delete()" enabled: true id: "a026d62c-b58b-4a8c-8945-dfd858c6b2e0"
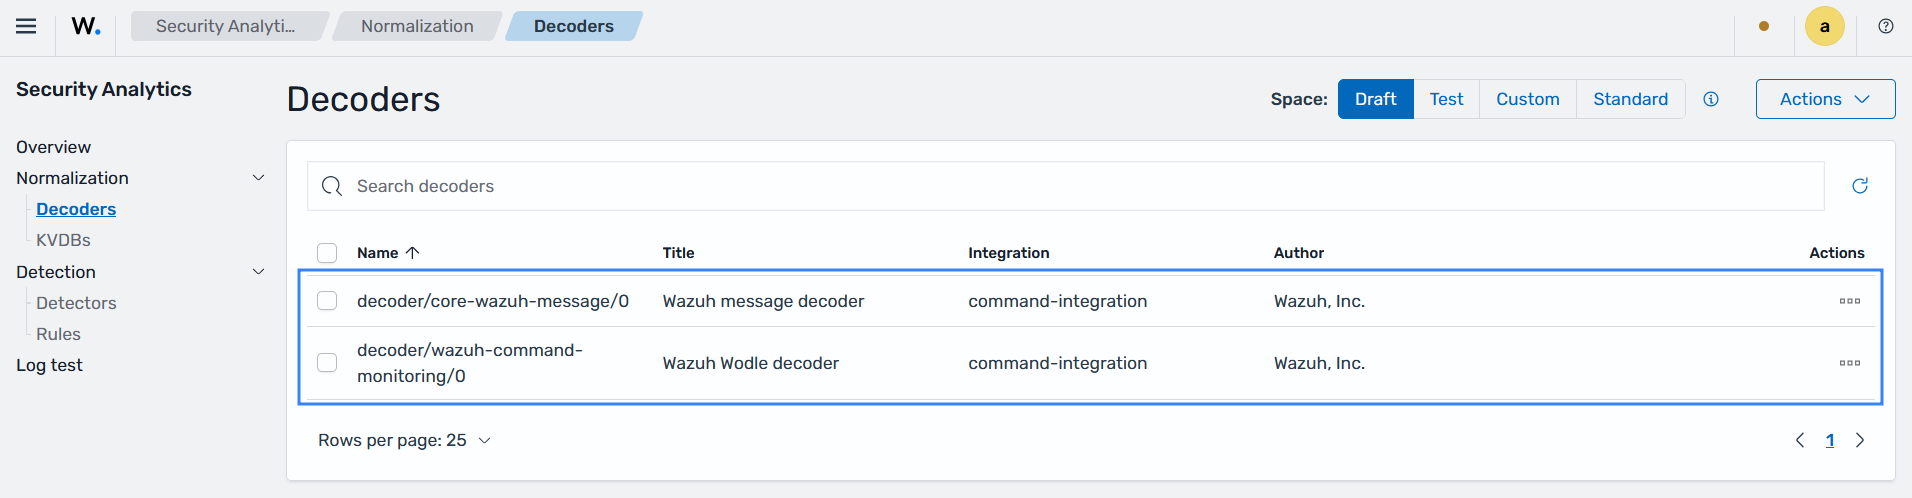
Navigate to Security Analytics > Overview and perform the following to attach the root decoder to the integration:
Click Actions > Edit
Confirm the status is Enabled
Select
decoder/core-wazuh-message/0under Root Decoder and click Save.
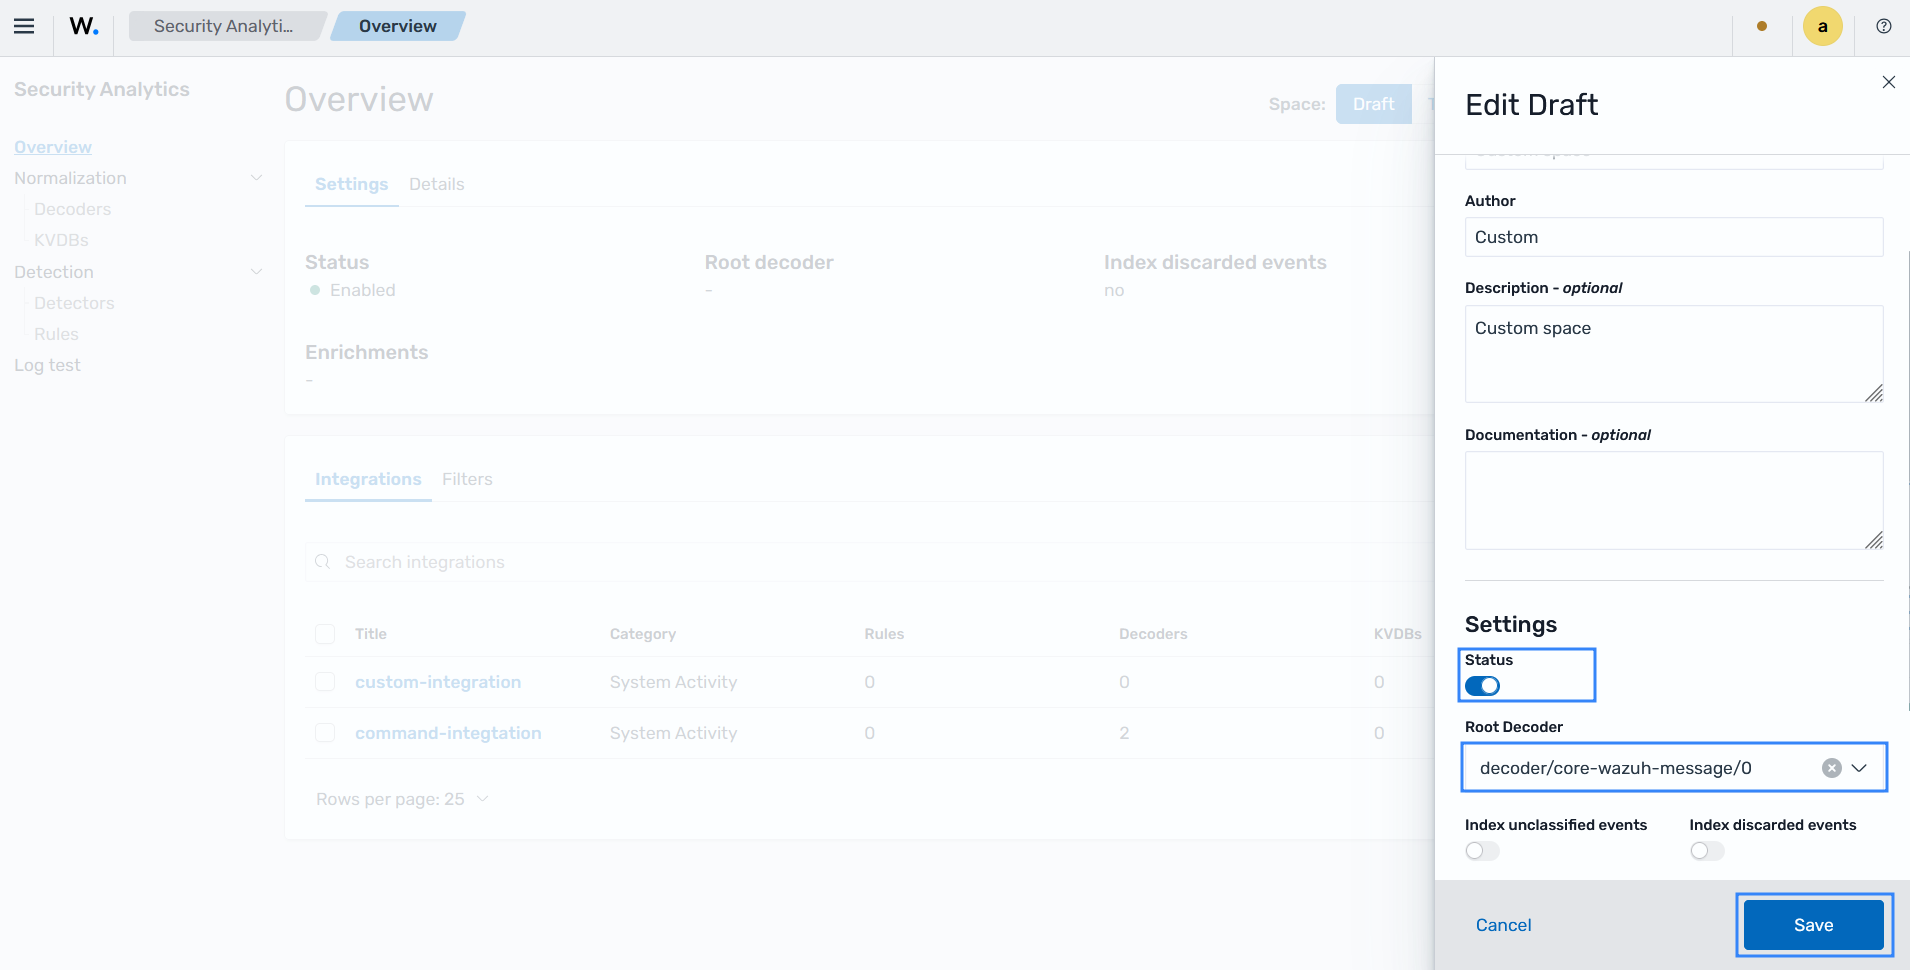
Navigate to Security Analytics > Detection > Rules and perform the following to create a detection rule.
Select the space Draft
Click Actions > Create, select the YAML Editor, choose the integration
command-integration, paste the detection rule shown below, and click Create rule:id: 4d5d86bb-6b00-4ded-81d2-f06becaff812 logsource: product: command-integration tags: [] falsepositives: [] level: critical status: experimental enabled: true detection: condition: Selection_1 and Selection_2 Selection_2: process.io.text|contains: - 'disk-usage: WARNING' Selection_1: tags|re: - disk-usage metadata: title: Wazuh CM - Disk usage of the root partition exceeds 80% author: Security team lead description: Detects when the disk usage of the root partition reaches 80% references: - '' documentation: '' supports: - '' modified: '2026-07-15T17:47:25Z' compliance: pci_dss: - 10.6.1 hipaa: - 164.312.b nist_800_53: - AU.6
Navigate to Security Analytics > Overview, select the space Draft and click Actions > Promote to promote the decoders and rule to the
Testspace.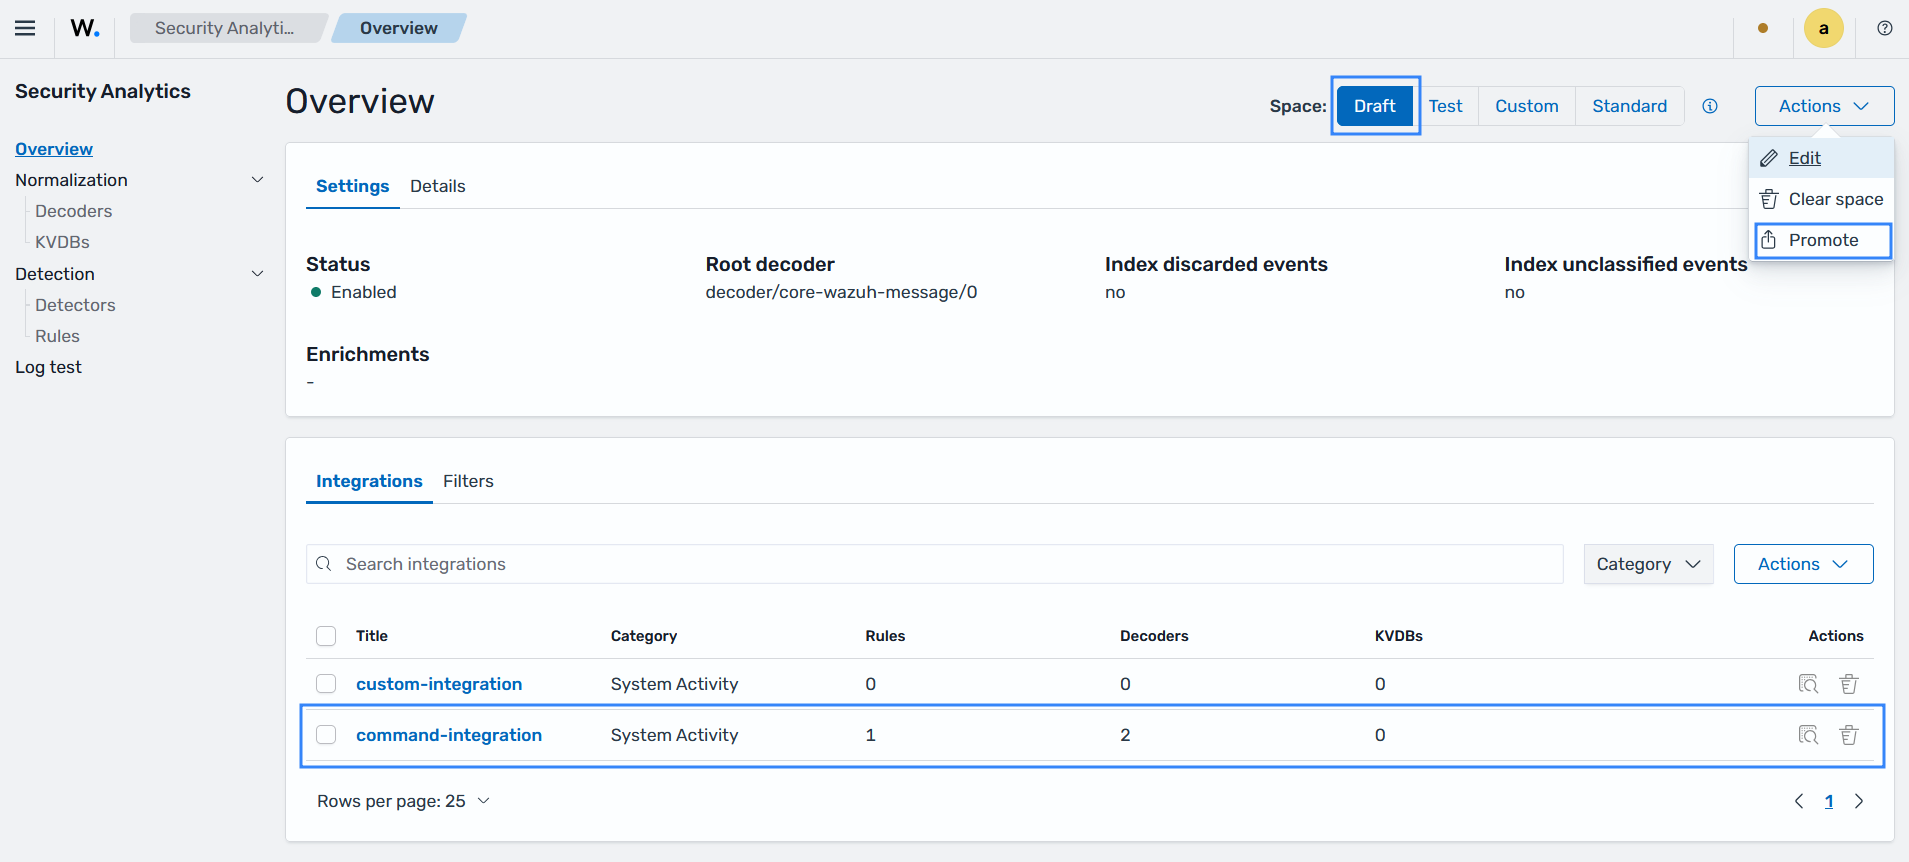
Navigate to Security Analytics > Overview, select the space Test and click Actions > Promote to promote the decoders and rule to the
Customspace.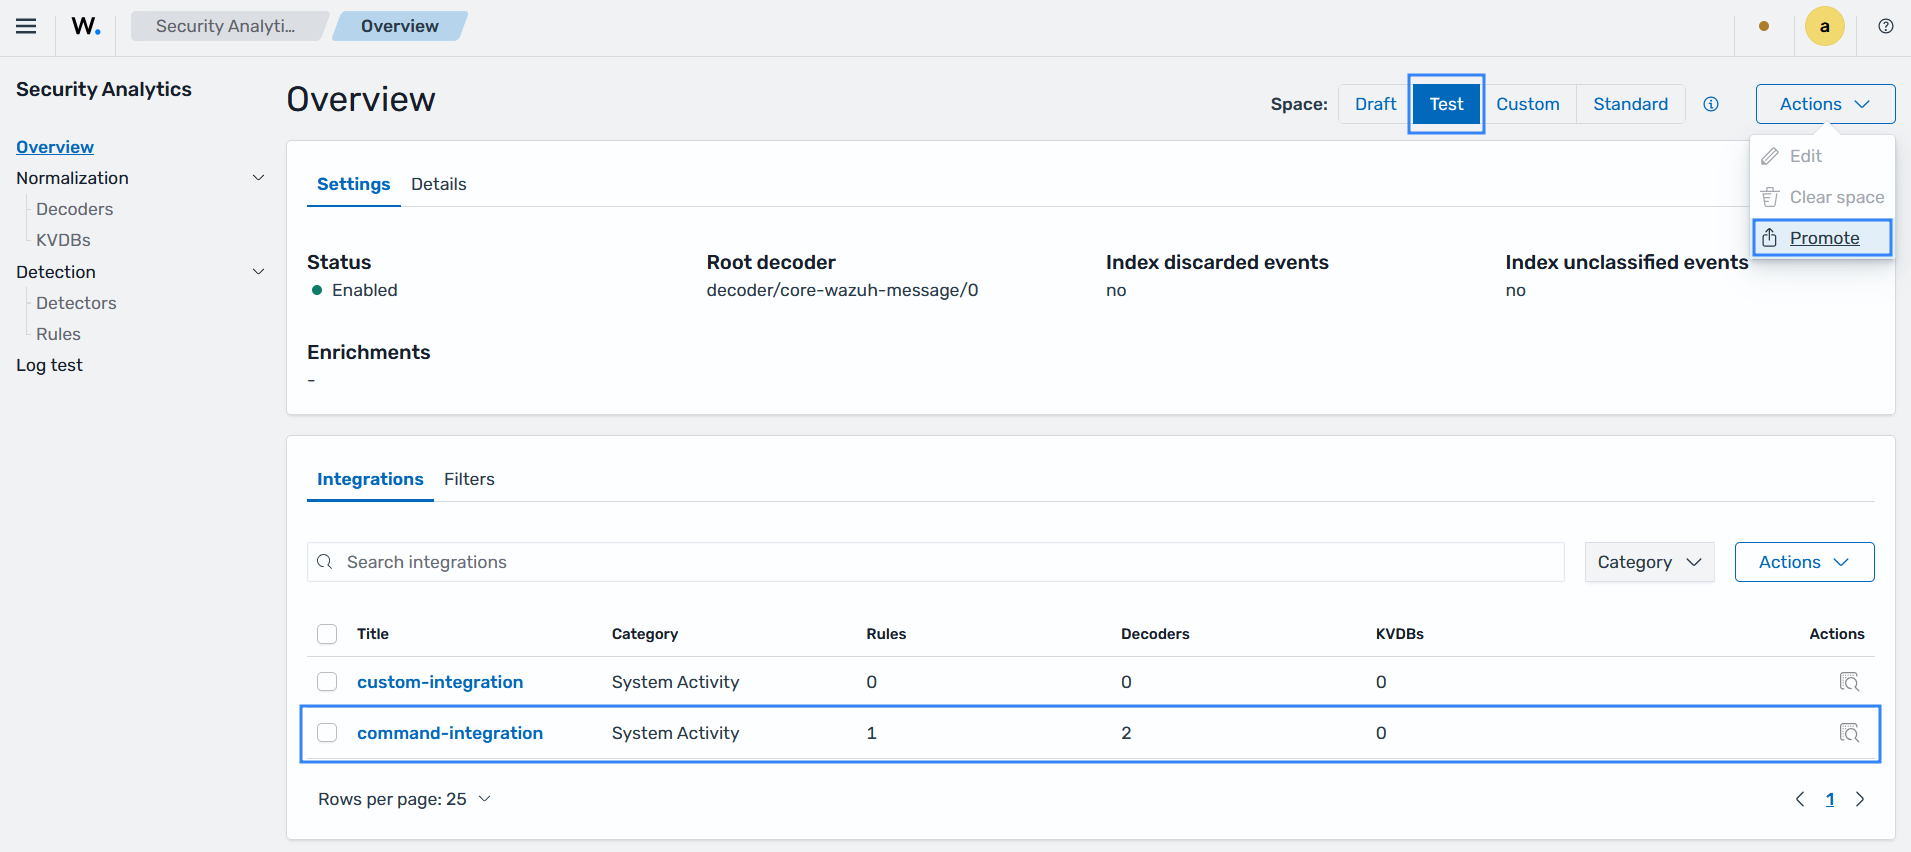
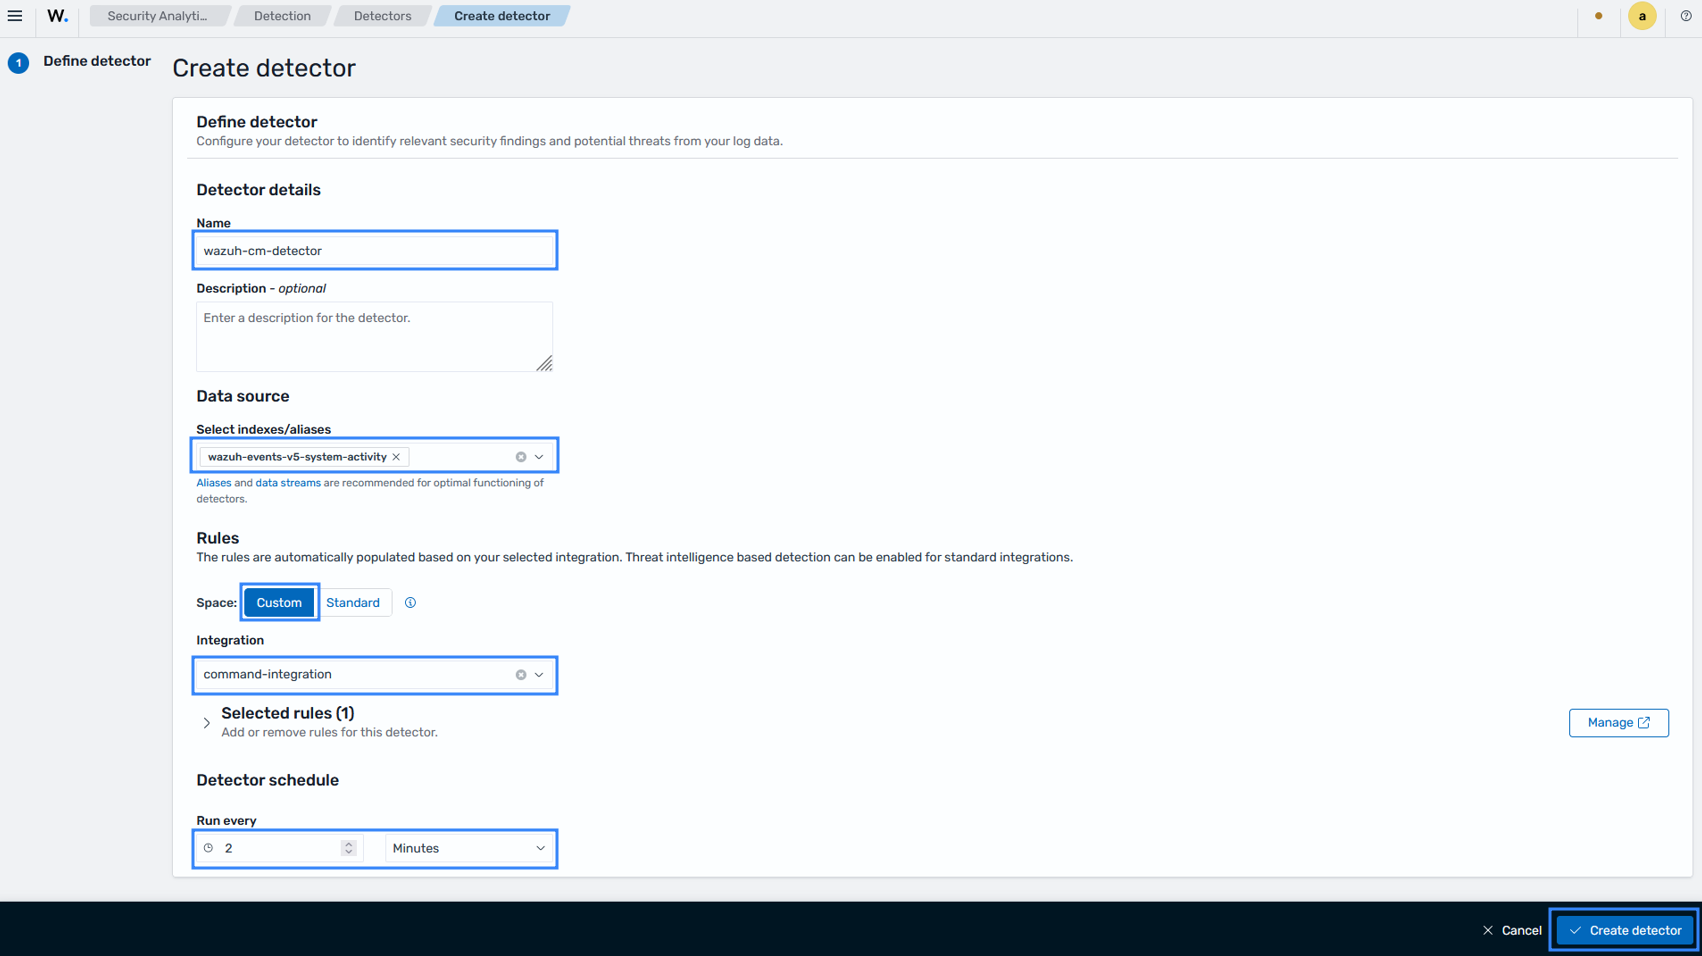
Navigate to Security Analytics > Detection > Detectors to create a detector that applies the detection rule and generates findings.
Click Create detector, fill the required fields, and click Create detector:
Name: wazuh-cm-detector
Select indexes/aliases: wazuh-events-v5-system-activity (this must match the integration category you configured earlier,
System Activity)Space: Custom
Integration: command-integration
Run every: 2 minutes.
Test the configuration
Perform the steps below on the monitored Ubuntu endpoint.
Check the size of the root partition:
# df -P
The command output looks similar to this:
Filesystem                        1024-blocks      Used Available Capacity Mounted on
tmpfs                                  201500      1012    200488       1% /run
/dev/mapper/ubuntu--vg-ubuntu--lv    31811408   4745136  25424800      16% /
tmpfs                                 1007484         0   1007484       0% /dev/shm
tmpfs                                    5120         0      5120       0% /run/lock
/dev/sda2                             1992552    104804   1766508       6% /boot
vagrant                             732556284 244033372 488522912      34% /vagrant
tmpfs                                  201496        16    201480       1% /run/user/1000
Fill the disk to cross the threshold with the command below:
# fallocate -l 20G /tmp/big_file
Verify the size of the root partition has increased above the threshold:
# df -P
The command output looks similar to this:
Filesystem                        1024-blocks      Used Available Capacity Mounted on
tmpfs                                  201500      1012    200488       1% /run
/dev/mapper/ubuntu--vg-ubuntu--lv    31811408  25717728   4452208      86% /
tmpfs                                 1007484         0   1007484       0% /dev/shm
tmpfs                                    5120         0      5120       0% /run/lock
/dev/sda2                             1992552    104804   1766508       6% /boot
vagrant                             732556284 244031132 488525152      34% /vagrant
tmpfs                                  201496        16    201480       1% /run/user/1000
Visualize the findings
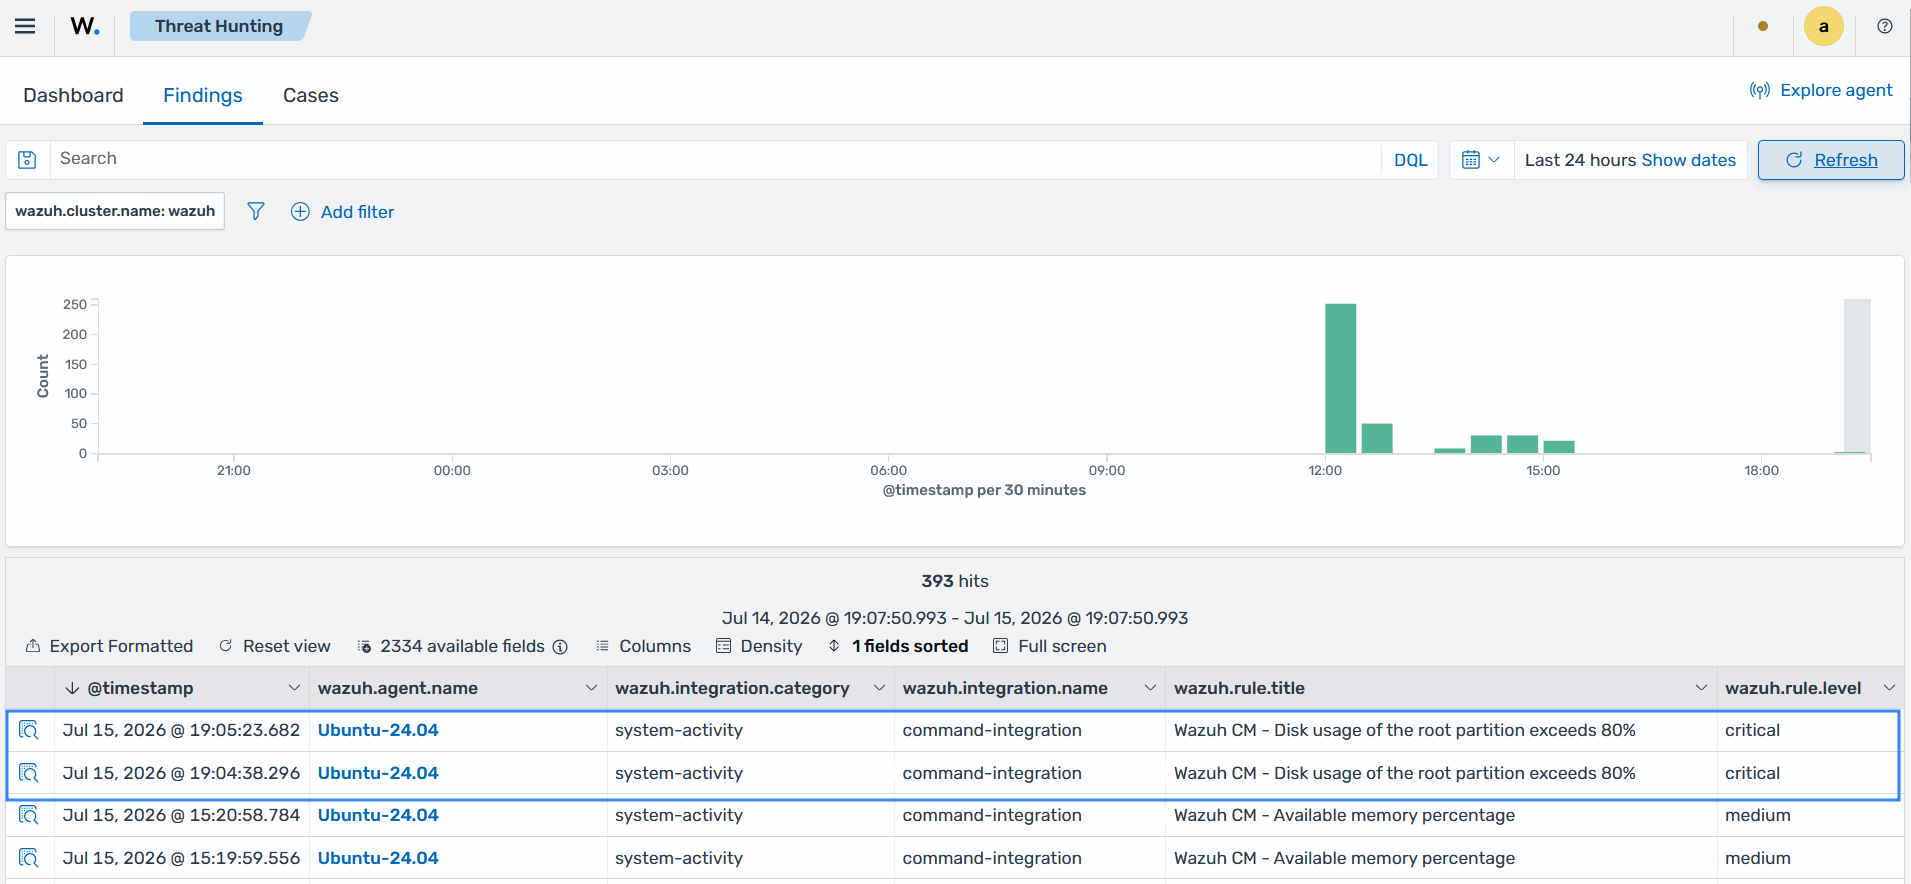
Navigate to Threat Intelligence > Threat Hunting > Findings on the Wazuh dashboard to view the generated finding when the disk usage of the / partition exceeds 80%.
After visualizing the findings, remove the /tmp/big_file file on the monitored endpoint to regain your disk space:
# rm /tmp/big_file