Wazuh manager architecture
The Wazuh manager comprises two main components:
The Wazuh normalization engine (
wazuh-manager-analysisddaemon) is the core component responsible for decoding events and enriching them with threat intelligence. It replaces the legacyanalysisdmodule.The Wazuh indexer connector is a client library that forwards the transformed data, inventory data, and vulnerability scans to the Wazuh indexer and other configured destinations.
The Wazuh manager also includes multiple specialized daemons that run as independent processes. These daemons communicate and work together to provide a scalable and efficient event processing platform.
Core operations
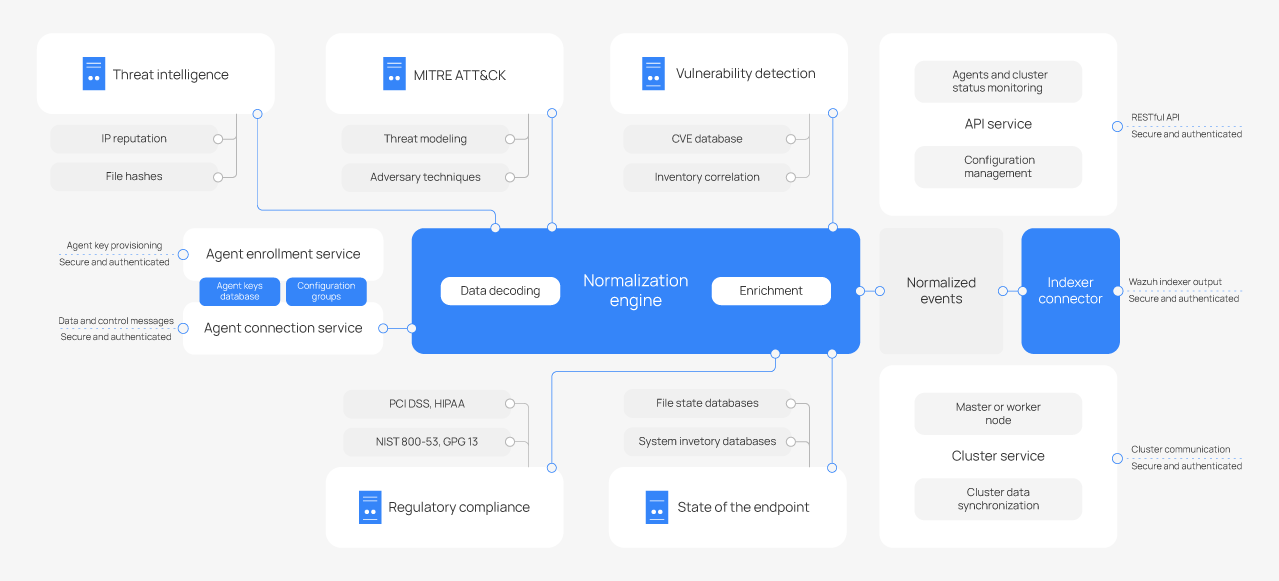
The diagram below shows the primary services and data flows within the Wazuh manager. The workflows that follow describe how security data moves through the Wazuh manager and its associated services.
Security operations
Wazuh agent registration: Wazuh agents enroll with the Wazuh manager by sending an HTTPS request to the
POST /enrollendpoint on port1517. The enrollment service validates the request, generates a unique key for the Wazuh agent, and saves the agent record in the Wazuh database. The Wazuh manager returns the key to the Wazuh agent, which uses it to sign the bearer tokens that authenticate all subsequent requests. Wazuh 4.x agents enroll through the legacy TLS service on port1515.Event processing: The Wazuh agent sends security events, such as logs and Security Configuration Assessment (SCA) scan results, through the
POST /statelessendpoint on HTTPS port1517. The Wazuh agent authenticates each request with its bearer token. Each event batch includes the agent metadata, so the Wazuh manager forwards it unchanged to the Wazuh normalization engine. The engine processes the events according to the configured security policies and stores the processed results in the Wazuh indexer via the indexer connector. The engine also pulls rulesets and configurations from the Wazuh indexer when needed. Wazuh 4.x agents send events over the AES-encrypted TCP/UDP channel on port1514when the<legacy>option of the<remote>section is enabled. On this channel, the Wazuh manager decrypts the events and adds information about the agent before processing.Inventory and vulnerability scanning: The Wazuh agent sends system inventory data, such as installed packages and operating system details, through the
POST /statefulendpoint on HTTPS port1517. The Wazuh agent authenticates each request with its bearer token. The Wazuh manager validates the synchronization and updates the inventory in the Wazuh indexer via the indexer connector. During vulnerability detection scans, the Wazuh manager queries CVE feeds from the Wazuh indexer and matches them against the software packages installed on the monitored endpoint. It then sends vulnerability events to the Wazuh normalization engine and the vulnerability state to the Wazuh indexer.Active response: The Wazuh normalization engine produces events and sends them to the Wazuh indexer via the indexer connector. Internal processes of the Wazuh indexer evaluate these events against its own rules and generate active response findings. The Wazuh manager periodically polls these findings and creates an active response task for each targeted Wazuh agent. The task remains queued until the Wazuh agent requests pending work through the
POST /controlendpoint. The Wazuh agent retrieves the task in the response and executes the corresponding response script, such as blocking an IP address or stopping a malicious process. Active response is not available for Wazuh 4.x agents.
Management operations
Wazuh agent upgrade: A user sends an upgrade request via the Wazuh manager API. The Wazuh manager sends the upgrade package to the Wazuh agent. When the upgrade is complete, the Wazuh agent reports its status back to the Wazuh manager, which records the progress.
API queries: Users or applications send an
HTTPSrequest to the Wazuh manager API. The manager API retrieves information or performs actions by communicating with the appropriate Wazuh manager component including the Wazuh normalization engine, Wazuh DB, and others. In a cluster, requests are automatically routed to the correct Wazuh manager node.Wazuh manager restart and reload: A user sends a restart or reload request through the Wazuh manager API, which signals the appropriate daemons to restart or reload the required services.
Wazuh agent deletion: The Wazuh manager tracks the connection status of Wazuh agents in the Wazuh database. Wazuh agents report their status through periodic keep-alive messages. The Task Manager, which runs within
wazuh-manager-modulesd, handles recurring maintenance jobs through its schedules. A recurring task marks a Wazuh agent as disconnected when it stops reporting for the period the<agents_disconnection_time>option defines (15 minutes by default). Another recurring task rotates the Wazuh manager logs daily. When enabled, a third task removes Wazuh agents that remain disconnected beyond a retention period.
Cluster and state management
Cluster synchronization: In a cluster deployment, the Wazuh manager securely synchronizes Wazuh agent registration and shared configuration data between Wazuh manager master and worker nodes. It reads and writes Wazuh agent state and connects to the Wazuh indexer for active response dispatch, agent sync, and metrics. The Wazuh manager API forwards cluster queries to Clusterd.
Wazuh agent monitoring: The Wazuh manager tracks the connection status of Wazuh agents in the Wazuh database. Wazuh agents report their status through periodic keep-alive messages. A recurring task marks a Wazuh agent as disconnected when it stops reporting for a configurable period (15 minutes by default). Other recurring tasks rotate the Wazuh manager logs and, when enabled, remove Wazuh agents that remain disconnected beyond a retention period.
Data sources
Wazuh collects security events and telemetry from multiple sources. These data sources provide the information used for threat detection, vulnerability detection, compliance monitoring, and incident response. Common data sources supported by Wazuh include:
Operating system logs: Wazuh collects logs generated by several operating systems, like Windows, Linux, and macOS. It can collect a variety of logs from Linux endpoints, including syslog, auditd, application logs, and others. On Windows endpoints, Wazuh collects Windows event logs from System, Applications, and Security event channels by default. Wazuh collects logs on macOS endpoints by using the macOS unified logging system (ULS). The macOS ULS centralizes the management and storage of logs across all system levels.
Syslog events: Wazuh collects logs from a variety of Syslog-enabled devices, including firewalls, routers, switches, applications, and operating systems.
Cloud provider logs: Wazuh monitors cloud infrastructures by collecting logs and events directly from cloud service providers like AWS, Azure, Google Cloud, and Office 365. These include logs from cloud services such as EC2 instances, S3 buckets, Azure VMs, and more.