Wazuh dashboard
The Wazuh dashboard is the web interface for viewing and managing Wazuh security data. It queries the Wazuh indexer to show events, findings, and security analytics, and it calls the Wazuh manager API to manage your deployment.
You can use the Wazuh dashboard to perform the following tasks:
Investigate findings and events across Wazuh capabilities
Manage decoders, rules, and key-value databases (KVDBs), and test logs against them
Manage Wazuh indexer users and roles, and Wazuh manager API role-based access control (RBAC)
Manage Wazuh agents, agent groups, and enrollment tokens
Monitor and configure the Wazuh manager and the Wazuh indexer
Configure notifications and alerting integrations
Generate reports
Check the health status of the Wazuh components
Data visualization and analysis
The Wazuh dashboard organizes security data into pages that you open from the side navigation menu. Each page combines dashboards, event tables, and filters for one area of your environment.
The Home > Overview page is the default landing page. It summarizes Wazuh agent status and findings, and provides links to other pages.
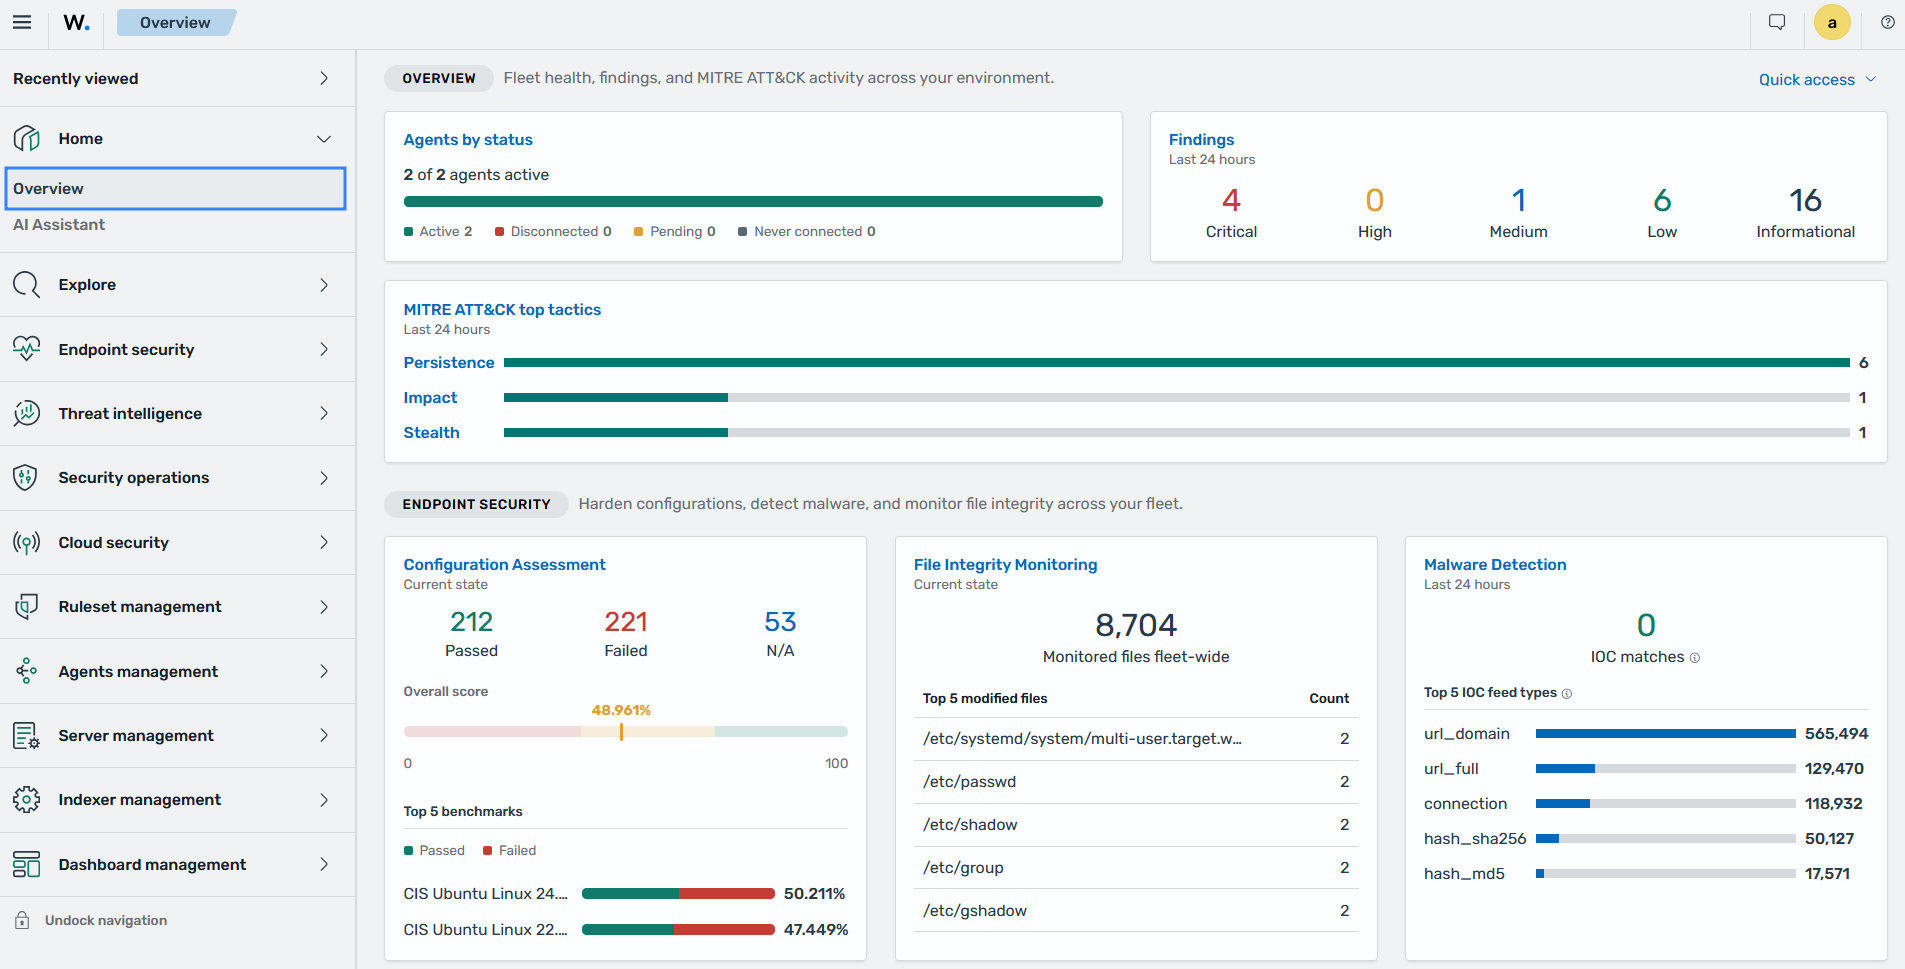
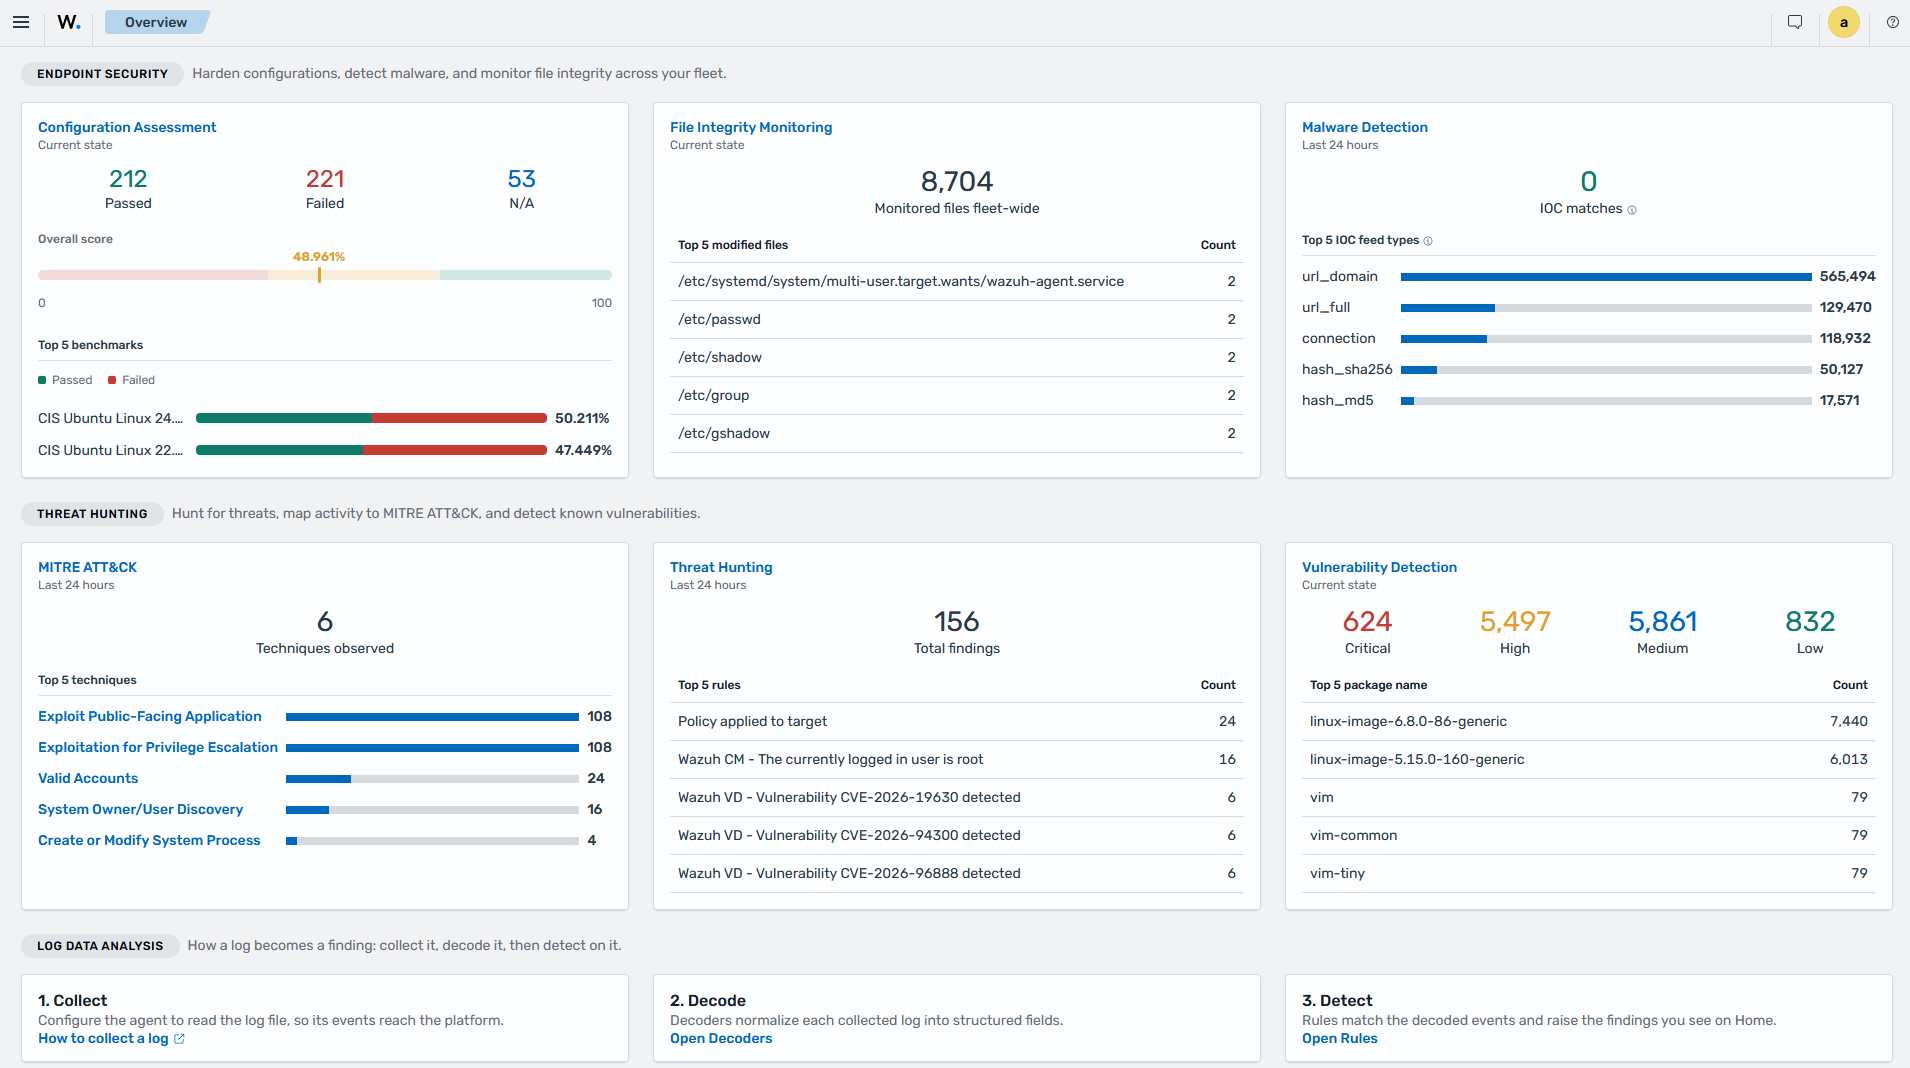
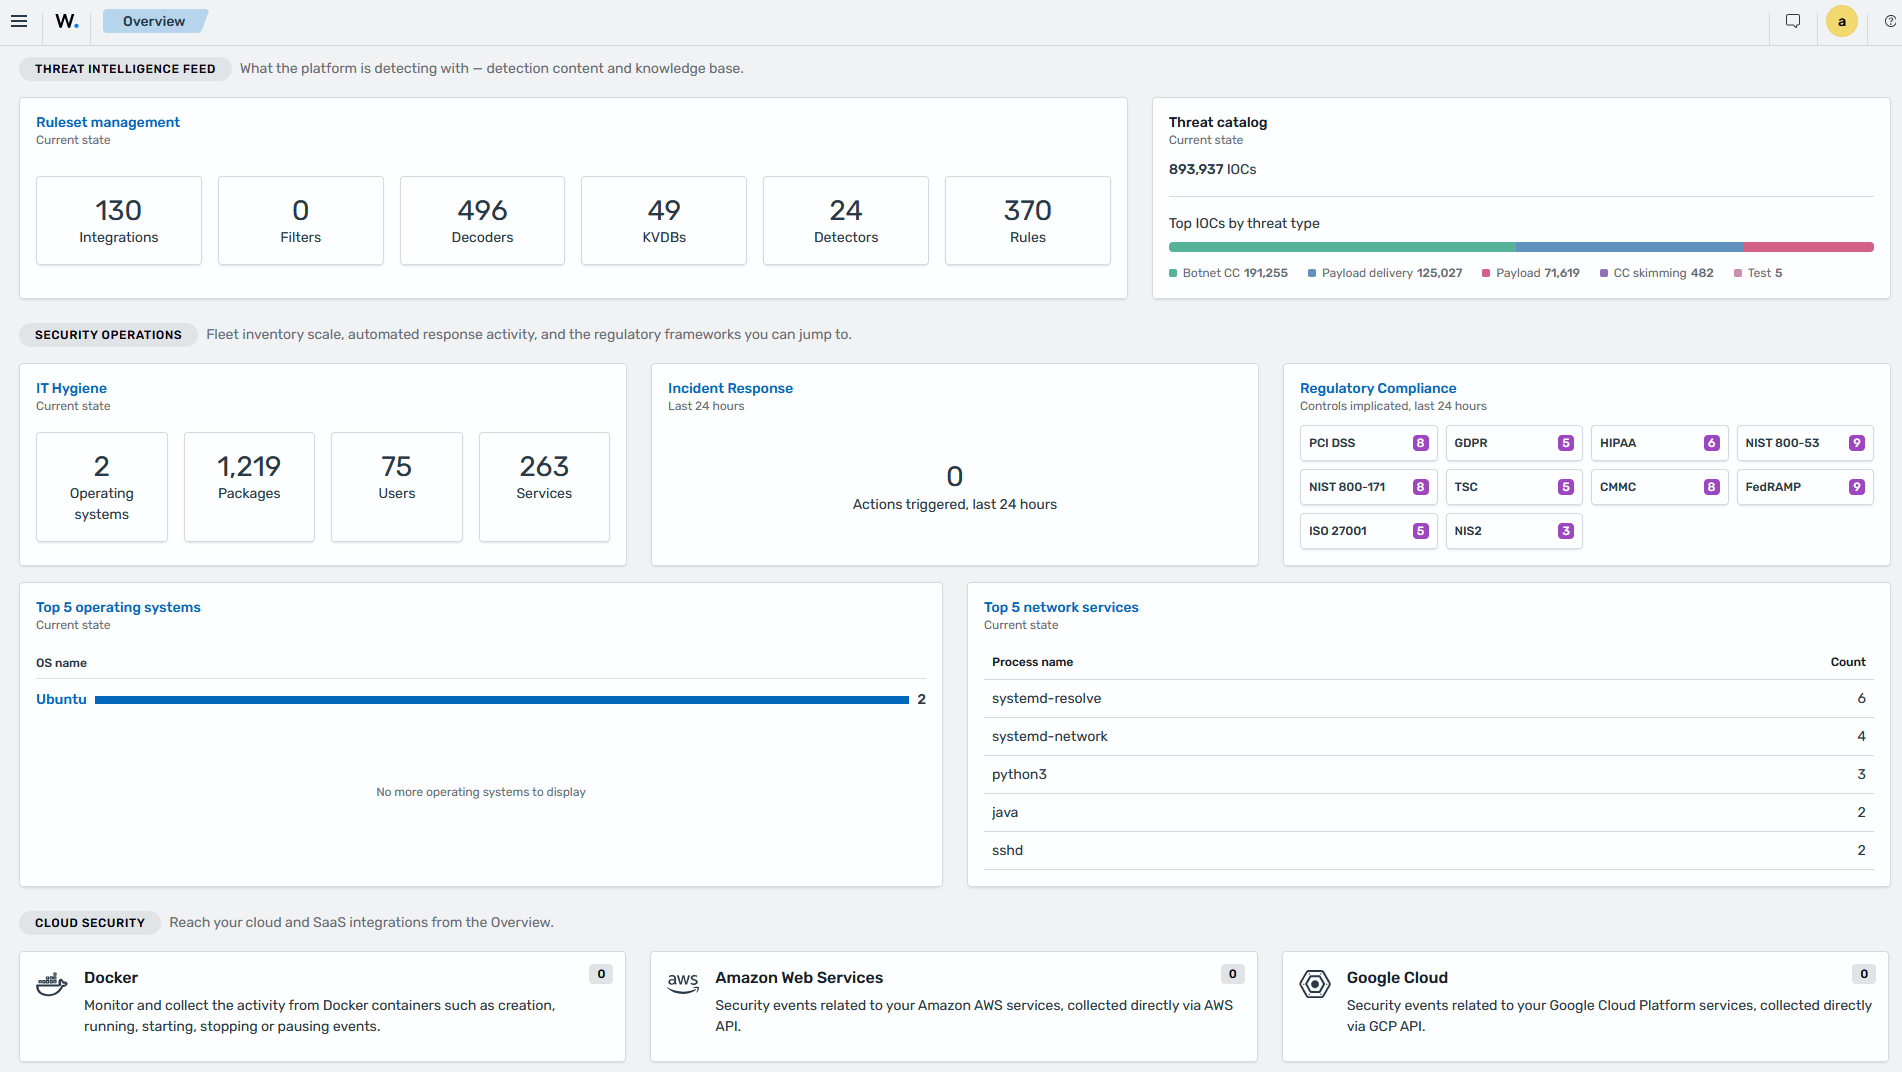
The Wazuh pages are grouped into these menus:
Endpoint security: Configuration Assessment, Malware Detection, and File Integrity Monitoring
Threat intelligence: Threat Hunting, MITRE ATT&CK, Vulnerability Detection, and Case Management
Security operations: IT Hygiene, Regulatory Compliance, and Incident Response
Cloud security: Docker, Amazon Web Services, Google Cloud, GitHub, Office 365, and Microsoft Graph API
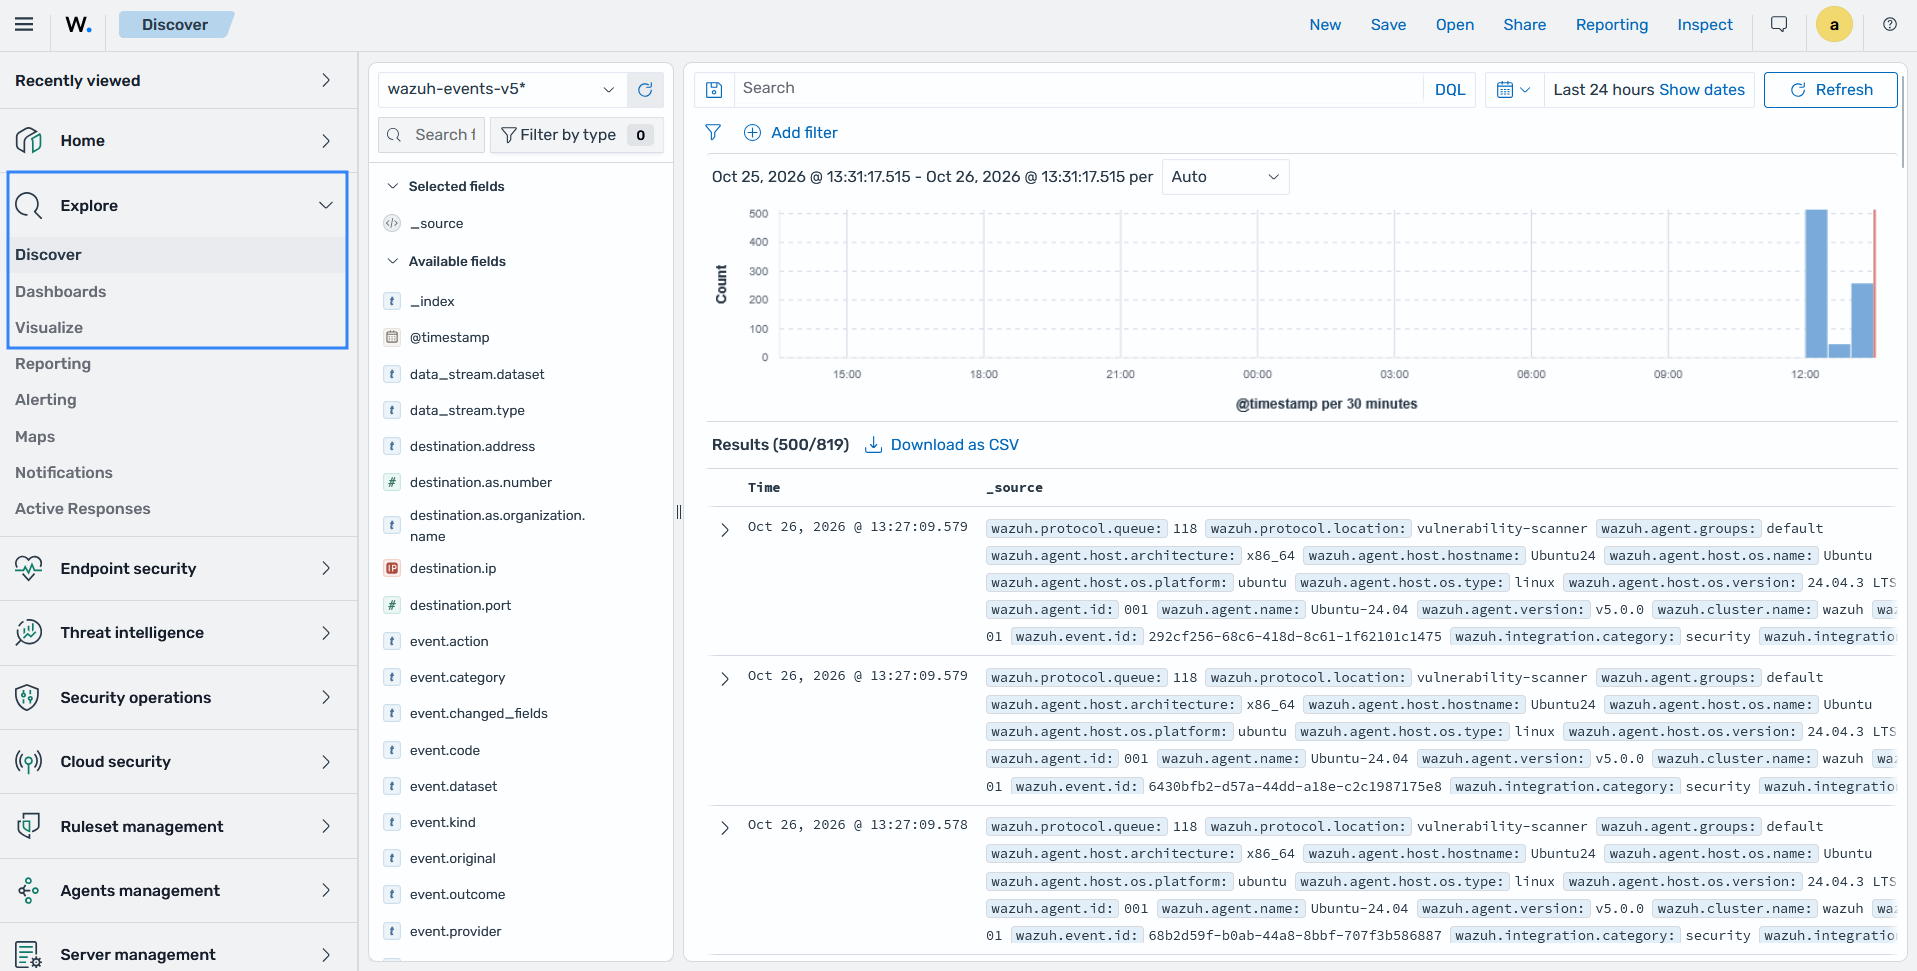
The Explore menu includes Discover, Dashboards, and Visualize. You can use them to search raw data and build custom dashboards and charts.
Wazuh manager and Wazuh indexer management
The Wazuh dashboard provides a user interface to manage a Wazuh deployment. You can monitor the status, logs, and statistics of the Wazuh manager, and configure the Wazuh manager and the Wazuh indexer.
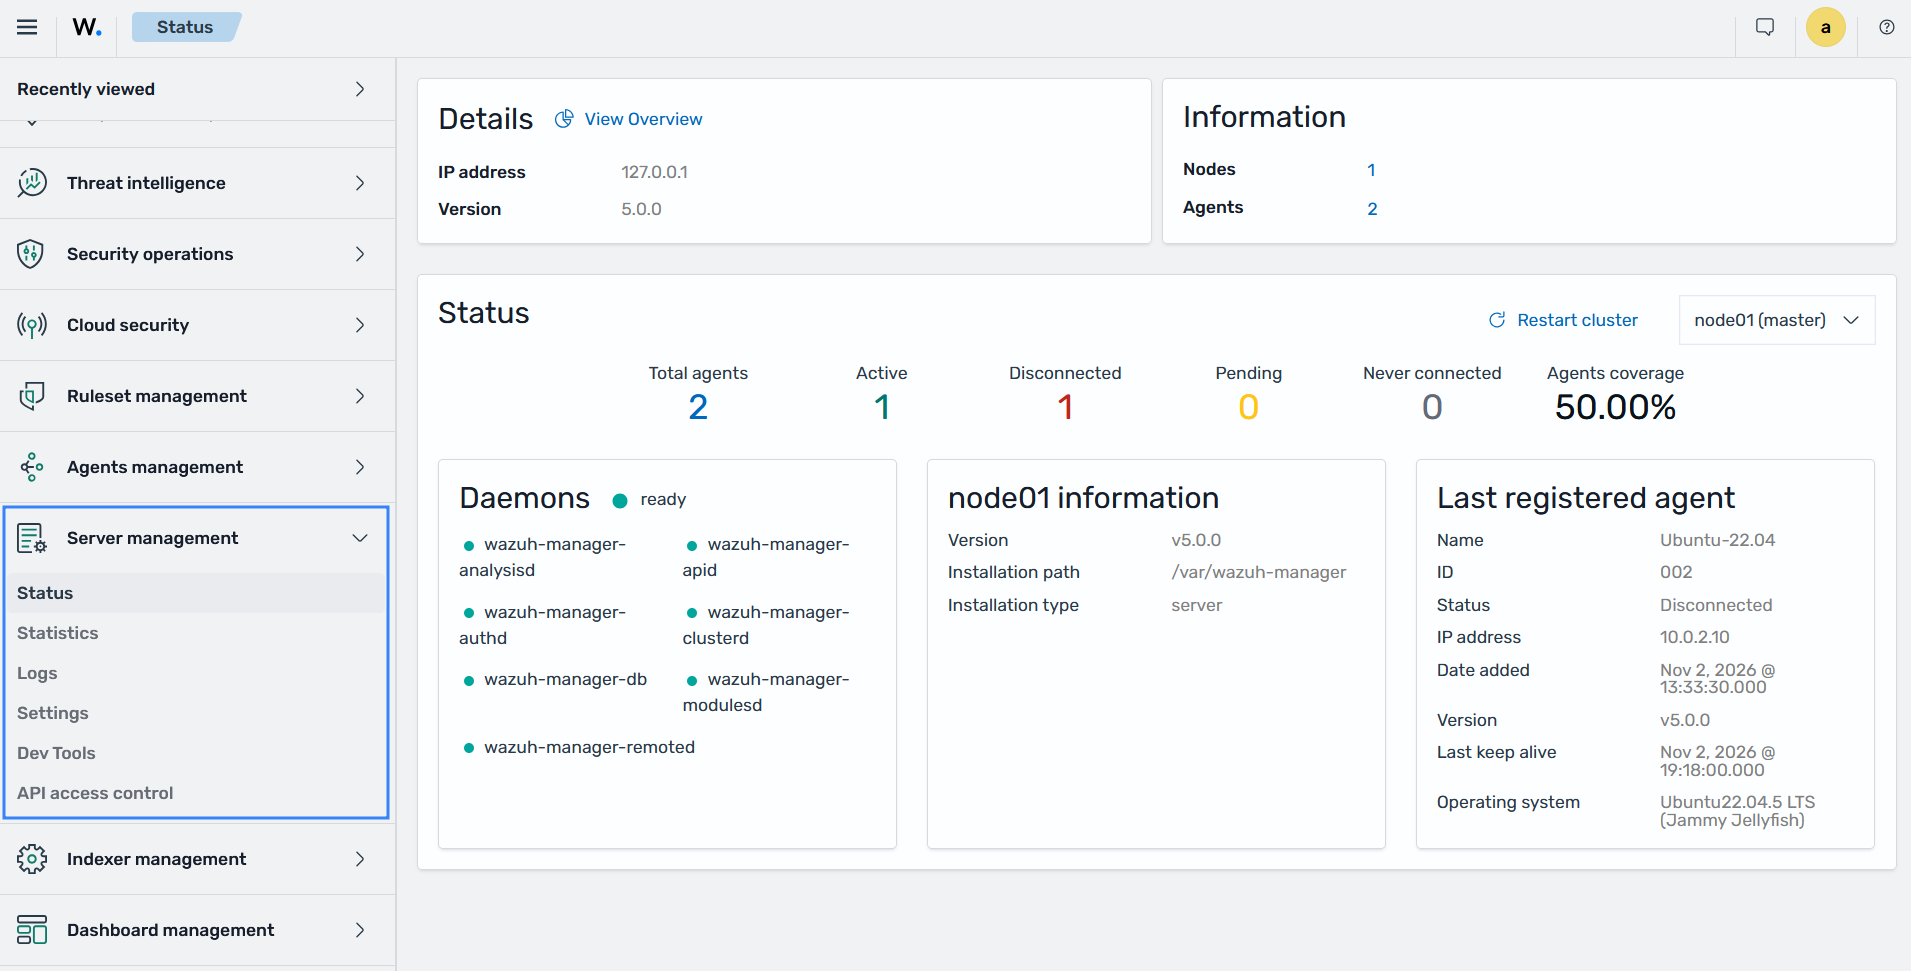
The Server management menu contains pages for the Wazuh manager:
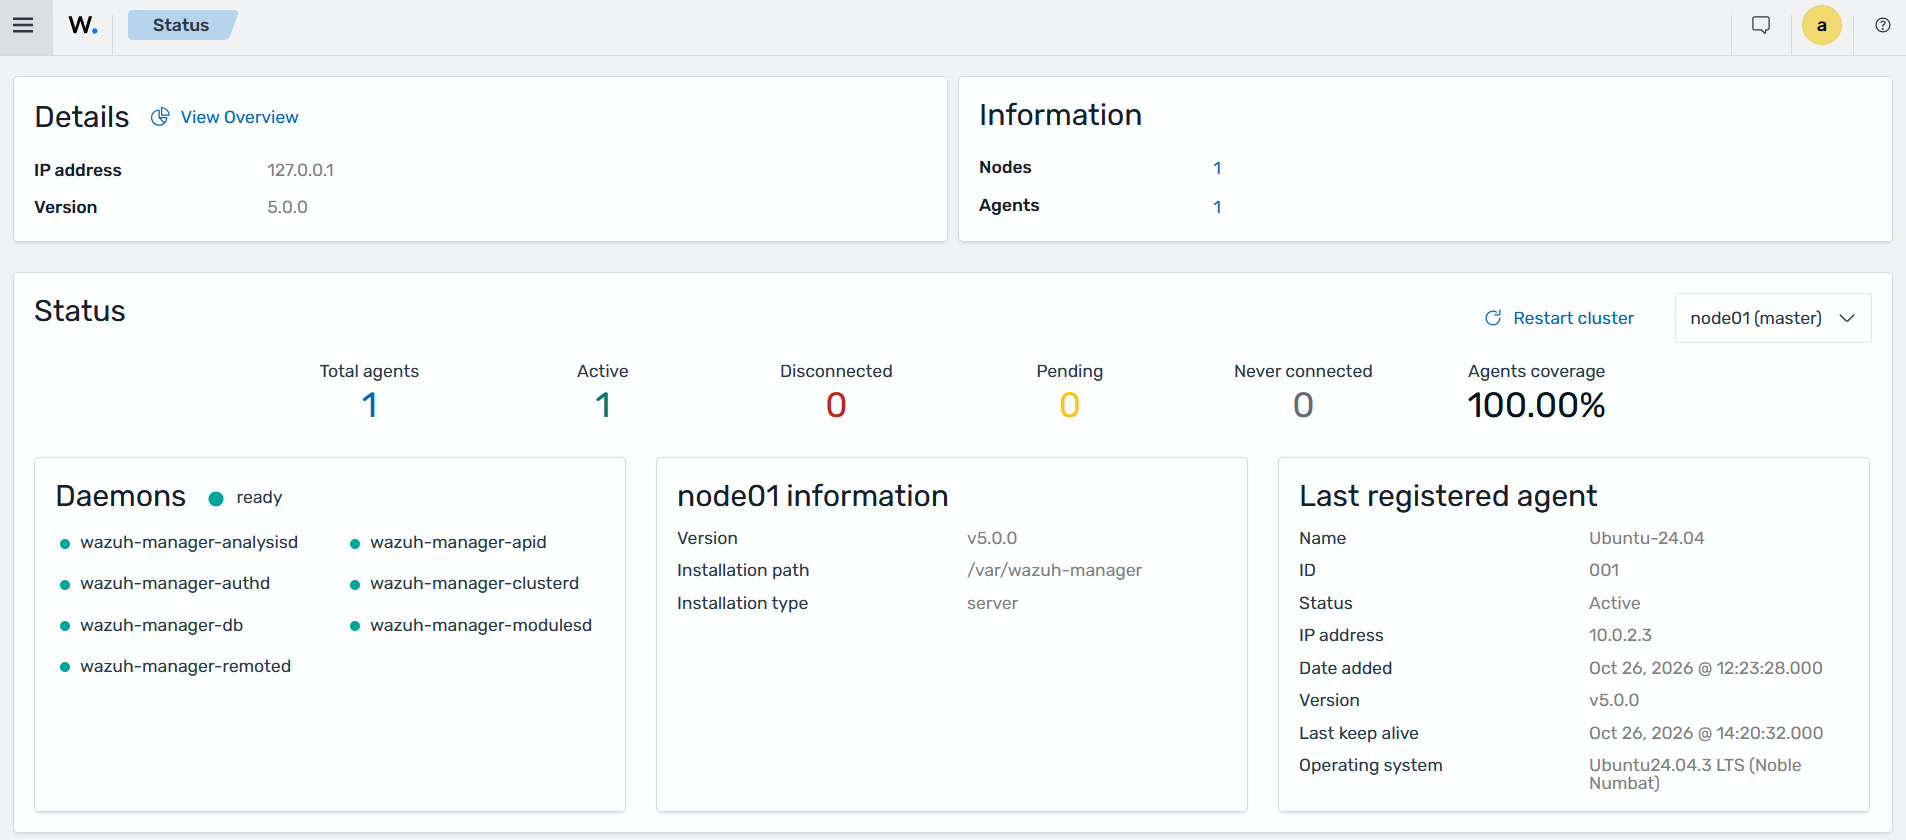
Status: The status of the Wazuh manager
Statistics: Statistics about the environment
Logs: The logs of the Wazuh manager cluster
Settings: The Wazuh manager cluster configuration
Dev Tools: A console to send requests to the Wazuh manager API
Security: Wazuh manager API users, roles, and policies
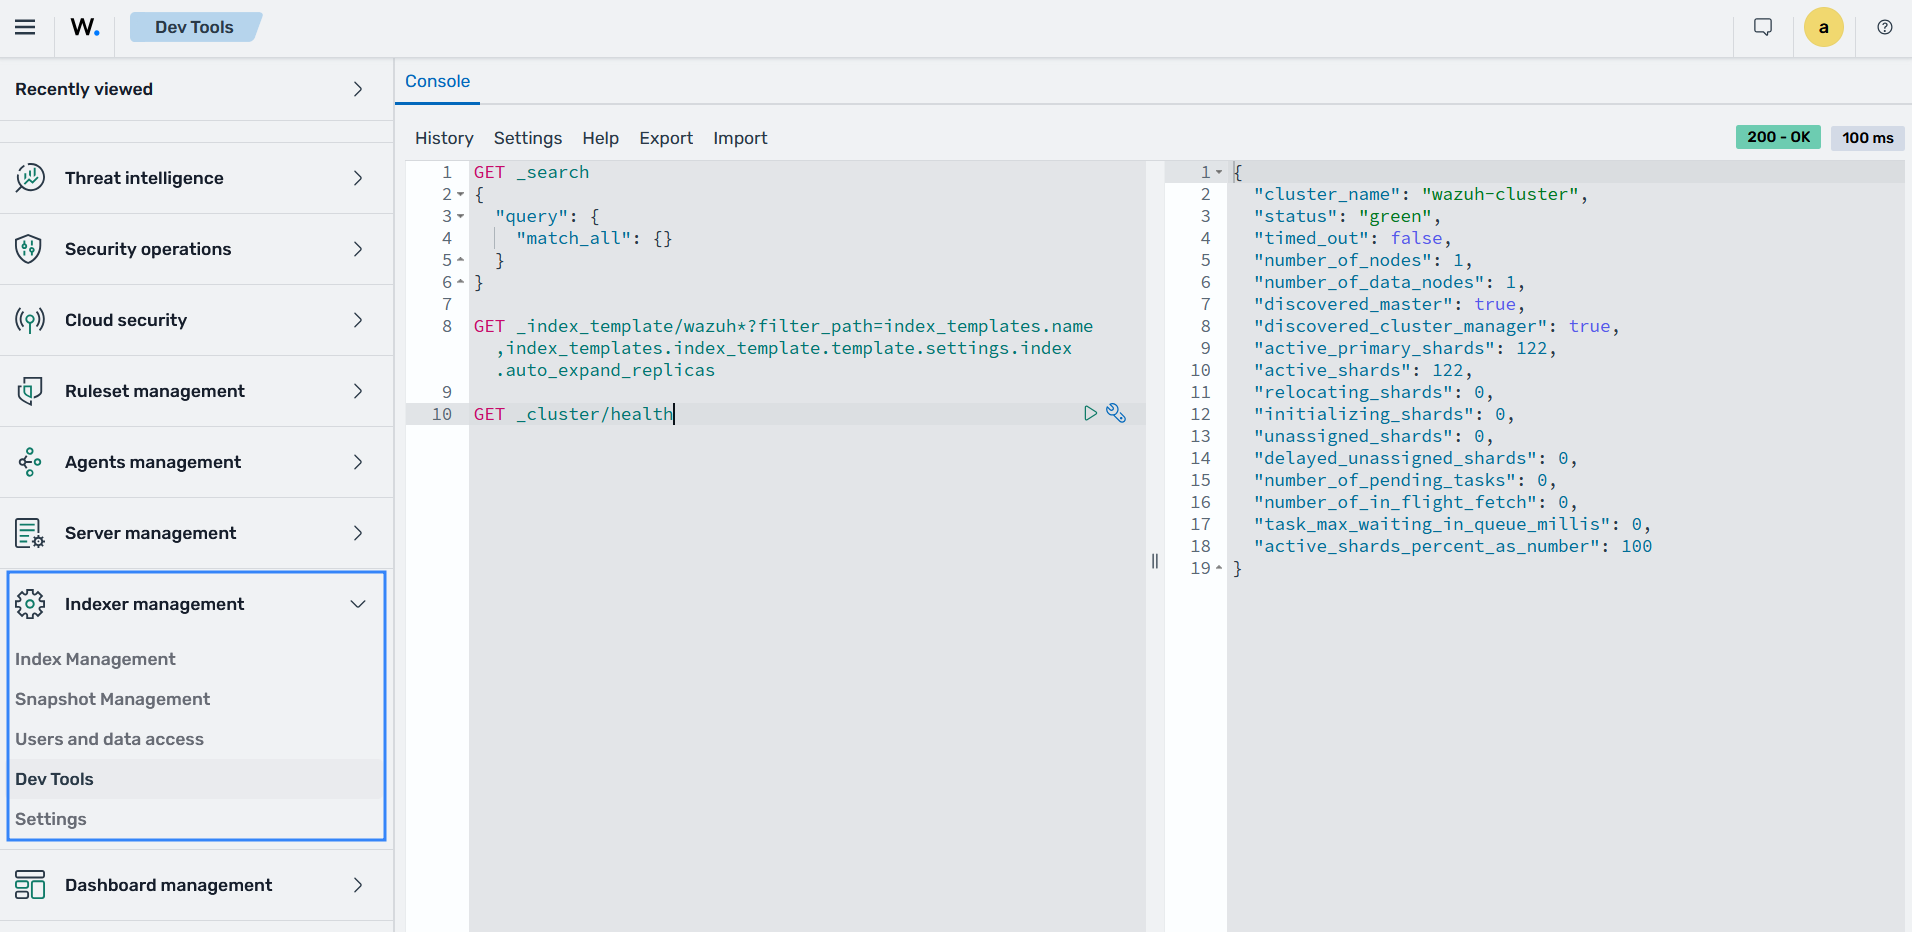
The Indexer management menu contains Dev Tools, a console to send requests to the Wazuh indexer API. It also contains the index management pages and the Wazuh indexer Settings page.
The Dashboard management menu contains Dashboards Management, Health Check, Server API, and About. Health Check runs checks on the Wazuh dashboard setup, such as the Wazuh manager API connection, certificates, and index patterns. Server API shows and manages the connection to the Wazuh manager API.
Ruleset management
The Wazuh dashboard provides a user interface for the ruleset content that normalizes events and detects threats. You create and edit decoders, rules, and KVDBs in the dashboard, and the Wazuh indexer stores them.
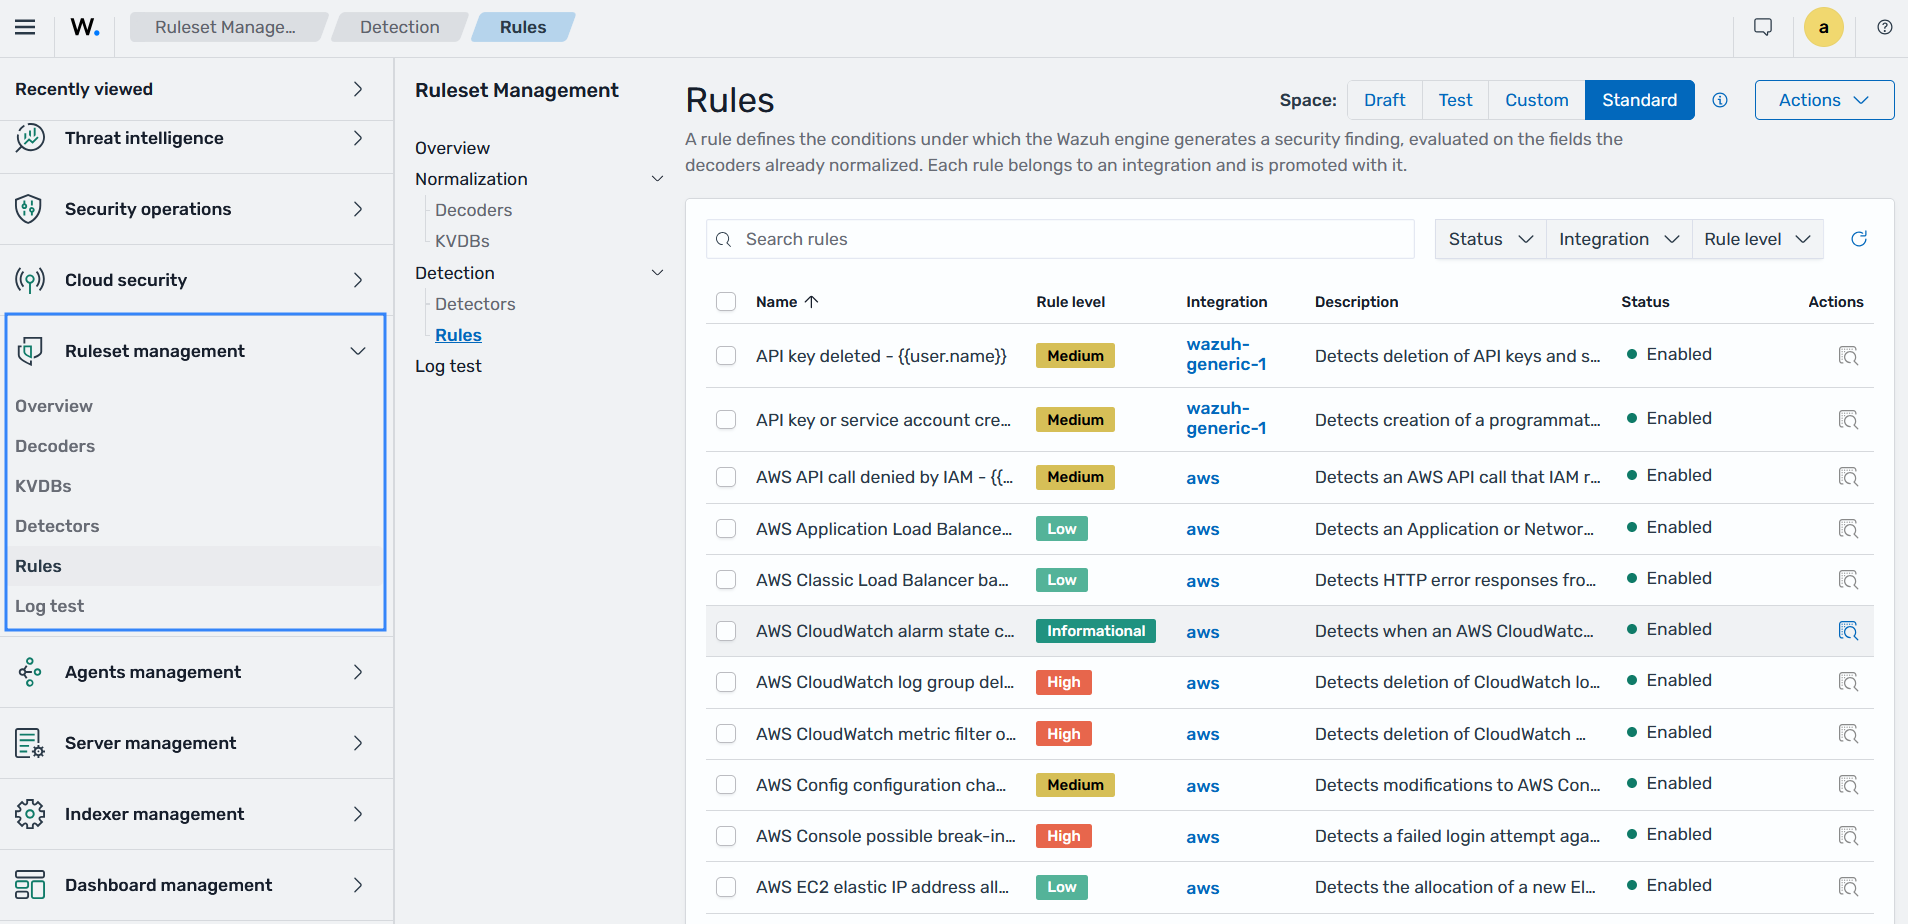
The Ruleset management menu contains the following pages:
Overview: The integrations available in your deployment
Decoders: Decoders that normalize raw events
KVDBs: Key-value databases that the ruleset uses
Detectors: Detectors that run rules continuously on an index or alias
Rules: Detection rules that the detectors run
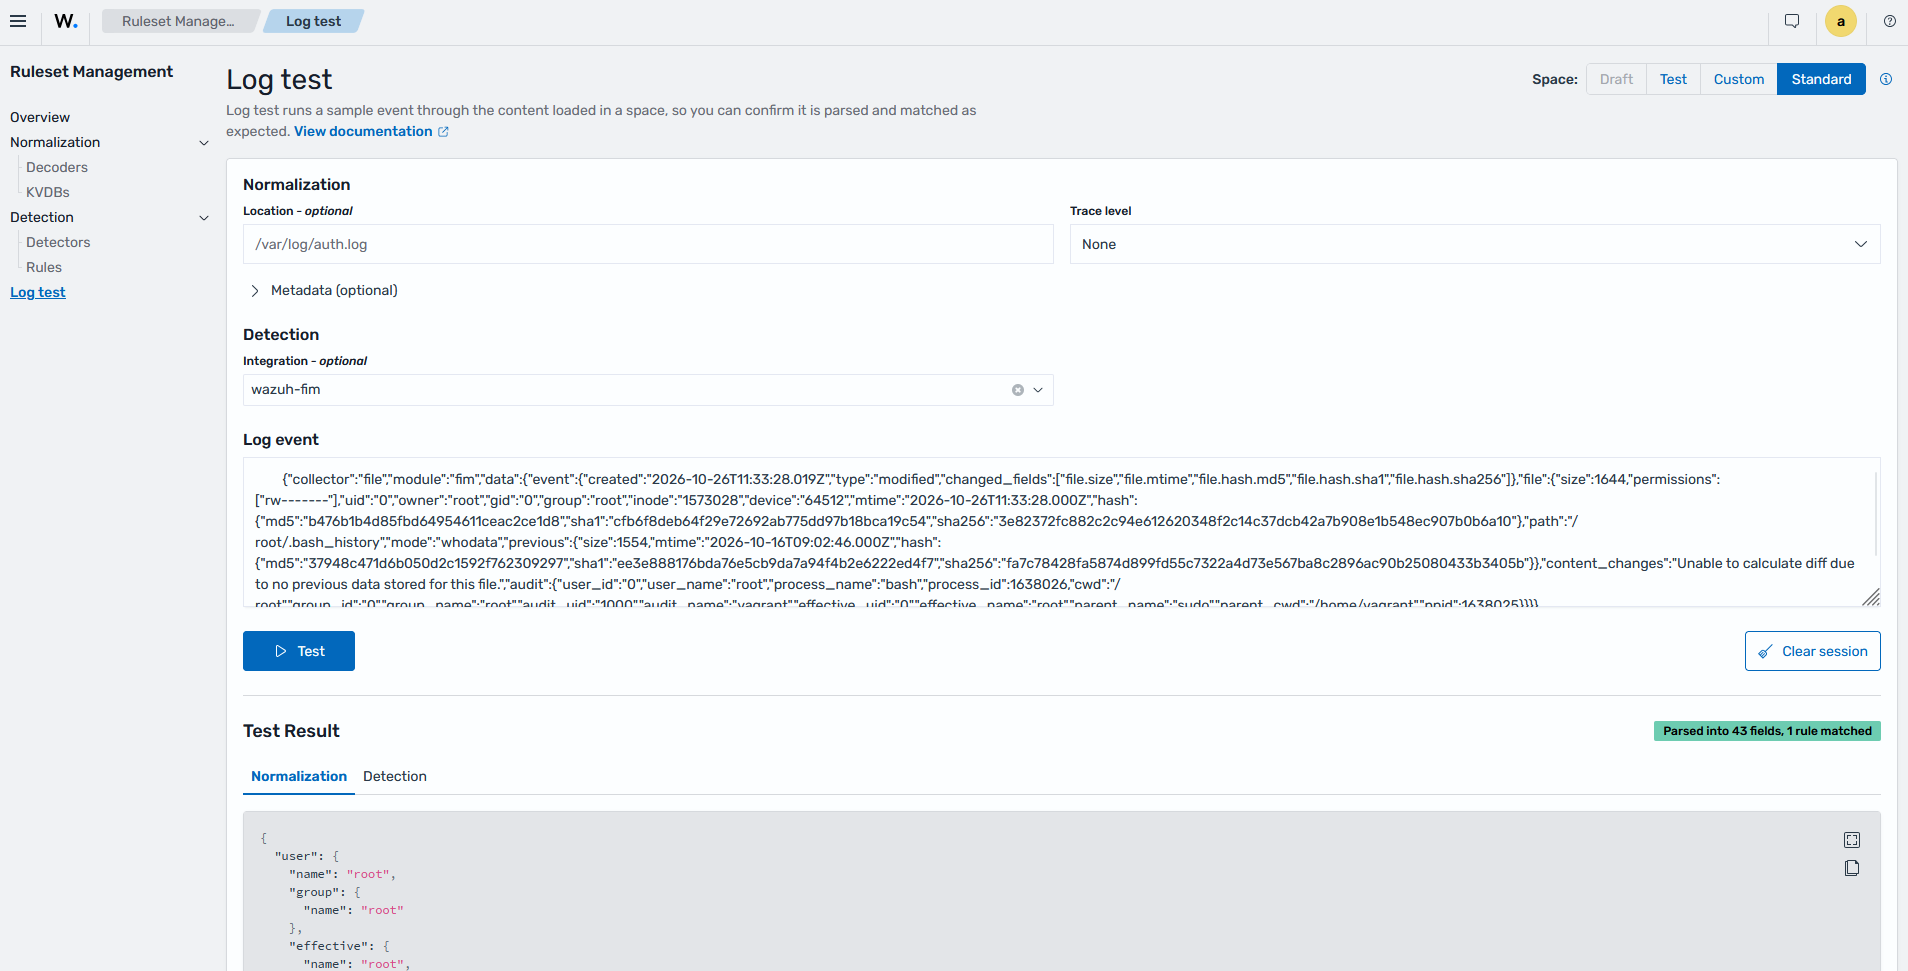
Log test: A tool that processes a sample log and shows the result
The Wazuh dashboard sends this content to the content manager REST API of the Wazuh indexer. You can use Log test to check custom decoders and rules before you rely on them.
Wazuh agents management
The Wazuh dashboard gives you a central place to deploy, organize, and maintain Wazuh agents. You can manage Wazuh agents from enrollment to upgrade.
The Agents management menu contains the following pages:
Summary: The list of Wazuh agents and their status
Groups: Agent groups and their shared configuration
Enrollment tokens: The tokens that Wazuh agents enroll with
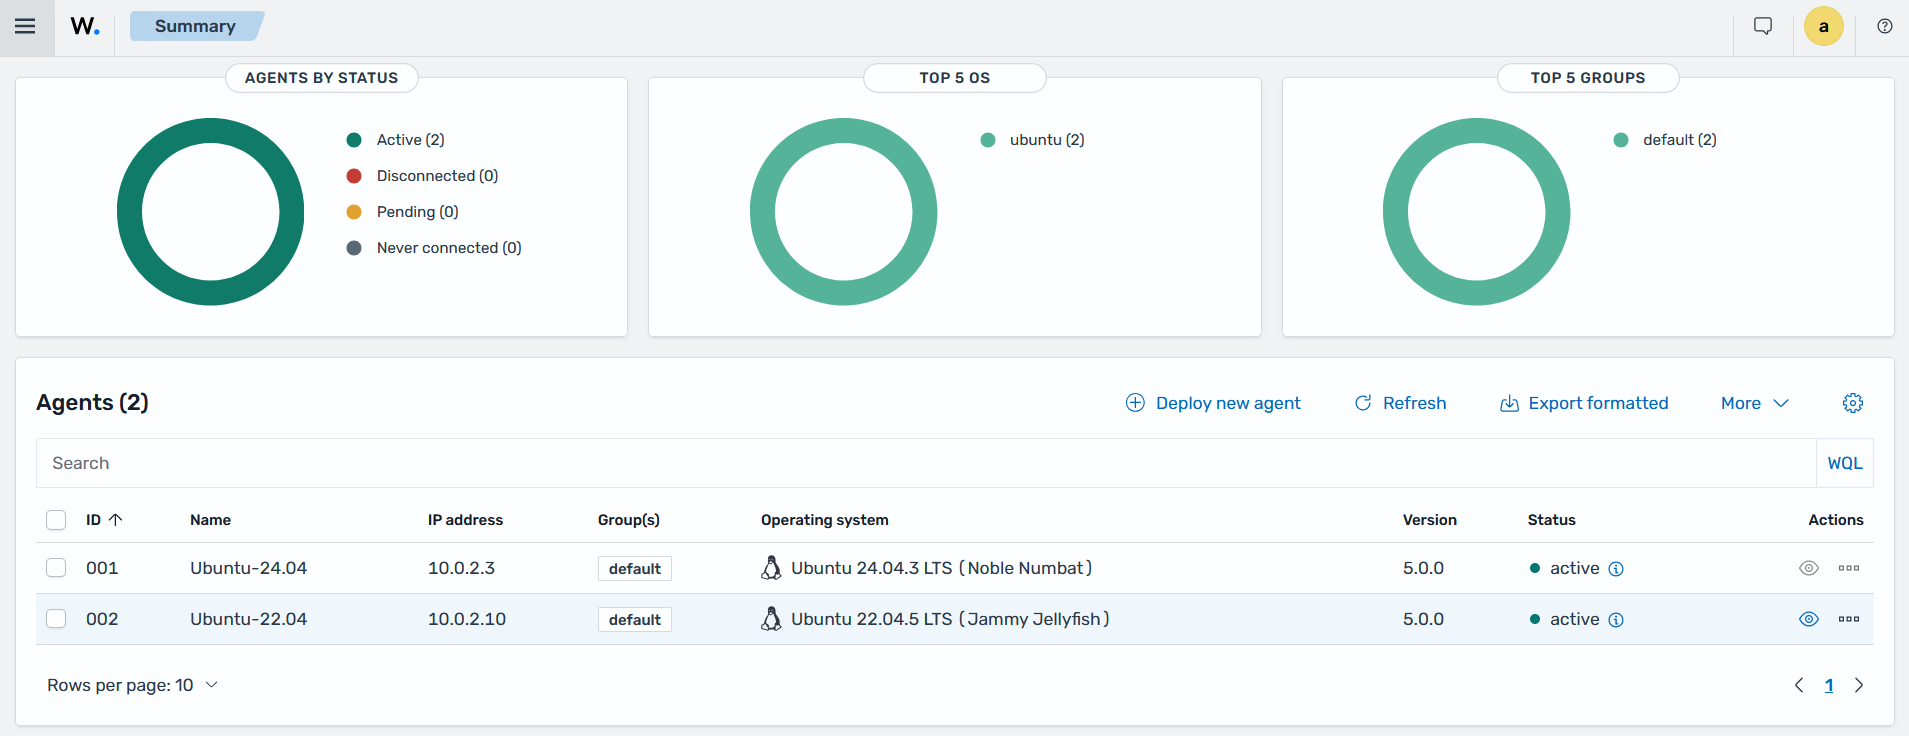
For each agent group, you can edit the shared configuration in the agent.conf file. The shared configuration defines which Wazuh agent modules are enabled and which log files they read. It also defines which files they monitor for integrity changes and which configuration checks they run.
Health checks, notifications, and alerting integrations
You can monitor the status and statistics of the Wazuh manager cluster, and run health checks on the Wazuh dashboard setup.
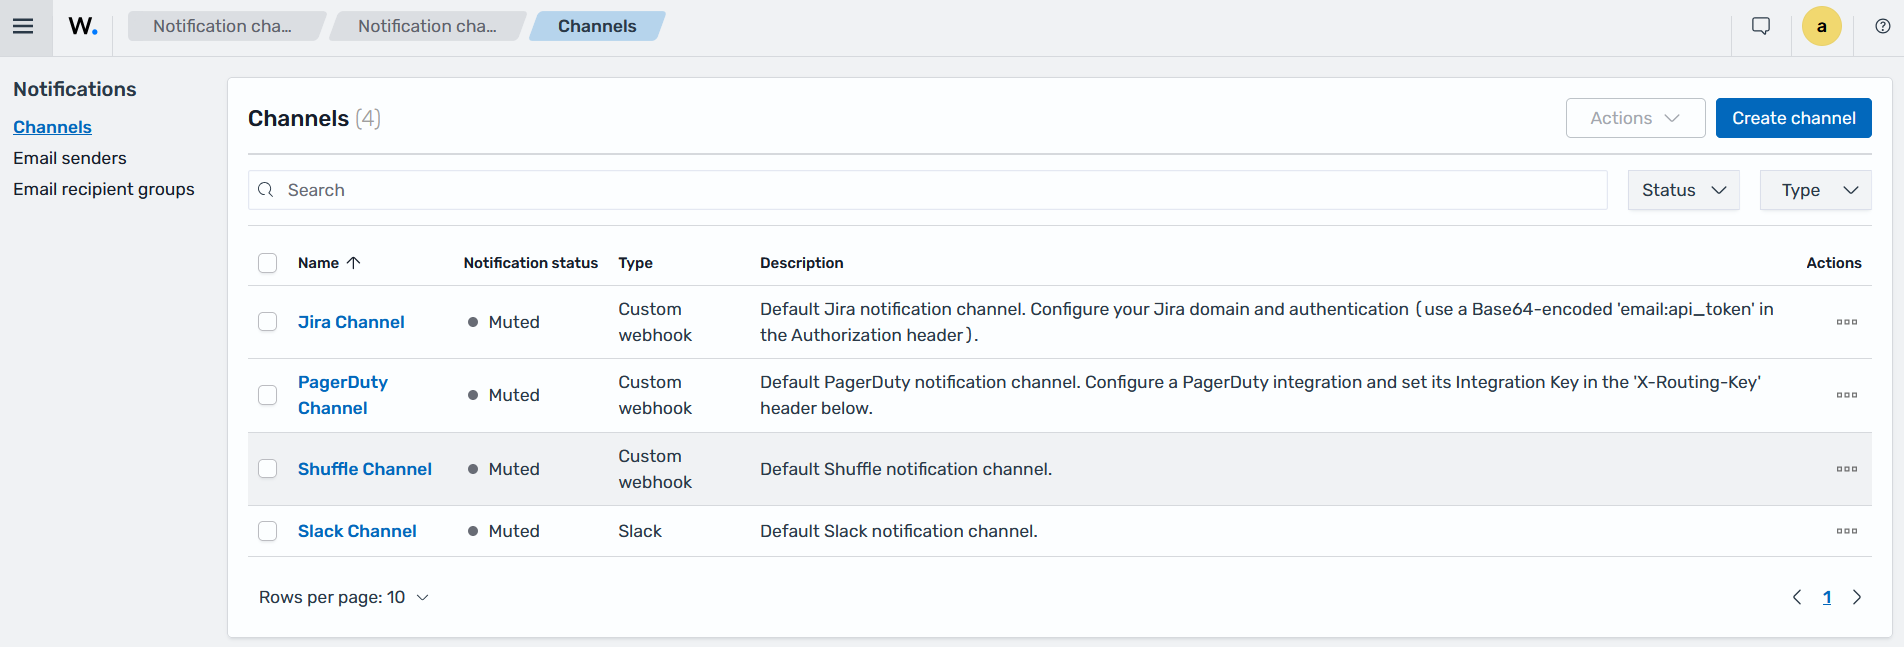
You can also send notifications to external services, such as Slack, Jira, PagerDuty, and Shuffle. The Wazuh indexer creates a default notification channel for each of these services when it starts for the first time. The channels start disabled with placeholder values, so you configure and enable them under Explore > Notifications > Channels. Health Check verifies that the default channels exist.
AI Assistant
The Wazuh dashboard includes an AI Assistant that you open from the Home menu. It provides a chat interface where you ask security questions in plain language and get answers from your Wazuh data.
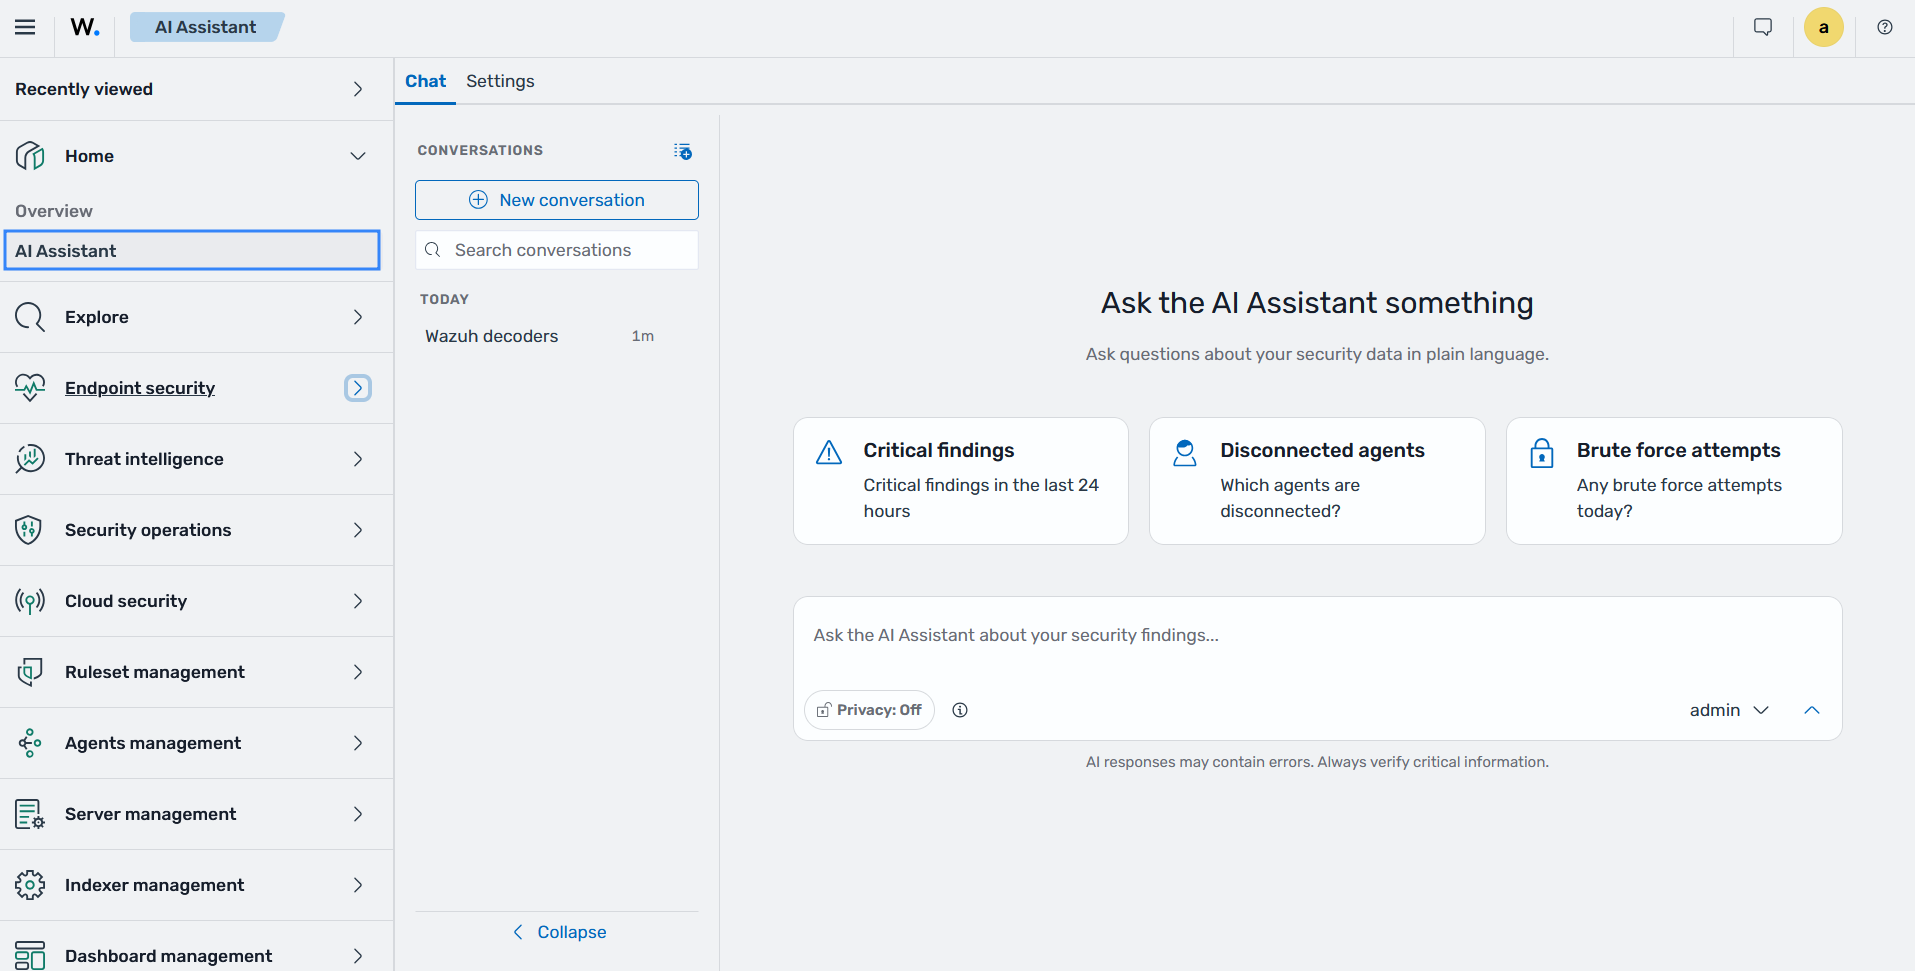
The Wazuh dashboard encrypts the AI provider API keys that the AI Assistant stores. The Wazuh dashboard package generates the wazuh_ai_assistant.encryptionKey encryption key in the Wazuh dashboard keystore if it is not defined in either the keystore or opensearch_dashboards.yml.
Next steps
To install the Wazuh dashboard, see the Wazuh dashboard installation guide.
To learn how to navigate and configure the Wazuh dashboard, see the Wazuh dashboard section of the user manual.