Monitoring Google Cloud Pub/Sub
Wazuh integrates with the Google Cloud Pub/Sub messaging and ingestion service using the Wazuh Google Cloud Pub/Sub module. Google Cloud Pub/Sub is widely used for event-driven systems and streaming analytics. It lets applications send and receive messages. The Wazuh module for Google Cloud Pub/Sub can fetch the following events from your Google Cloud environment:
Audited resources
DNS queries
VPC Flow Logs
VPC firewall Rules Logging
Once Wazuh collects these events, it processes them using its detection rules and displays the appropriate alerts on the Wazuh dashboard.
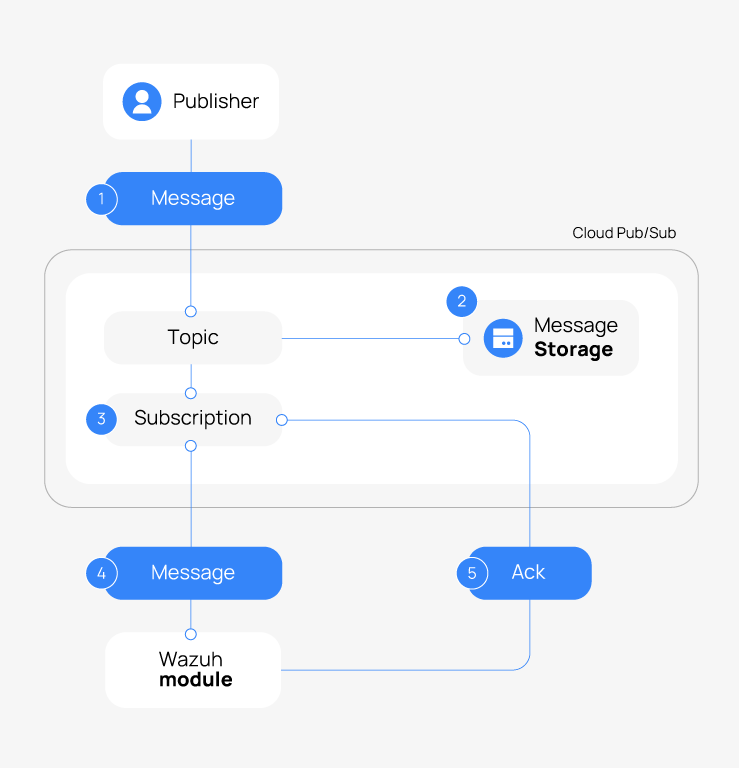
The data flow between Google Cloud Pub/Sub and Wazuh is shown below. Visit this Google Cloud documentation to learn more about the Pub/Sub service.
A publisher service or application sends messages to a Google Cloud Pub/Sub topic.
Each published message remains stored until the Wazuh module for Google Cloud Pub/Sub reads and processes it.
Wazuh pulls the messages using its subscription to the Google Cloud Pub/Sub service.
Wazuh receives all messages from its subscription and acknowledges each one to the Google Cloud Pub/Sub service.
Google Cloud Pub/Sub then removes messages from the subscription queue.
Configuring Google Cloud Pub/Sub
To integrate Wazuh with Google Cloud Pub/Sub, first create a topic and a subscription, then configure the Wazuh agent with the subscription details and credentials. This section describes how to perform each step.
Creating a topic
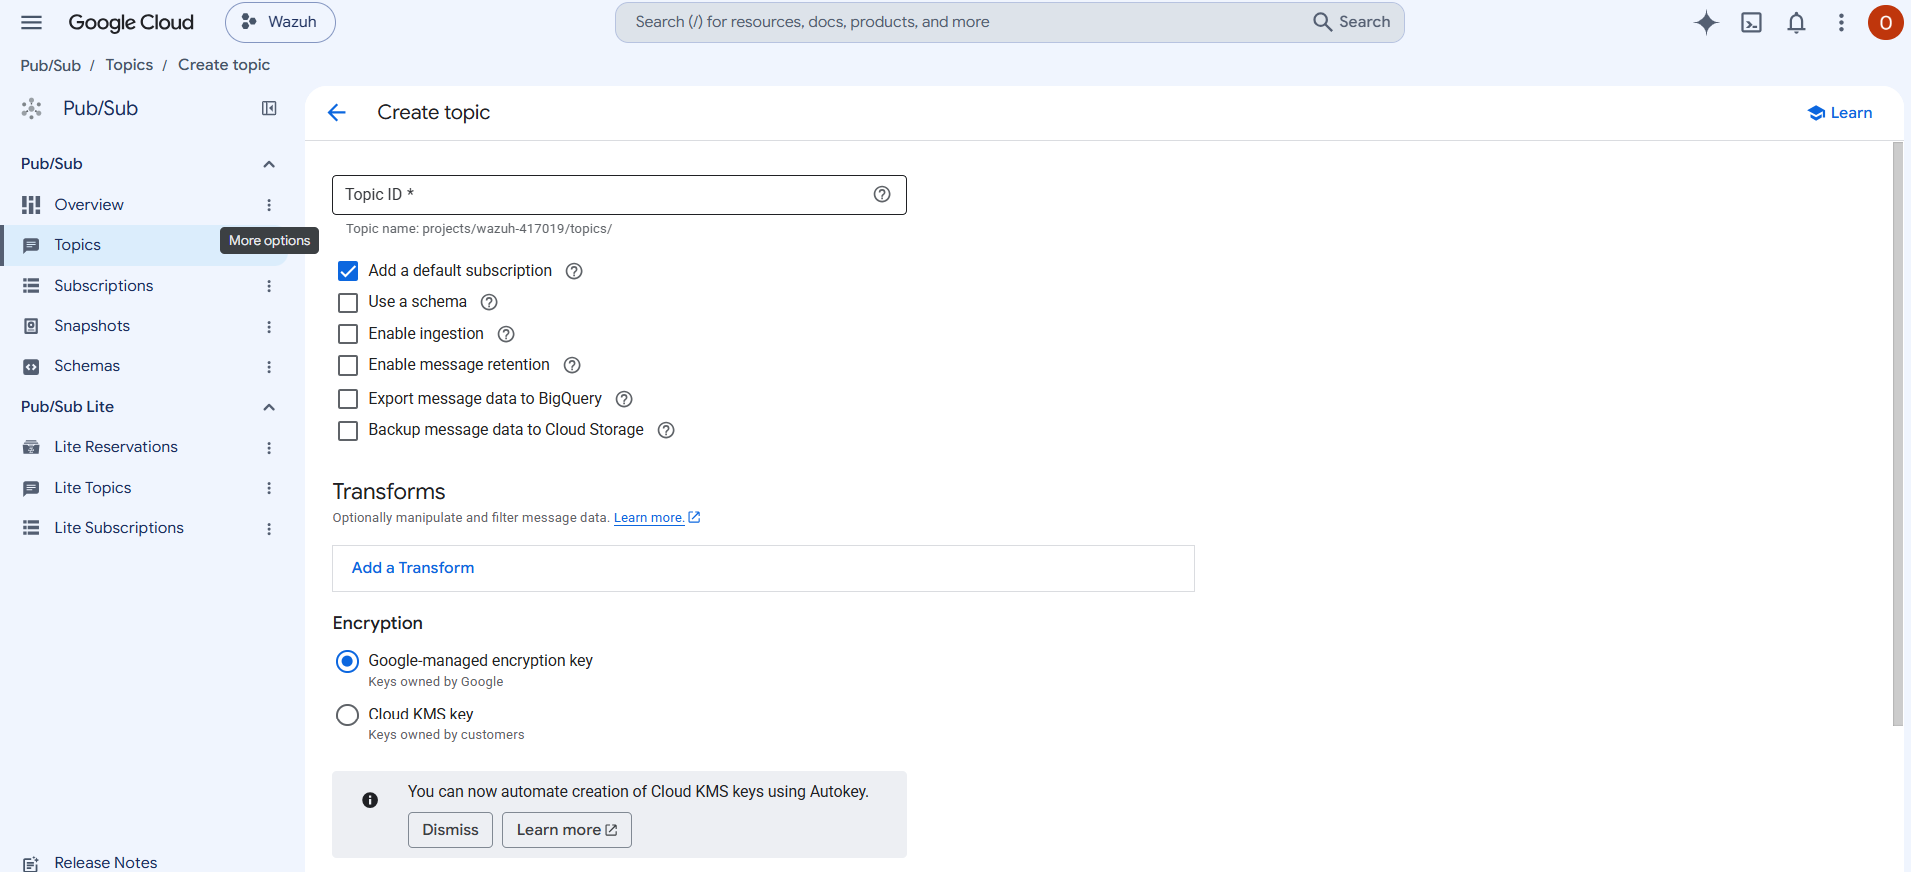
In the Google Cloud console, click Pub/Sub or search for Pub/Sub in the search bar, then select it.
Click on the Topics tab and select Create Topic.
Enter a name for your topic in Topic ID and click Create to create the topic.
Note
Creating a topic will automatically create a new subscription. If Google Cloud does not create a subscription automatically, or you need additional subscriptions, follow the steps below. Otherwise, skip this section.
Adding a subscription
In the left-hand navigation pane, click on Pub/Sub to open the Pub/Sub section.
Click on Topics and select the topic you just created.
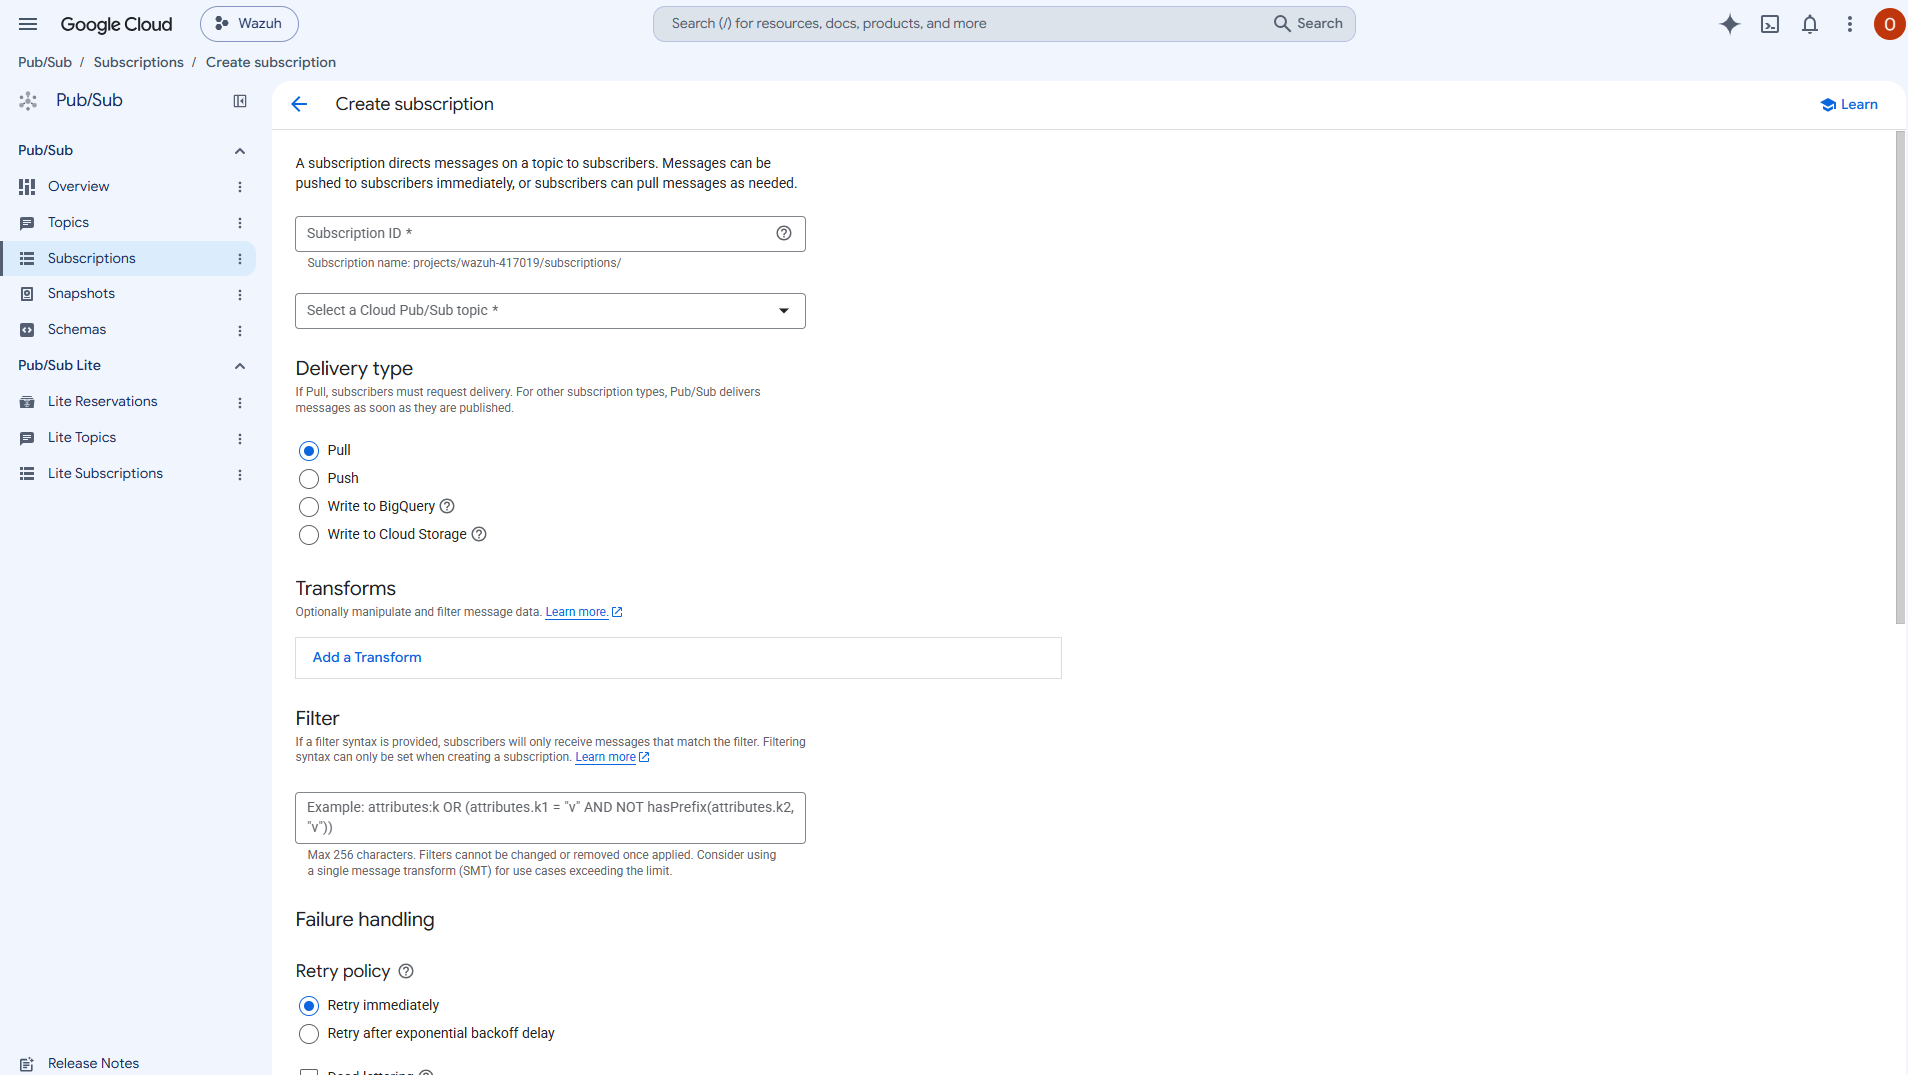
In the Subscription tab, click on Create subscription and fill in the subscription form:
Fill in the Subscription ID
Select a topic from Select a Cloud Pub/Sub topic
Choose Pull in the Delivery type field
Select the duration of the Message retention duration
Select the duration in days of the Expiration period
Create additional subscriptions as required.
At this point, the Pub/Sub environment is ready to manage the message flow between the publishing services and the Wazuh module for Google Cloud Pub/Sub.
Exporting Google Cloud logs through a Sink
Google Cloud log activities appear under the Log Router section. Configure a sink to publish Cloud audit logs to a Cloud Pub/Sub topic. Create a logging sink and select the Pub/Sub topic as its destination. Follow these steps to export Google Cloud logs.
Enable logging for the supported services
Follow these steps to enable logging for the services whose logs you want to route.
VPC Flow Logs
VPC Flow Logs record network flow information for traffic to and from Compute Engine instances.
In the Google Cloud console, navigate to VPC network > VPC networks, and select the subnet whose traffic you want to monitor.
Click Edit, set Flow logs to On, and click Save.
VPC firewall rules logging
VPC firewall rule logging records connections evaluated against a firewall rule, including whether they were allowed or denied.
Navigate to VPC network > Firewall, and select the rule you want to monitor.
Click Edit, set Logs to On, select Include all metadata for full event details, and click Save.
Repeat these steps for each firewall rule you want to monitor.
DNS query logging
Cloud DNS query logging records queries Cloud DNS resolves for the VPC networks covered by a DNS server policy.
In the Google Cloud console, navigate to Network Services > Cloud DNS > Server Policies, and click Create Policy.
Provide a name, set Logs to On, and select the VPC networks the policy applies to. Leave inbound query forwarding disabled unless required.
Enabling Cloud Audit Logs (Data Access)
Google Cloud Audit Logs provide Data Access activity for supported Google Cloud services. This offers an alternative to legacy Cloud Storage usage and storage logs and can be configured directly from the Google Cloud console.
Follow the steps below to enable Data Access audit logs for Google Cloud Storage.
In the Google Cloud console, navigate to IAM & Admin > Audit Logs, and search for
Google Cloud Storagein the service list.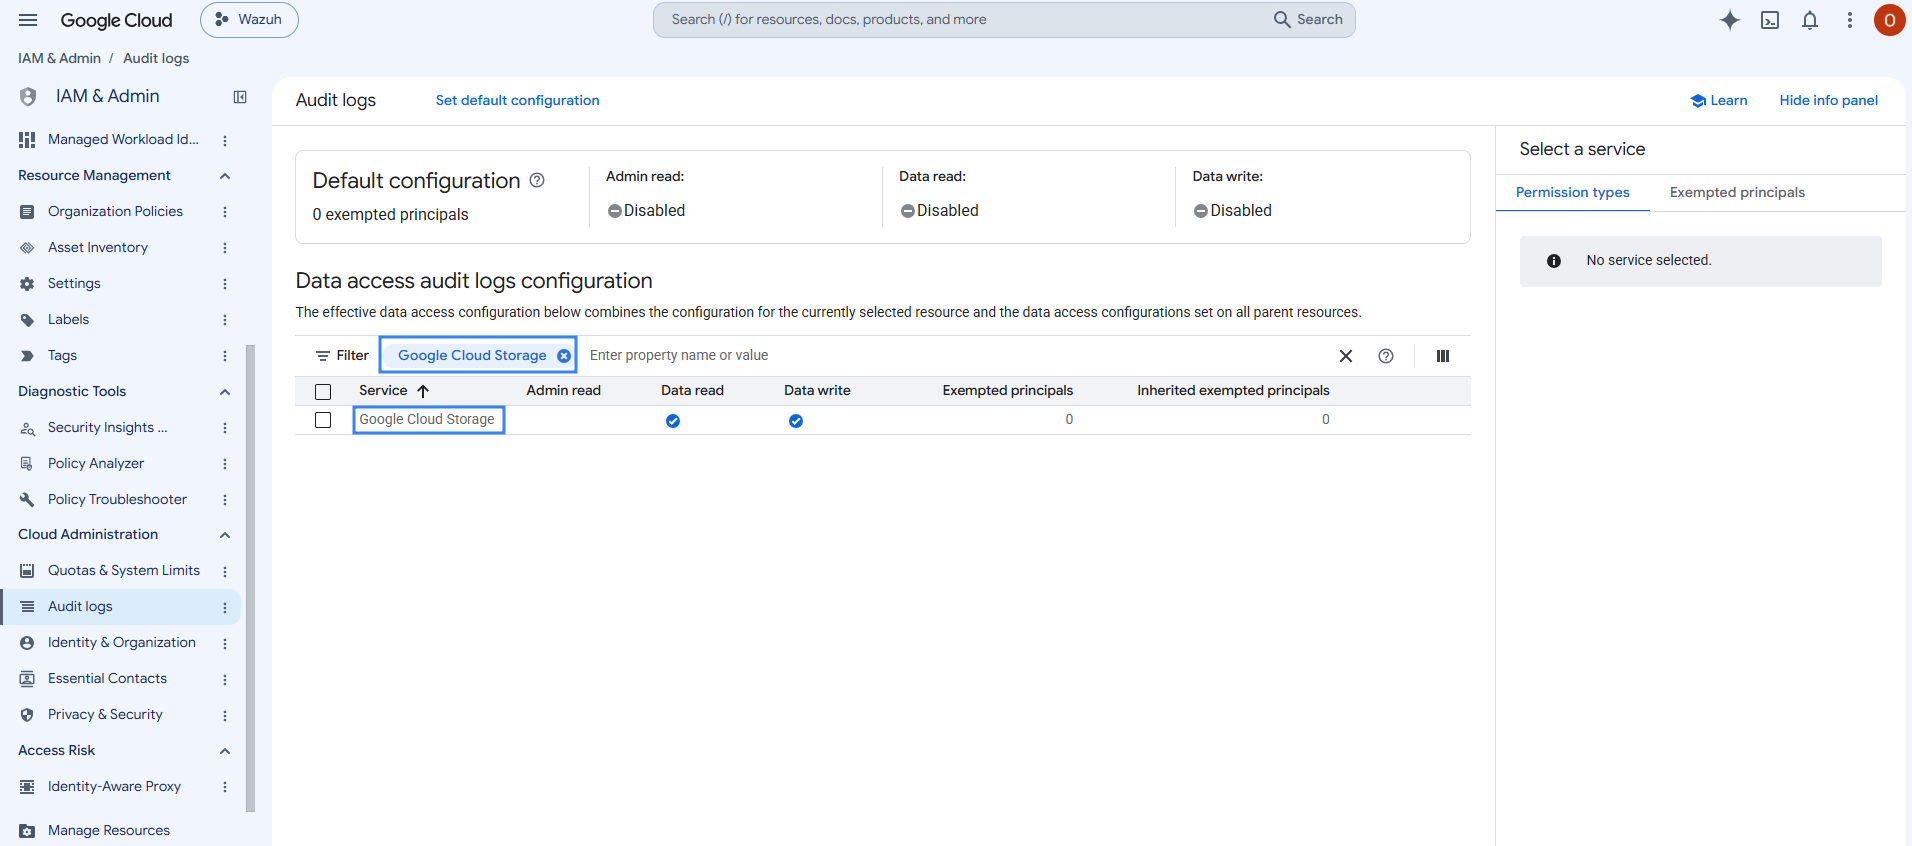
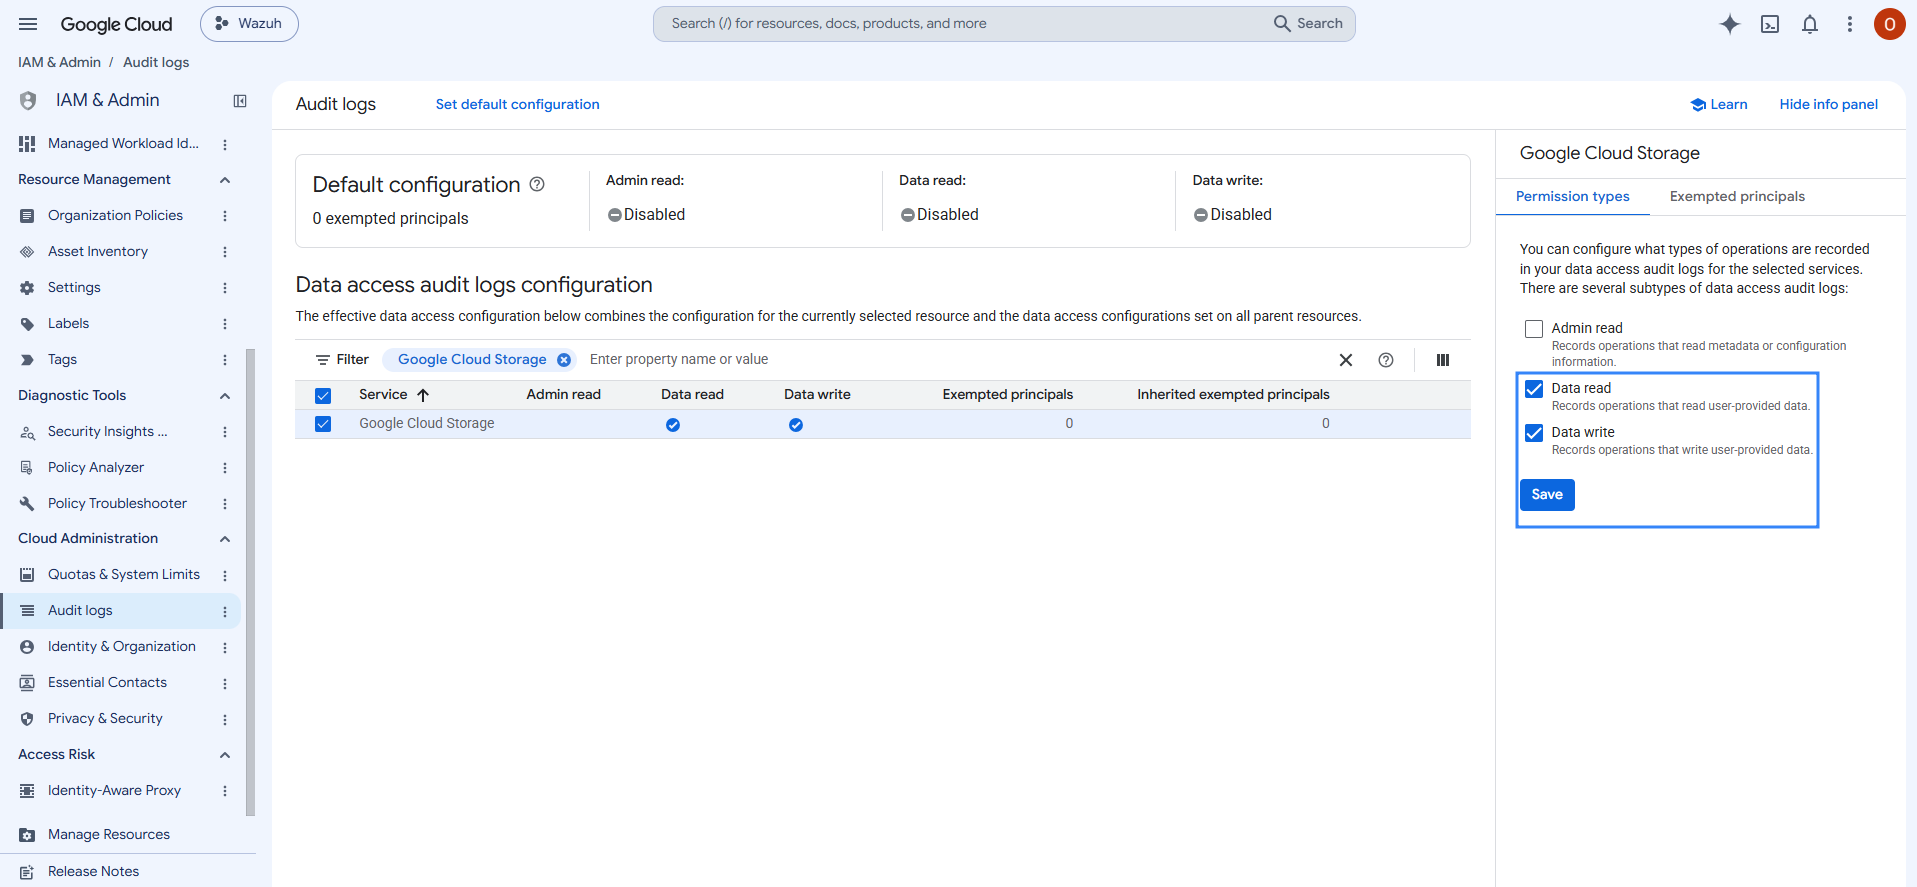
Click Google Cloud Storage to expand it, check the Data Read and Data Write boxes, then click Save.
Creating a log sink on Google Cloud
Follow the steps below to create a Sink in the Google Cloud console
In the Google Cloud console, click Logging or search for
Log Routerin the search bar, then select it.Select Log Router, then click Create Sink.
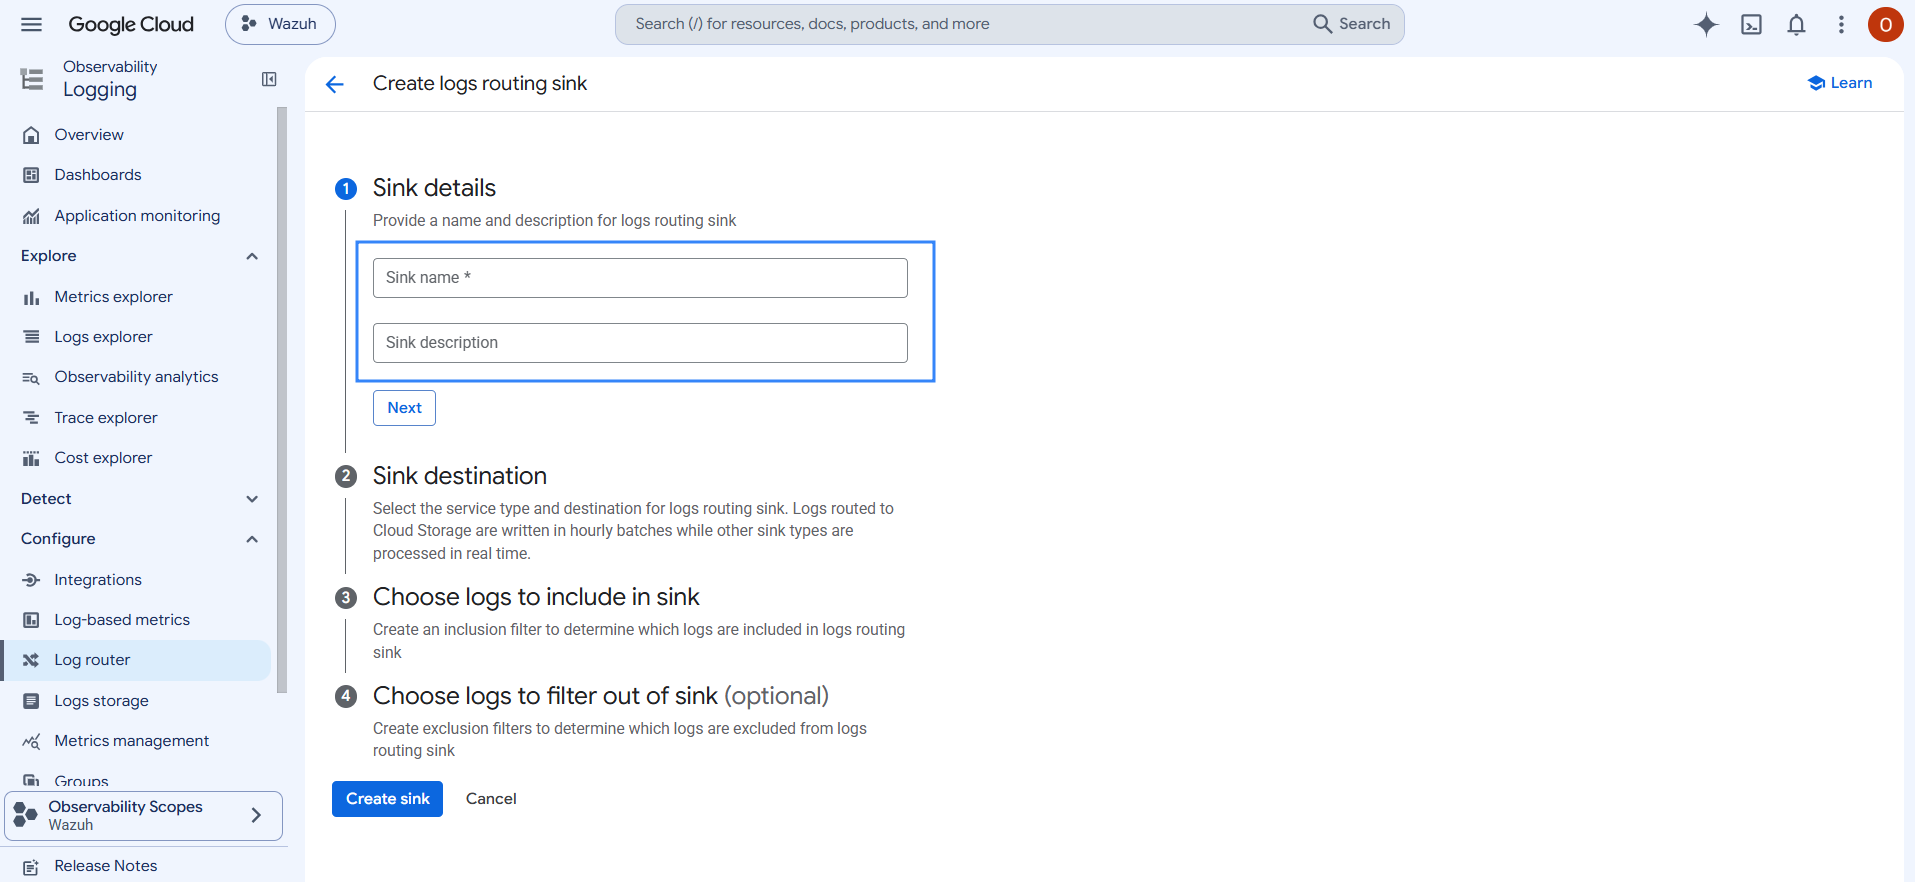
Follow the steps below to complete the Create logs routing sink form.
Provide a name and description for the logs routing sink.
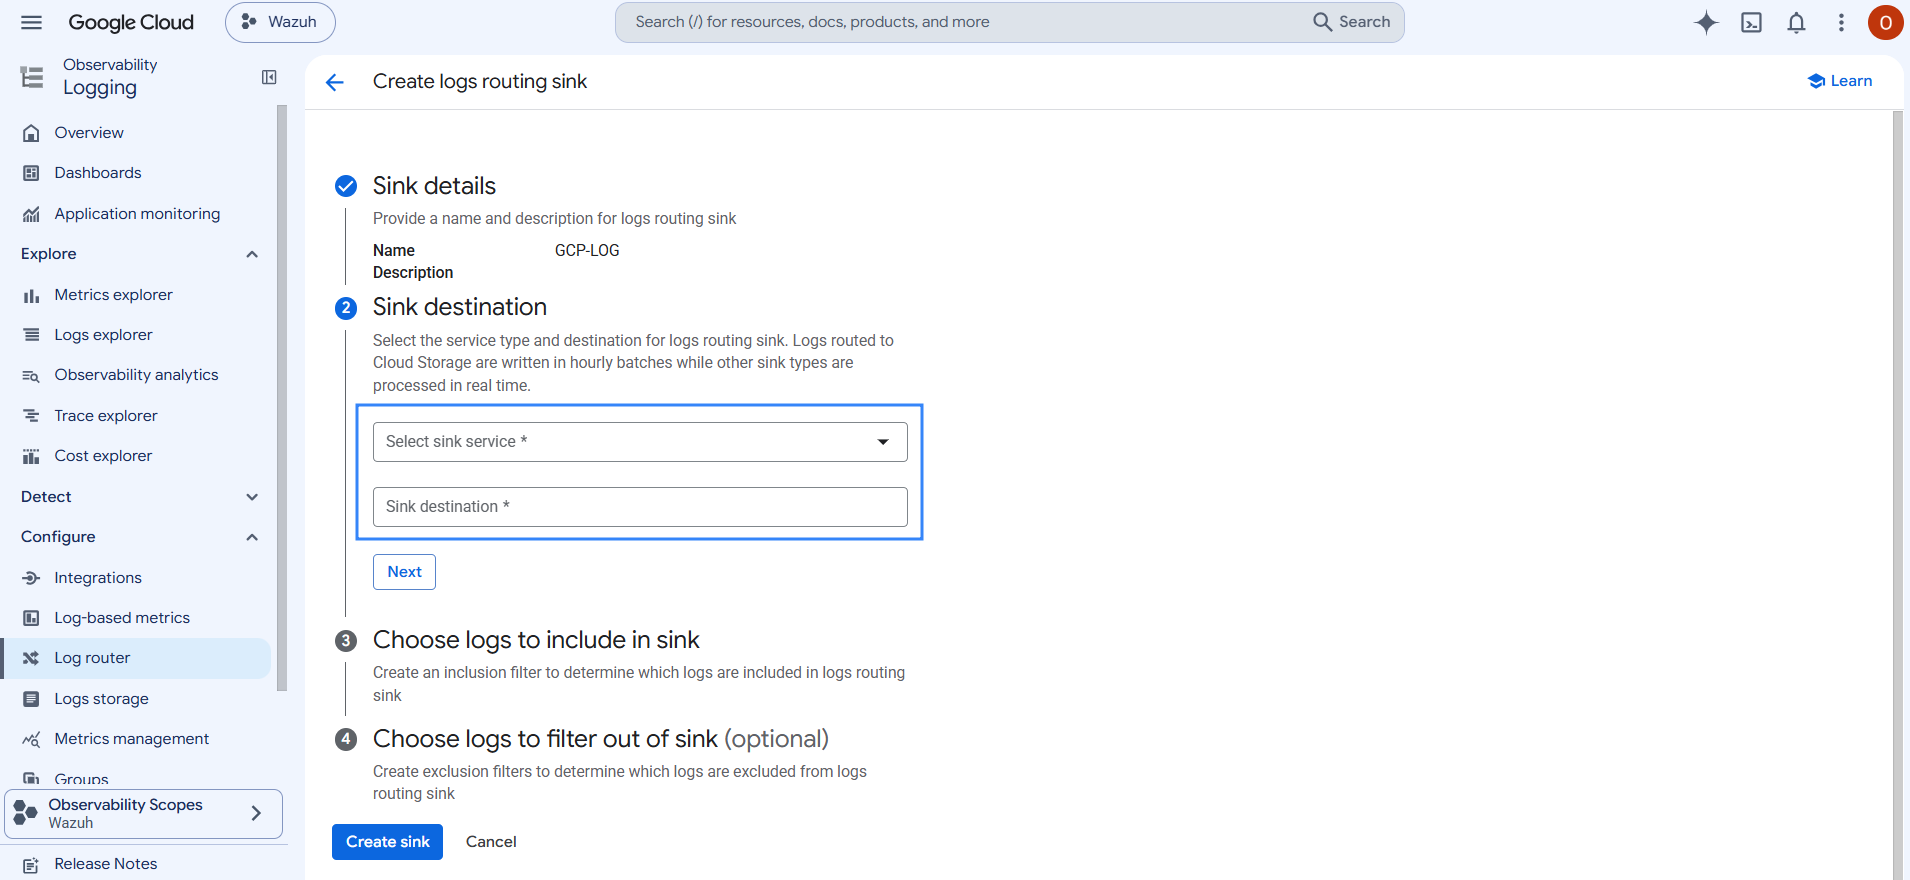
Select the sink service type and destination. Under Select sink service, select Cloud Pub/Sub topic, and then create or choose a topic to be used as a destination. Then click Next.
Create an inclusion filter to determine which logs are included. Add the following inclusion filter for the logs enabled in the previous section.
Log type
Inclusion filter
Cloud Audit Logs
logName:"cloudaudit.googleapis.com"VPC Flow Logs
resource.type="gce_subnetwork"Firewall rule logs
logName="projects/<YOUR_PROJECT_ID>/logs/compute.googleapis.com%2Ffirewall"DNS query logs
resource.type="dns_query"Note
Admin Activity audit logs are enabled by default for every Google Cloud service and cannot be turned off.
To enable multiple log types on the same sink, combine their inclusion filters using the
ORoperator.logName:"cloudaudit.googleapis.com" OR resource.type="gce_subnetwork" OR resource.type="dns_query" OR logName="projects/<YOUR_PROJECT_ID>/logs/compute.googleapis.com%2Ffirewall"
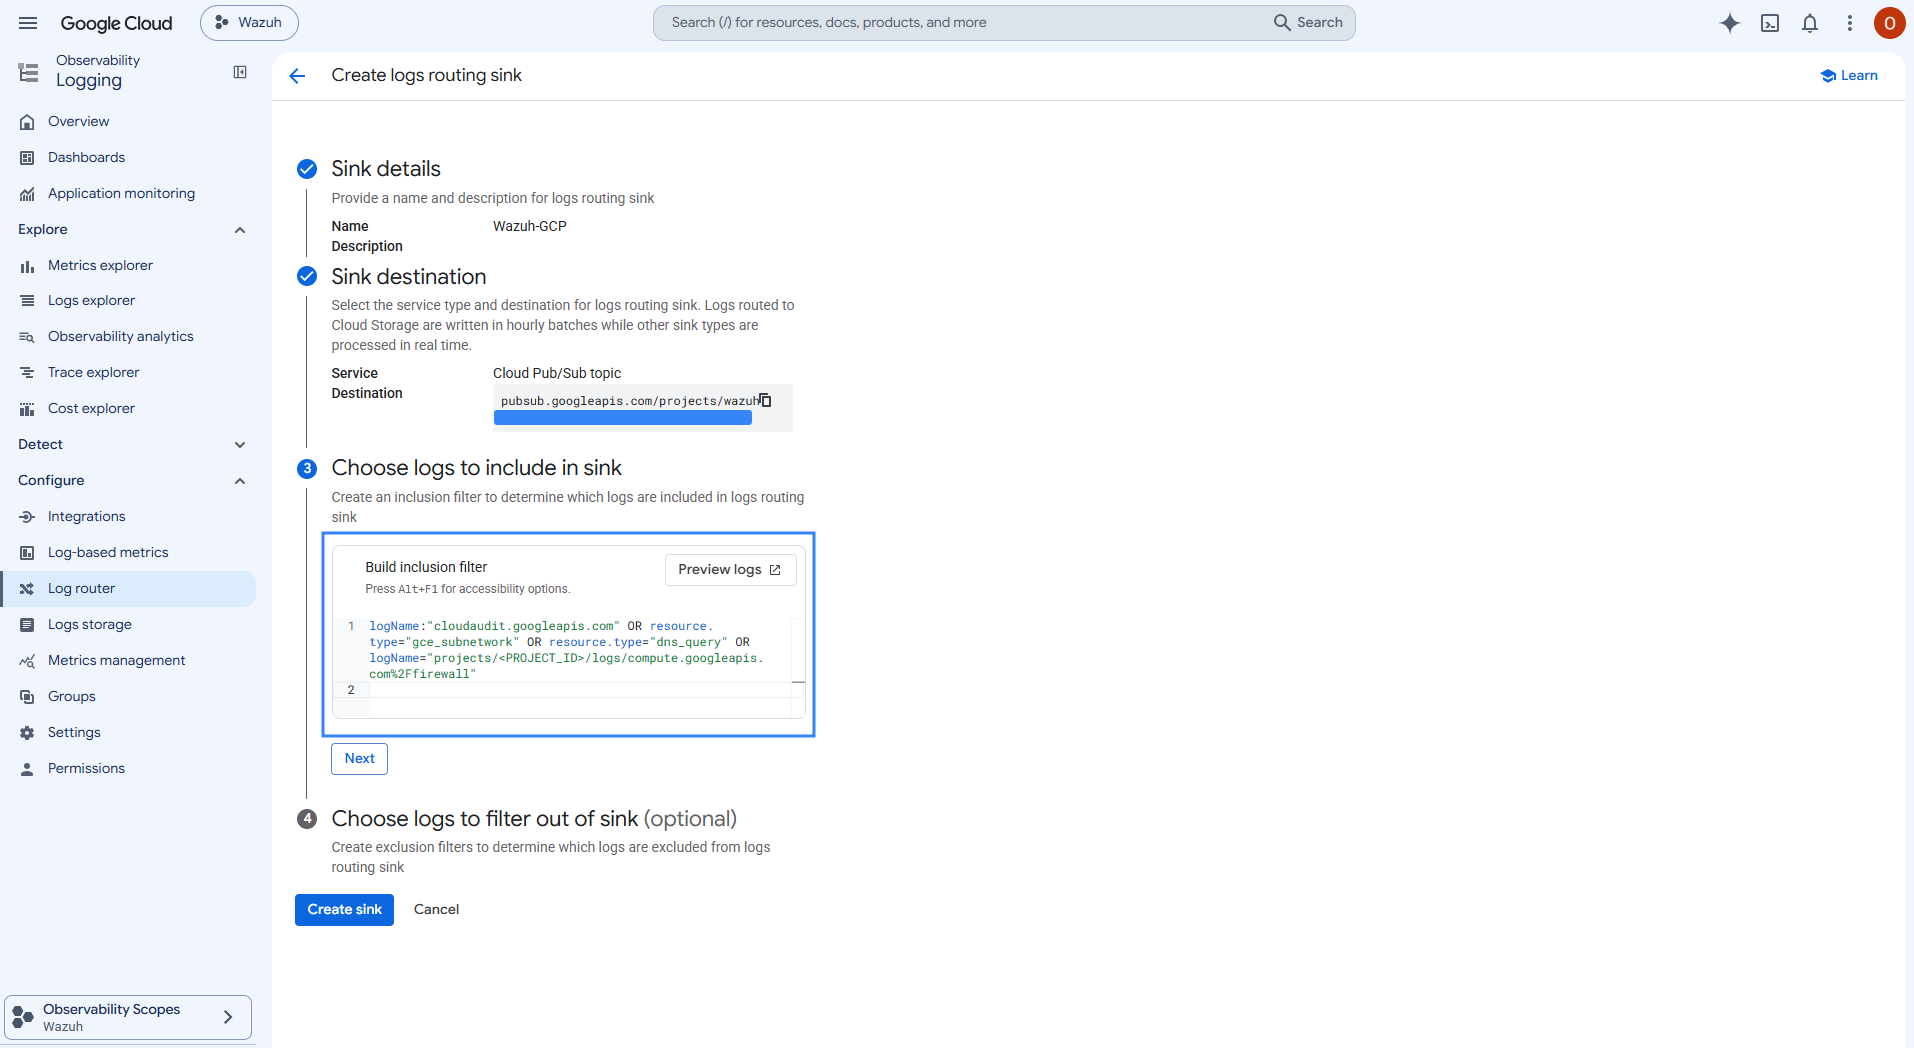
Click Create Sink.
Granting the sink permission to publish
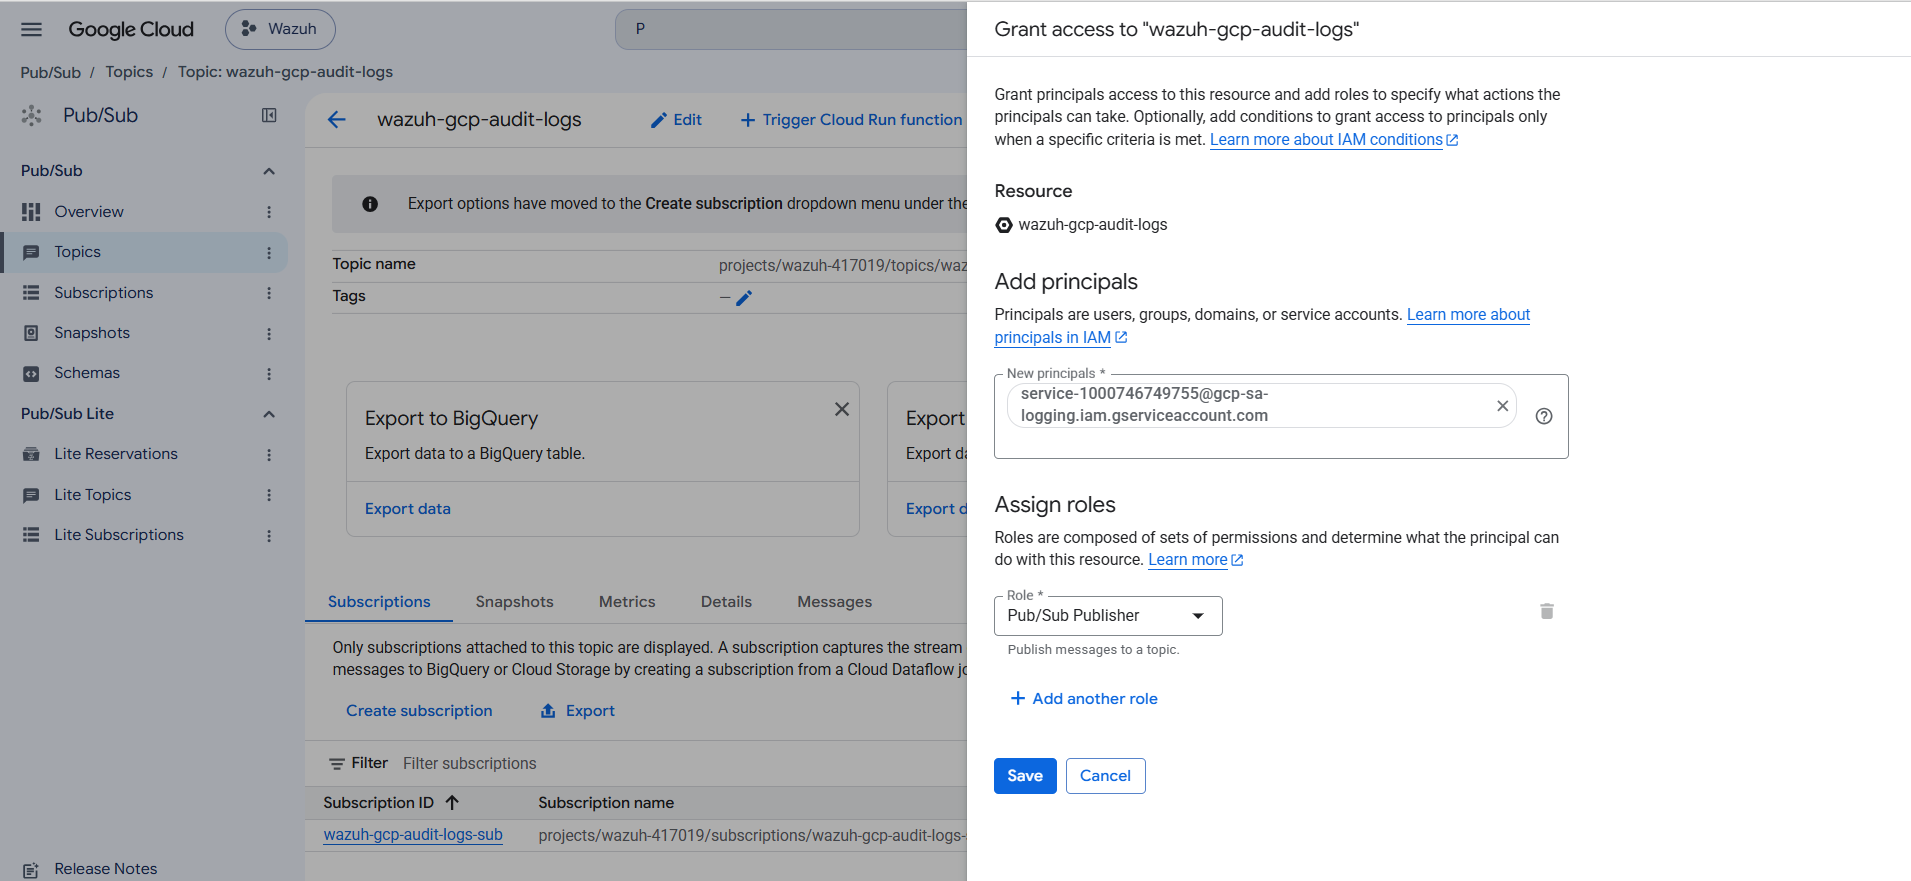
After creating the sink, Google Cloud provides a writer identity. Grant this identity permission to publish logs to the destination topic. In the Google Cloud console, navigate to Logging > Log Router and select the Sink to view the writer identity.
The writer identity is in the following format:
service-<PROJECT_NUMBER>@gcp-sa-logging.iam.gserviceaccount.com
Grant this identity permission to publish to the destination Pub/Sub topic:
Open the Pub/Sub topic used as the sink destination and click the Permissions tab.
Click Add Principal.
Enter the sink writer identity.
Assign the Pub/Sub Publisher role.
Click Save.
Configuring the Wazuh module for Google Cloud Pub/Sub
Follow the next steps to configure the Wazuh module for Google Cloud Pub/Sub on your Wazuh agent to access the Pub/Sub services.
Append the following configuration to the
/var/ossec/etc/ossec.confconfiguration file of your preferred endpoint:<ossec_config> <gcp-pubsub> <pull_on_start>yes</pull_on_start> <interval>1m</interval> <project_id><YOUR_PROJECT_ID></project_id> <subscription_name><YOUR_SUBSCRIPTION_ID></subscription_name> <credentials_file>/var/ossec/wodles/gcloud/<AUTHENTICATION_FILE_NAME>.json</credentials_file> </gcp-pubsub> </ossec_config>
Where:
<pull_on_start>: pulls logs when the Wazuh agent service starts or restarts. It is set toyesby default.<interval>: sets a time interval between module executions.<project_id>: represents your Google Cloud project ID and<YOUR_PROJECT_ID>represents your project ID.<subscription_name>: is the subscription name created for this topic, and<YOUR_SUBSCRIPTION_ID>is your subscription ID.<credentials_file>: is the path to the Google Cloud credentials file.<AUTHENTICATION_FILE_NAME>is the name of the Google Cloud credentials file. Ensure the JSON extension is present after the file. If you do not have credentials, follow the steps in the configuring Google Cloud credentials section.
Restart the Wazuh agent service to apply the changes:
# systemctl restart wazuh-agent
Visualizing Google Cloud events on the Wazuh dashboard
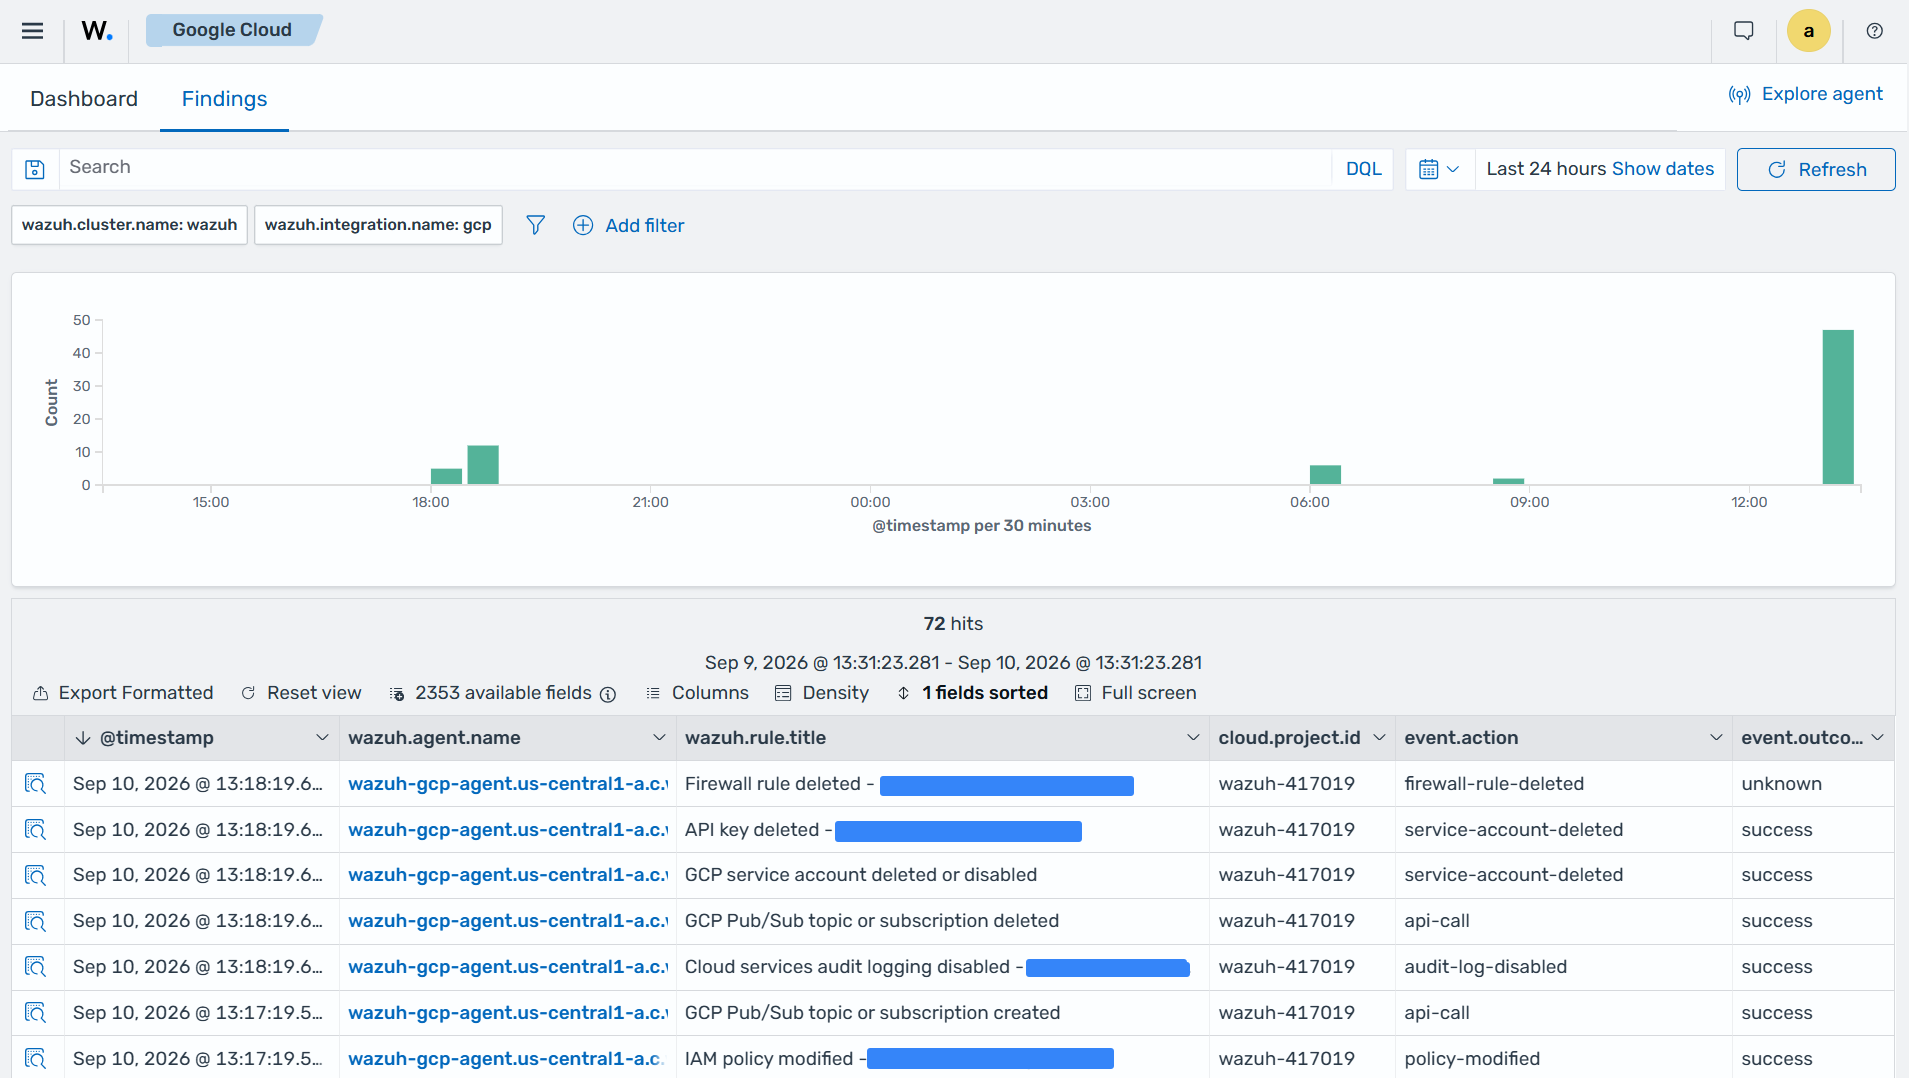
Navigate to Cloud Security > Google Cloud to view Google Cloud events and analytics on the Wazuh dashboard.
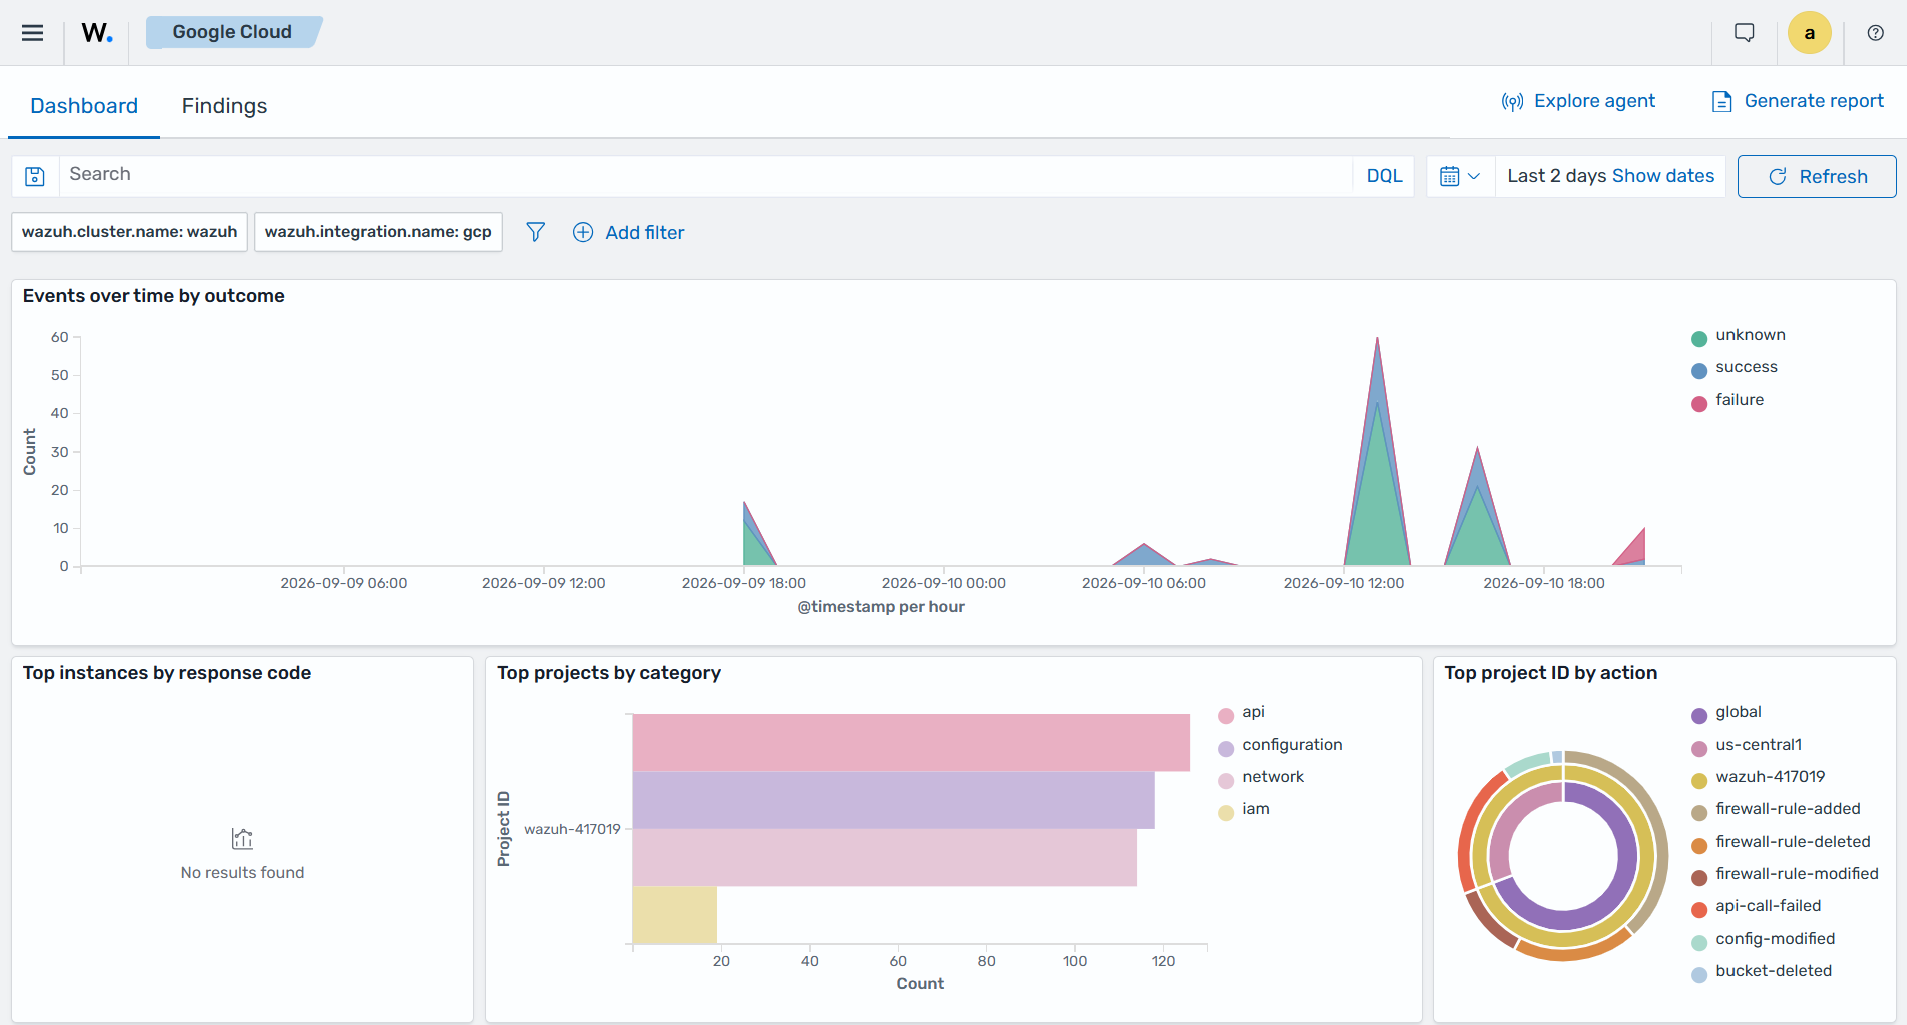
The Findings tab displays findings generated from Google Cloud events.