Use cases
The following use cases demonstrate how to configure Wazuh log collection for common endpoint and network monitoring scenarios, including Windows event monitoring, syslog relaying on Linux, and custom socket output on macOS.
Monitoring Sysmon events on a Windows endpoint
To monitor specific Windows event channels using the Wazuh agent, include the channel name in the location field and set the log format as eventchannel within the localfile block in the C:\Program Files (x86)\ossec-agent\ossec.conf file.
For example, perform the following steps to monitor Sysmon events using the Microsoft-Windows-Sysmon/Operational channel:
Download the latest version of Sysmon from the Microsoft Sysinternals page.
Extract the compressed Sysmon file to your preferred location.
> Expand-Archive "<PATH>\Sysmon.zip"
Replace
<PATH>with the directory where theSysmon.zipfile was downloaded.Download the Sysmon configuration file using PowerShell as an administrator. Replace
<SYSMON_EXECUTABLE_PATH>with the path to your Sysmon executable:> wget -Uri https://wazuh.com/resources/blog/emulation-of-attack-techniques-and-detection-with-wazuh/sysmonconfig.xml -OutFile <SYSMON_EXECUTABLE_PATH>\sysmonconfig.xml
Switch to the folder containing the Sysmon executable. Run the command below to install and start Sysmon:
> .\Sysmon64.exe -accepteula -i sysmonconfig.xml
If you are on ARM64, use:
> .\Sysmon64a.exe -accepteula -i sysmonconfig.xml
Add the following configuration between the
<ossec_config>tags of the Wazuh agentC:\Program Files (x86)\ossec-agent\ossec.conffile:<localfile> <location>Microsoft-Windows-Sysmon/Operational</location> <log_format>eventchannel</log_format> </localfile>
Restart the Wazuh agent via PowerShell with administrator privileges to apply the configuration change:
> Restart-Service -Name wazuh
Trigger a Sysmon event
Trigger a Sysmon event by launching
whoami.exe:> C:\Windows\System32\whoami.exe
Visualize the event
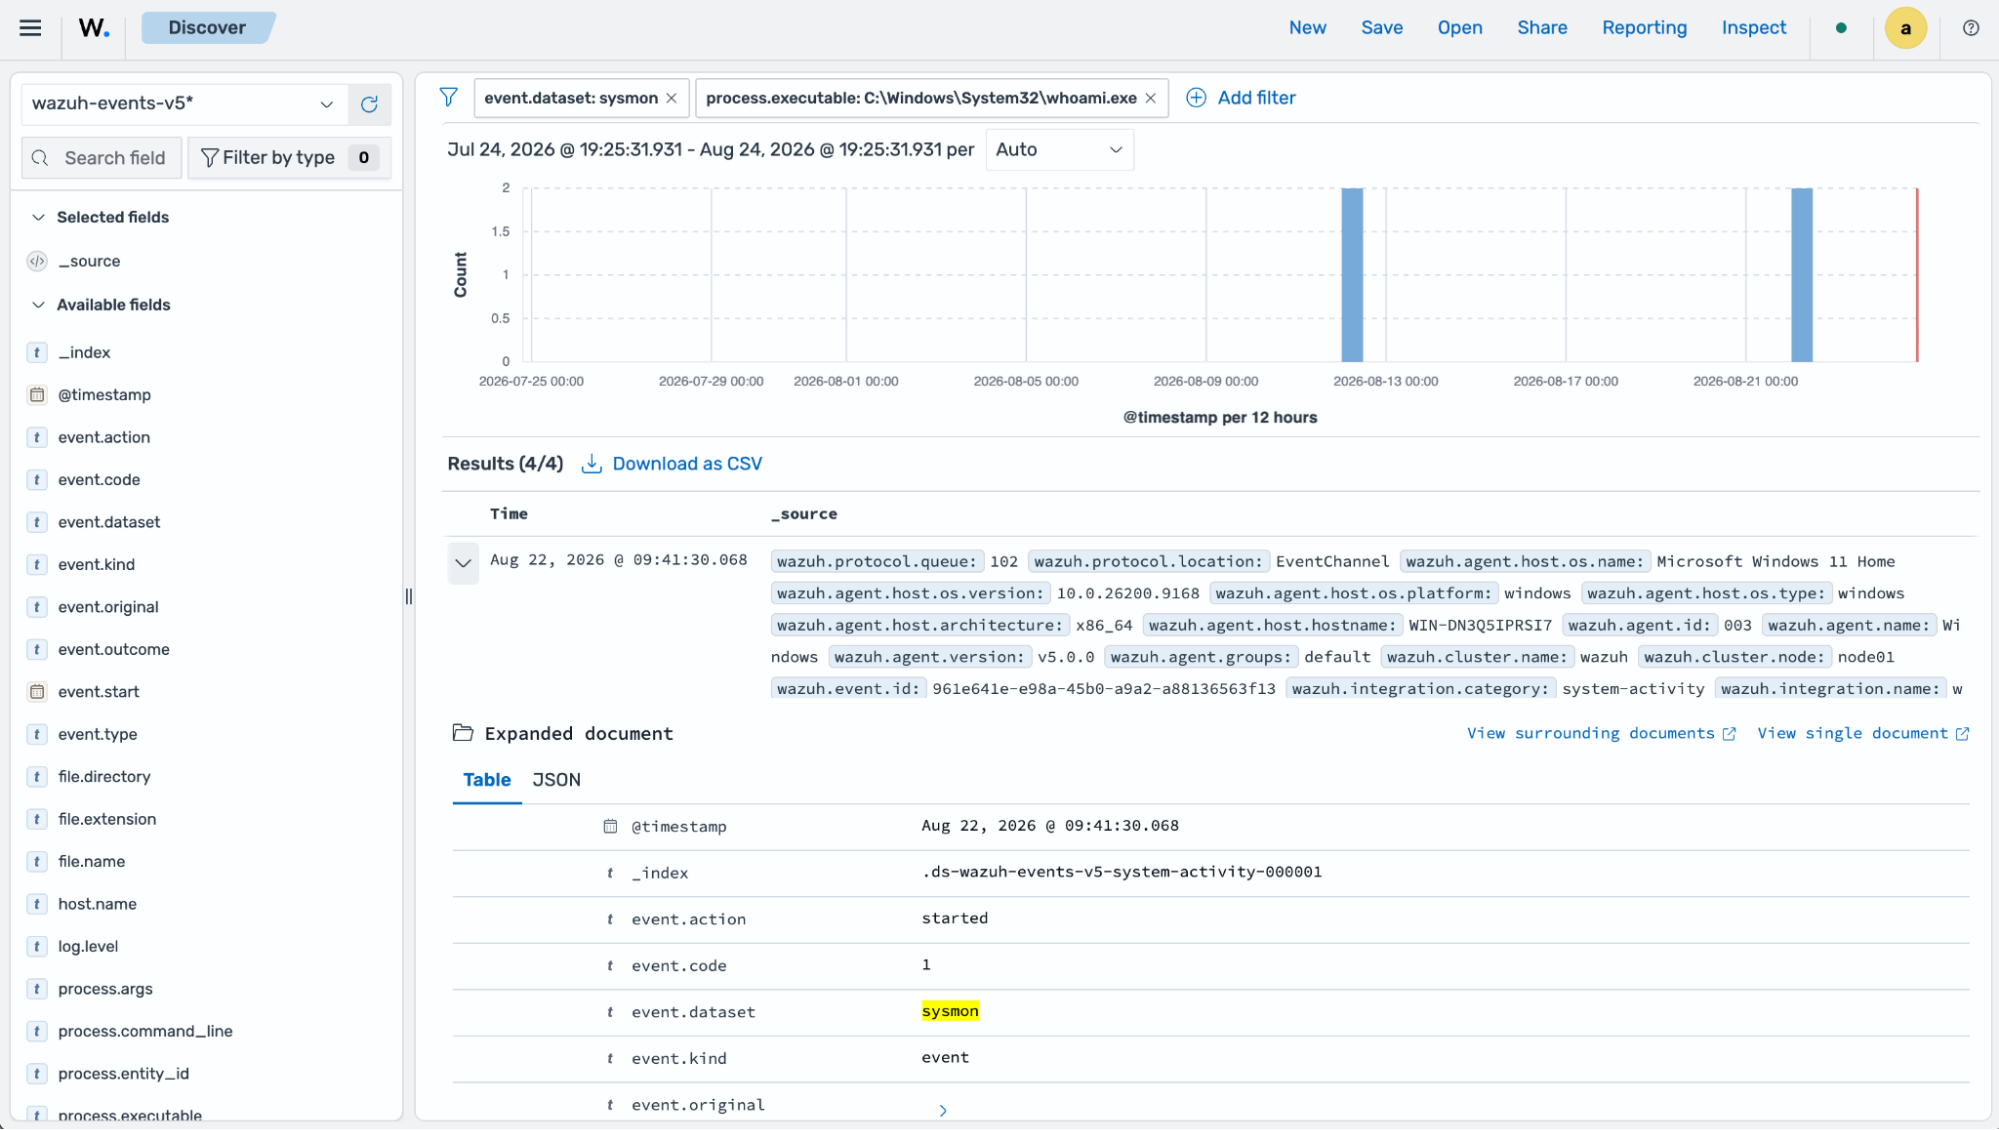
Navigate to Explore > Discover and filter on the event:
Where
event.datasetissysmonprocess.executableisC:\Windows\System32\whoami.exe
Configuring rsyslog on a Linux endpoint
Note
The Wazuh manager no longer accepts syslog events directly. To collect syslog from the network, configure rsyslog on a Linux endpoint with a Wazuh agent installed, write incoming messages to a log file, and monitor that file with the Logcollector module. The Wazuh manager has out-of-the-box decoders and rules to extract and analyze relevant fields from Linux events. You can create custom decoders and rules to parse and analyze Linux events.
Follow the steps below to configure a monitored Linux endpoint as an rsyslog relay and forward the received messages to the Wazuh manager:
Install rsyslog:
$ sudo apt update
$ sudo apt install rsyslog -y
Enable and start the rsyslog service:
$ sudo systemctl enable rsyslog
$ sudo systemctl start rsyslog
Create a dedicated configuration file
/etc/rsyslog.d/10-remote.confwith the following content.module(load="imudp") input(type="imudp" port="514" ruleset="remote") template(name="TraditionalSyslogFormat" type="string" string="%timegenerated% %HOSTNAME% %syslogtag%%msg:::sp-if-no-1st-sp%%msg%\n") ruleset(name="remote") { action(type="omfile" file="/var/log/remote.log" template="TraditionalSyslogFormat") stop }Create the destination log:
$ sudo touch /var/log/remote.log
$ sudo chown syslog:adm /var/log/remote.log
$ sudo chmod 640 /var/log/remote.log
Validate the configuration
$ sudo rsyslogd -N1
Restart rsyslog:
$ sudo systemctl restart rsyslog
Verify rsyslog is listening on port 514:
$ sudo ss -lun | grep 514
The command output looks similar to this:
UNCONN 0      0            0.0.0.0:514        0.0.0.0:*
UNCONN 0      0               [::]:514           [::]:*
Allow inbound UDP traffic on port 514 from your network devices at every point in the path: the host firewall (if enabled, for example
ufw), and any cloud security group, network ACL, or upstream firewall in front of the relay. Confirm the relay is receiving before moving on:$ sudo ufw allow from <NETWORK_CIDR> to any port 514 proto udp
Ensure you replace
<NETWORK_CIDR>with your specified network CIDR.Configure the Wazuh agent to monitor that rsyslog output file using the Logcollector module:
<localfile>
  <location>/var/log/remote.log</location>
  <log_format>syslog</log_format>
</localfile>
Restart the Wazuh agent.
$ sudo systemctl restart wazuh-agent
Test log injection from an rsyslog client
Perform the following steps from another Linux endpoint on the same network as the rsyslog relay:
Send a test message directly to the relay IP address with the
loggercommand:$ logger -n <RSYSLOG_SERVER_IP> -P 514 -d "TEST-RSYSLOG direct to remote.log from a monitored Wazuh agent"
Visualize the event
Navigate to the Explore > Discover page on the Wazuh dashboard and use the filter to view the log:
Where:
wazuh.protocol.locationis/var/log/remote.log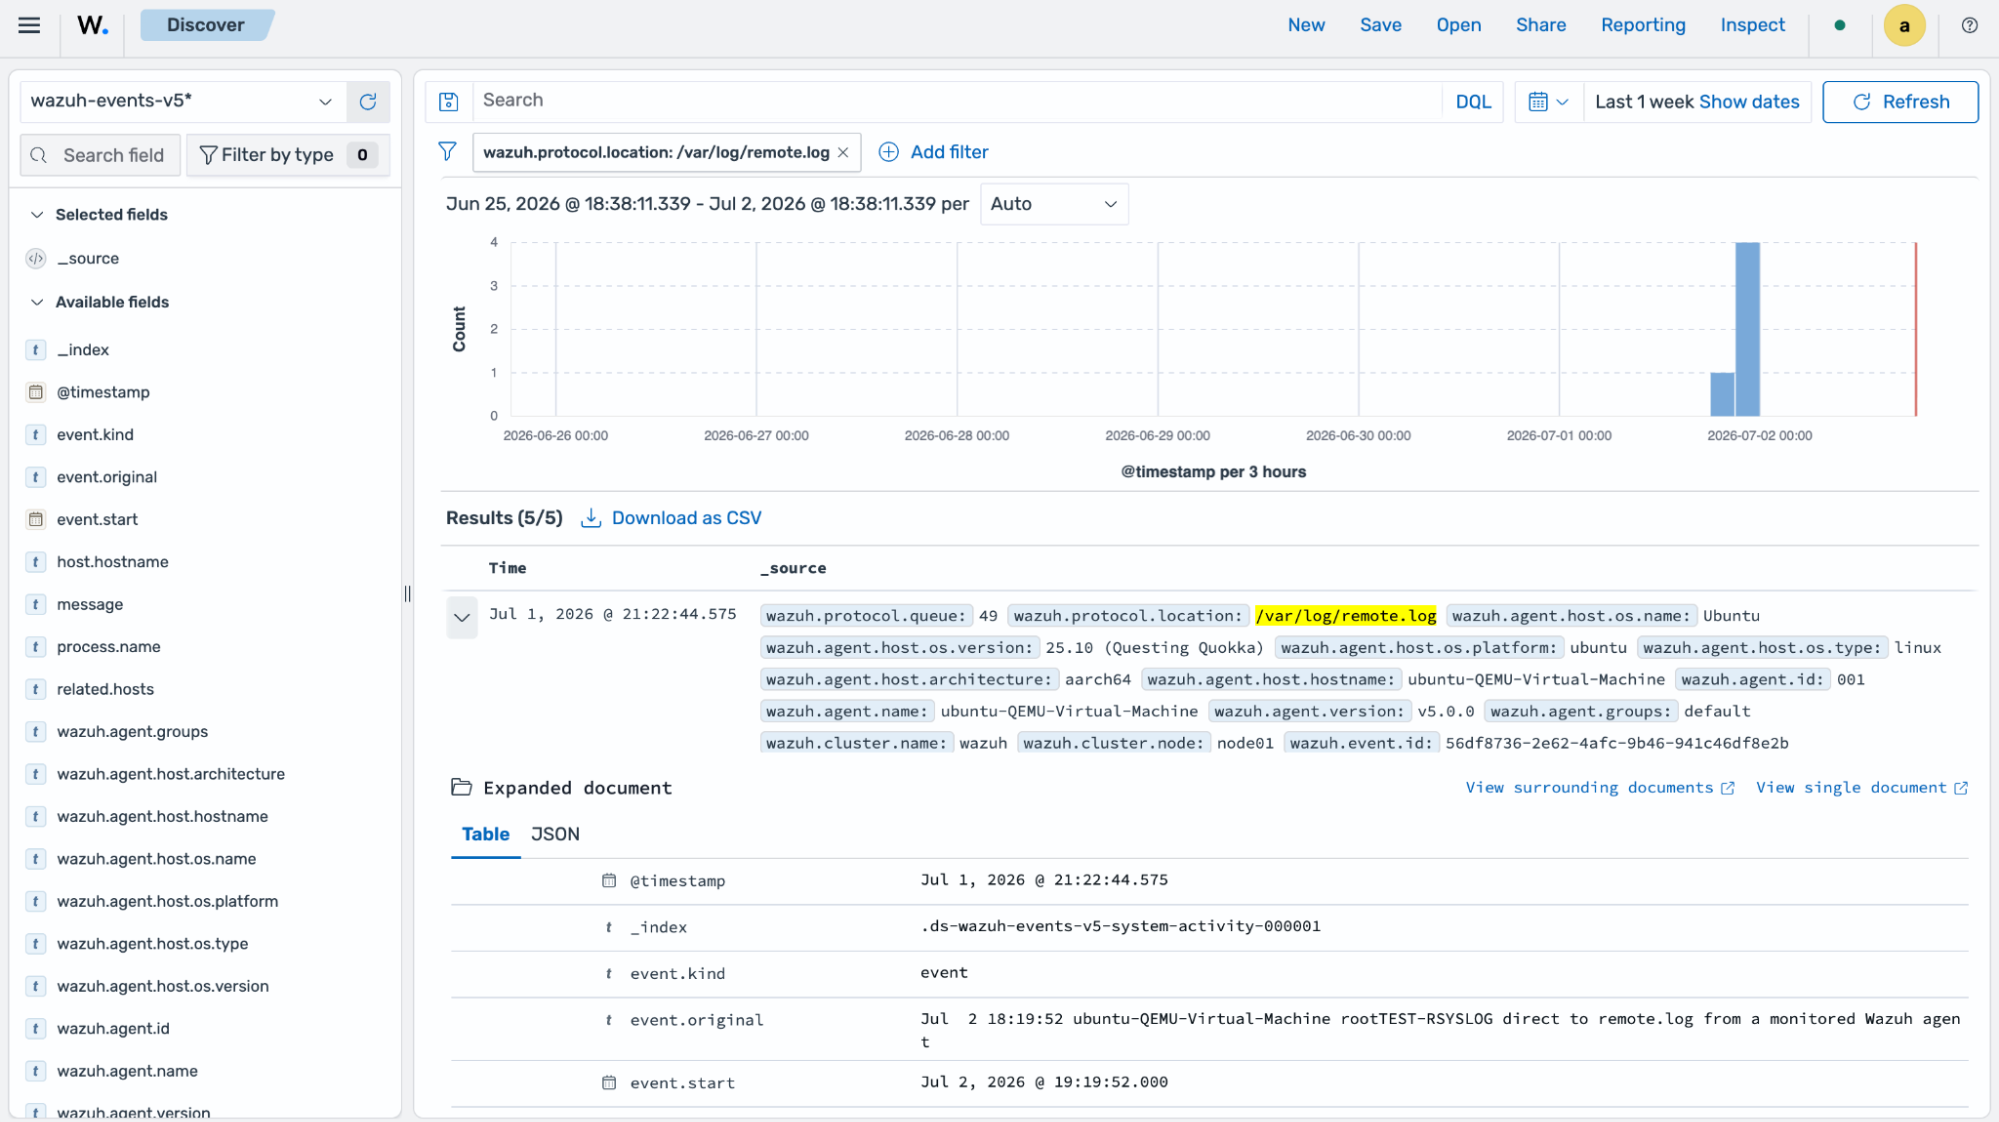
Configuring a custom socket output on a macOS endpoint
Perform the following steps on the monitored macOS endpoint to create a new output socket, forward logs to it, and confirm delivery end-to-end.
Create the receiving socket with netcat before adding it to the Wazuh configuration:
$ sudo nohup nc -lkU /var/run/custom.sock > /tmp/custom_socket_capture.log 2>&1 &
Create the log file that will be forwarded to the socket:
$ sudo touch /var/log/socket-test.log
$ sudo chmod 644 /var/log/socket-test.log
Add the following configuration between the
<ossec_config>tags of the Wazuh agent/Library/Ossec/etc/ossec.conffile to add a new socket namedcustom_socket:<socket> <name>custom_socket</name> <location>/var/run/custom.sock</location> <mode>tcp</mode> <prefix>custom_syslog: </prefix> </socket>
Add the following to the agent configuration file to forward logs from
socket-test.logtocustom_socket:<localfile> <log_format>syslog</log_format> <location>/var/log/socket-test.log</location> <target>agent,custom_socket</target> </localfile>
Restart the Wazuh agent with administrator privileges to apply the configuration change:
$ sudo /Library/Ossec/bin/wazuh-control restart
Test log forwarding to the custom socket (macOS)
Perform the following steps on the same monitored endpoint:
Inject a distinctive test line into the monitored file:
$ echo "TEST-SOCKET forwarding to custom_socket from a monitored Wazuh agent (macOS)" | sudo tee -a /var/log/socket-test.log
Confirm the socket receiver captured the forwarded message:
$ cat /tmp/custom_socket_capture.log
The command output looks similar to this:
custom_syslog: TEST-SOCKET forwarding to custom_socket from a monitored Wazuh agent (macOS)
Verify that the agent shows an established connection to the socket at the moment it forwards a log line:
$ sudo lsof -U | grep custom.sock
The command output looks similar to this:
nc           1234 root    3u  unix 0x0000000000000000      0t0      - /var/run/custom.sock
wazuh-agentd 5678 root   12u  unix 0x0000000000000000      0t0      - /var/run/custom.sock
The
custom_syslogprefix confirms the<prefix>tag applied, and the secondlsofline confirms the agent (not just thenclistener) held a connection tocustom_socketat write time.
Visualize the event
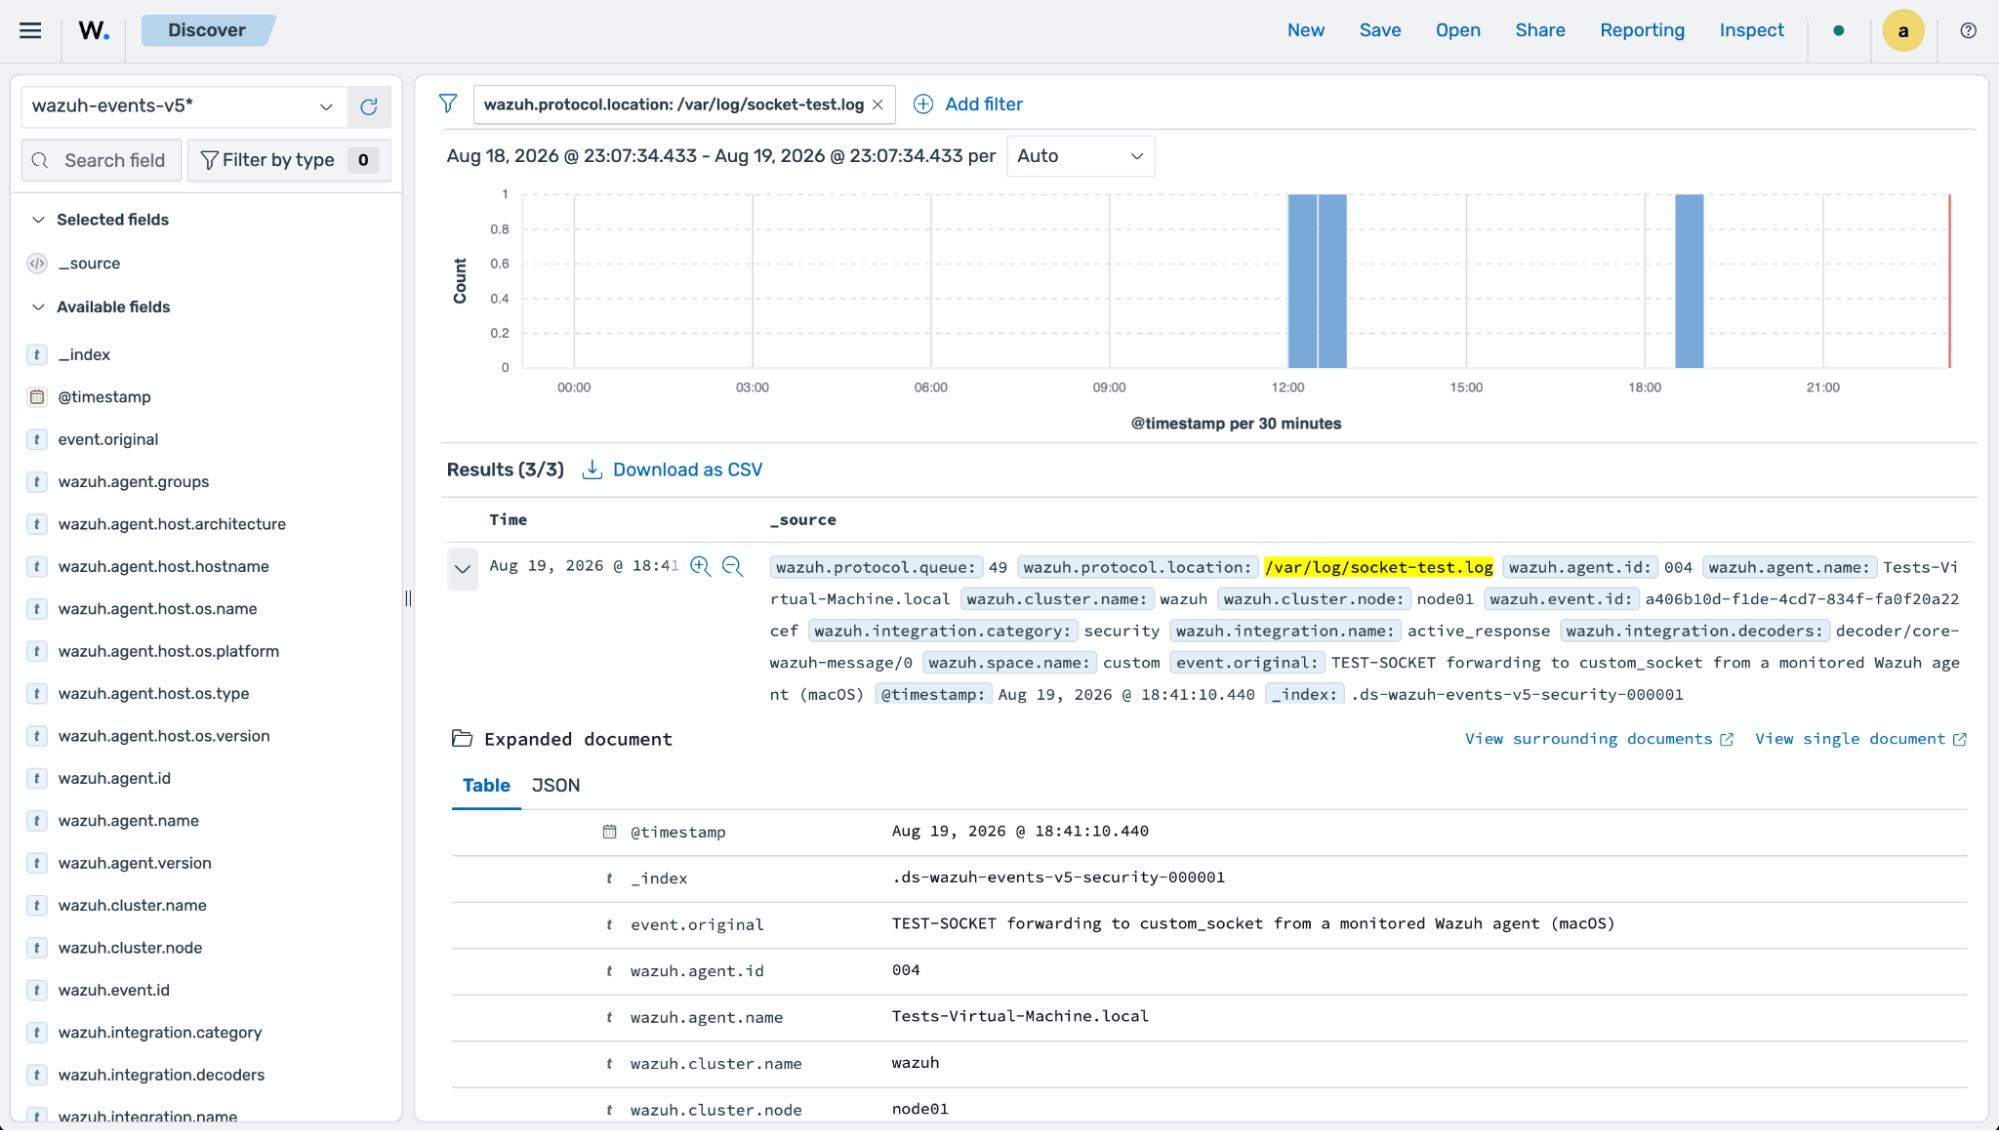
Navigate to the Explore > Discover page on the Wazuh dashboard and use the filter to view the monitored log file:
Where:
wazuh.protocol.locationis/var/log/socket-test.log