Use cases
In this section, we explore how to use the Wazuh module for Pub/Sub to collect and monitor different types of logs from your Google Cloud environment, such as cloud audit logs, DNS queries, VPC Flow Logs, Firewall Rules Logging, and HTTP(S) load balancing.
Cloud audit logs
Google Cloud provides four types of audit logs for each project, folder, and organization in your environment:
Admin Activity audit logs contain log entries for API calls or other administrative actions that modify the configuration or metadata of resources. This is useful for tracking administrative activities and changes made to the configuration of resources.
Data Access audit logs contain API calls that read the configuration or metadata of resources and user-driven API calls that create, modify, or read user-provided resource data. This is valuable for monitoring access to data, including who is reading or modifying resource configurations and user-provided data.
System Event audit logs contain log entries for Google Cloud administrative actions that modify the configuration of resources. The Google system generates these audit logs, which helps track system-level administrative actions that impact the configuration of resources.
Policy Denied audit logs are recorded when a Google Cloud service denies access to a user or service account because of a security policy violation.
These audit logs provide a comprehensive view of activities and events within a Google Cloud environment, supporting security, compliance, and operational needs.
Configuring Google Cloud audit logs collection
To collect Google Cloud audit logs, it is necessary to first ingest the audit logs into a Pub/Sub topic defining a custom log router.
Note
Before you perform the steps below make sure that you have already configured the Google Cloud Pub/Sub integration and the Wazuh module for Google Cloud Pub/Sub.
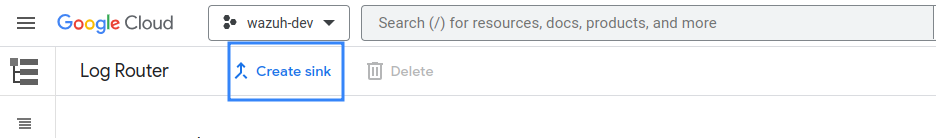
Visit the Google Cloud Logging section and click on Create sink.
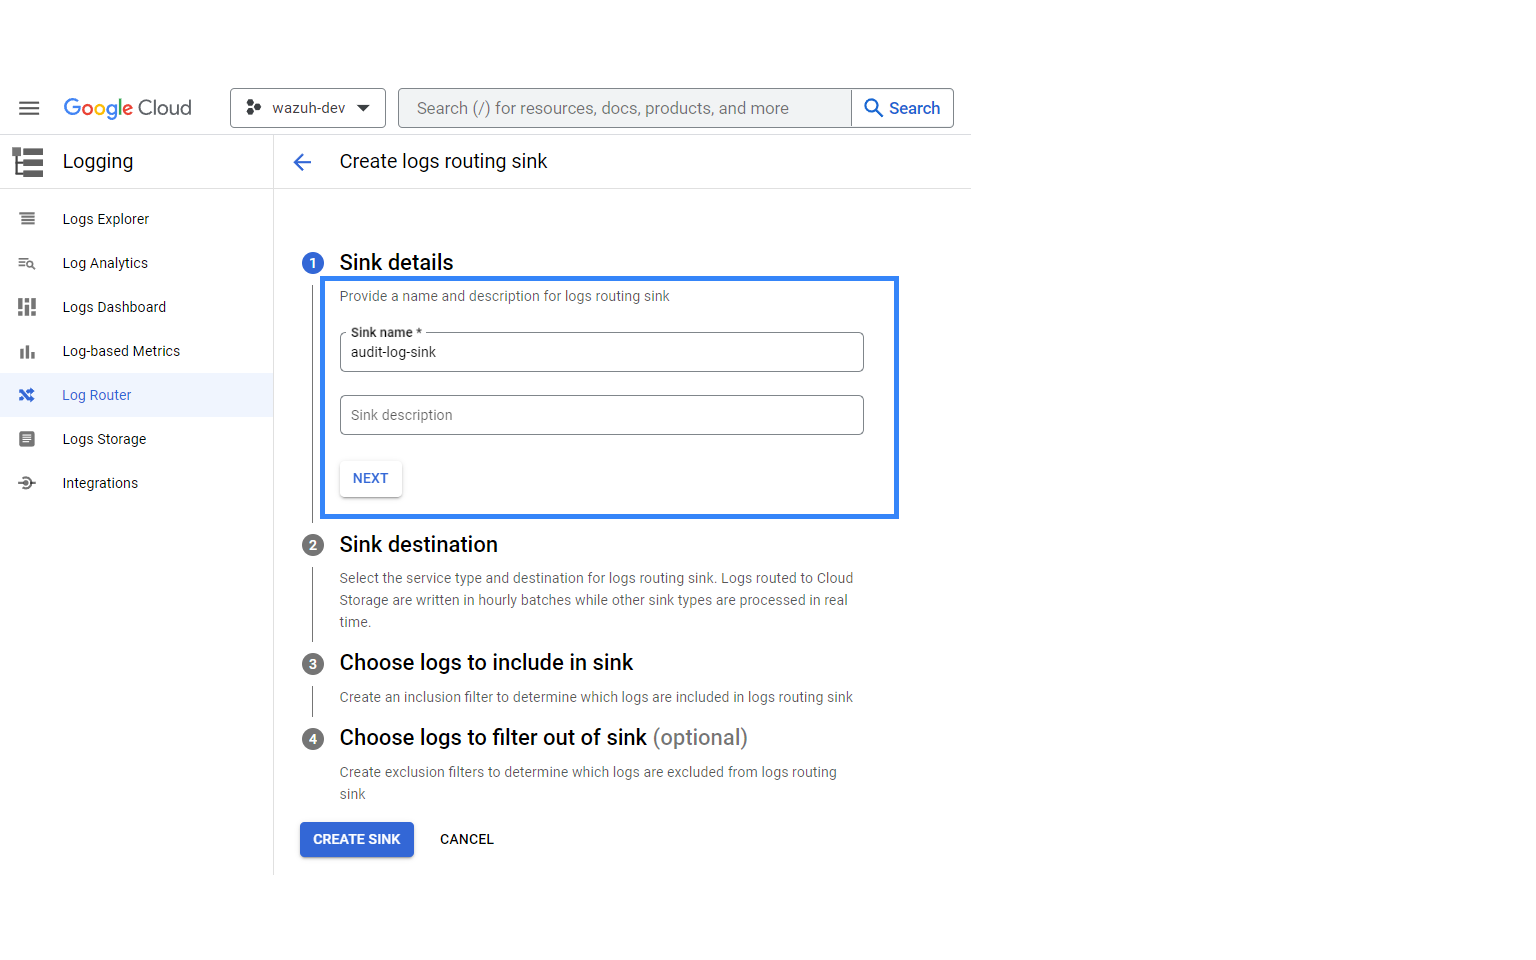
Provide a descriptive name for the sink and click on NEXT.
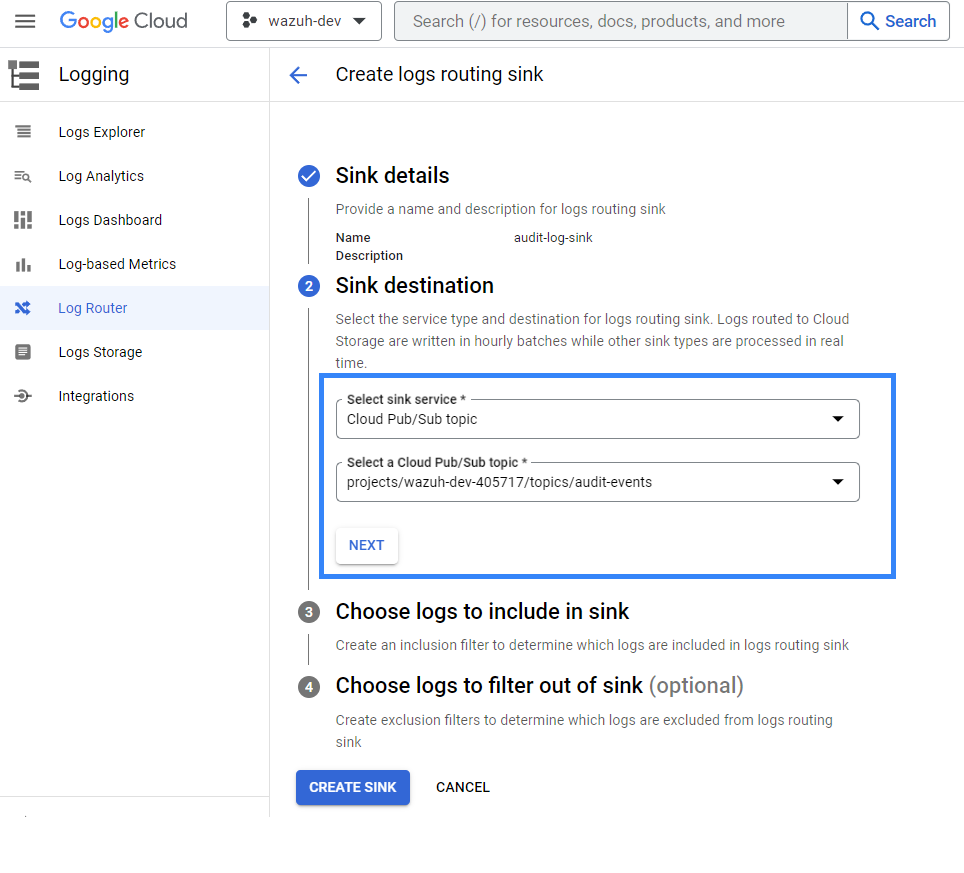
You need to select the sink destination after providing the name of the sink. Under Select sink service, select Cloud Pub/Sub topic, and then create or choose a topic to be used as a destination. Then click on NEXT.
Under Choose logs to include in sink, use the following query to collect all the audit logs from every project. It is possible to edit it to only collect audit logs from a particular project:
logName=~("projects/.*/logs/cloudaudit.googleapis.com%2F(activity|data_access|system_event|policy)")If it is not necessary to filter any logs out of the sink, click on CREATE SINK.
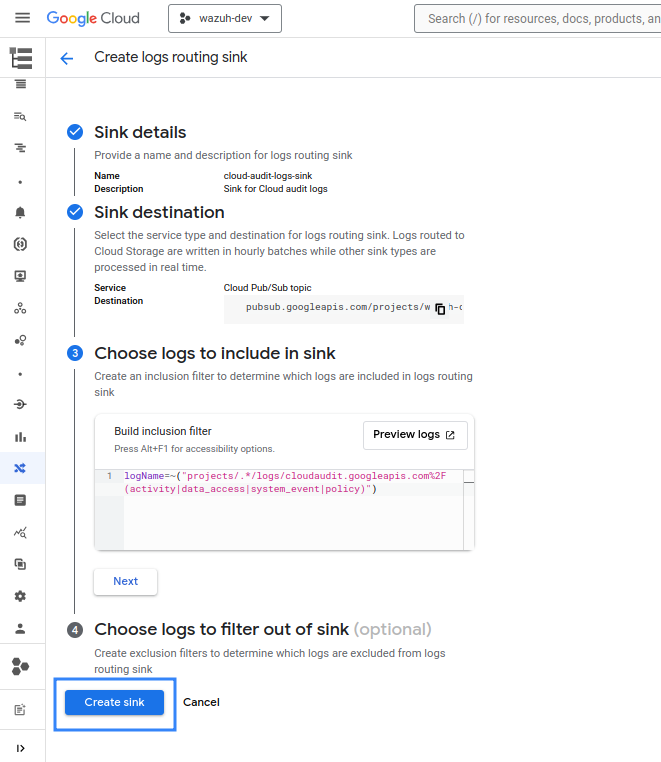
Once this process is finished, you can configure the Wazuh module for Google Cloud Pub/Sub to process the audit logs of the selected resources as usual.
Visualizing the events on the Wazuh dashboard
After configuring the Wazuh Google Cloud Pub/Sub module to fetch the audit logs from Google Cloud, it is possible to visualize the alerts generated in the Wazuh dashboard.
Set the operator for data.gcp.logName field to exists.
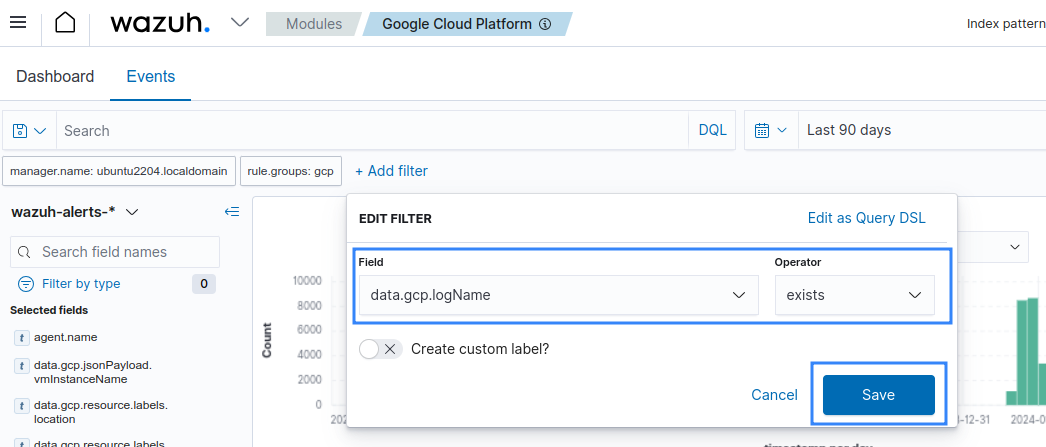
Available logs must appear as shown in the picture below.
Visit the Google Cloud documentation to learn more about the different Google services capable of writing audit logs.
DNS queries
Wazuh has default rules for DNS queries made to a private DNS handled by the Google Cloud DNS service. Those logs can be collected using the Wazuh module for Google Cloud Pub/Sub. Details on how to configure the module can be found in the gcp-pubsub configuration reference.
Note
Before you perform the steps below make sure that you have already configured the Google Cloud Pub/Sub integration and the Wazuh module for Google Cloud Pub/Sub.
Configuring Google DNS logs collection
To collect the DNS queries made to the Google DNS service, we use DNS policies to enable or disable logging for your networks. When you enable query logging, every DNS query to a Cloud DNS private managed zone is logged.
On Google Cloud Console, click the Shell button to activate Cloud Shell and authenticate your Google Cloud SDK.

Enable logging:
To enable logging for a network that does not have a DNS policy, run the
dns policies createcommand:gcloud dns policies create <POLICY_NAME> --networks=<NETWORK_NAME> --enable-logging --description=<DESCRIPTION>
Where:
<POLICY_NAME>: Contains the name of the DNS policy<NETWORK>: One or more networks in a comma-separated list<DESCRIPTION>: A description of the policy
Example:
$ gcloud dns policies create enable-dns-logging --enable-logging --description="Enable DNS logging" --networks=wazuh-dev-net
To enable logging for a network that has an existing DNS policy, run the
dns policies updatecommand:gcloud dns policies update <POLICY_NAME> --networks=<NETWORK_NAME> --enable-logging
Where:
<POLICY_NAME>: Takes the name of the DNS policy<NETWORK>: one or more networks in a comma-separated list
Example:
$ gcloud dns policies update enable-dns-logging --enable-logging --networks=wazuh-dev-net
Exporting DNS queries logs to Pub/Sub
Once DNS Cloud logging is configured, the generated logs must be ingested into a Pub/Sub topic so that Wazuh can collect them using the Google Pub/Sub integration. To achieve that, it is necessary to define a custom log router.
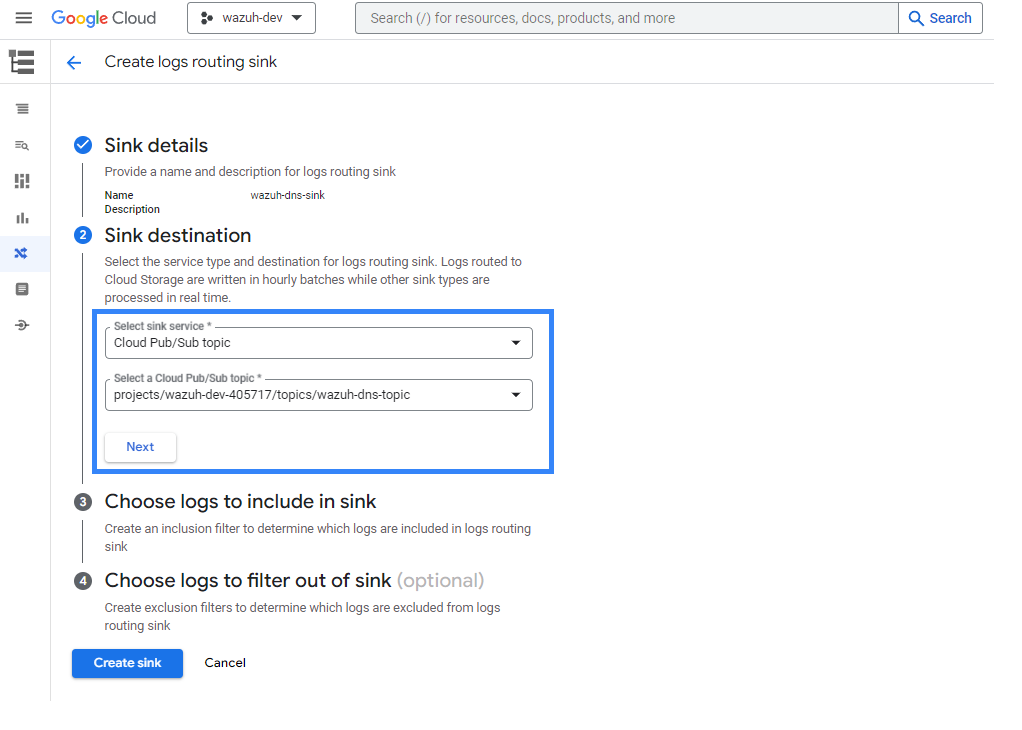
Visit the Google Cloud Logging section and click on CREATE SINK.
Provide a descriptive name for the sink and click on NEXT.
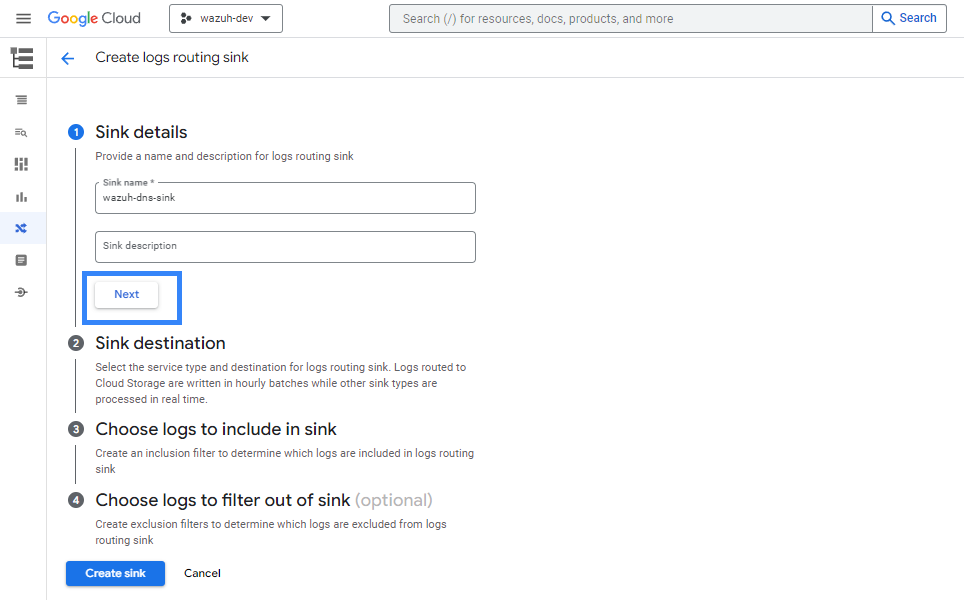
Once the name for the sink is chosen, it is necessary to select the sink destination. As a sink service, choose Cloud Pub/Sub topic, and then create or choose a topic to be used as a destination. Then click on NEXT.
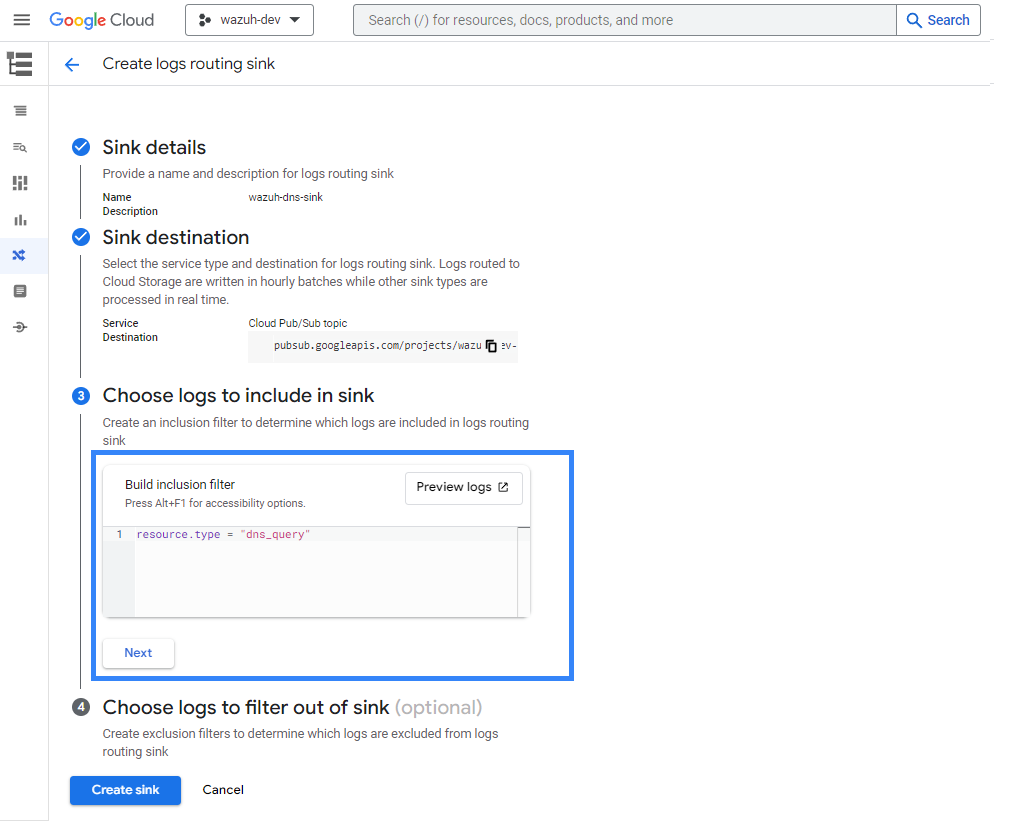
Use the following query to collect all the DNS queries:
resource.type = "dns_query"
If it is not necessary to filter any logs out of the sink, click on Create sink.
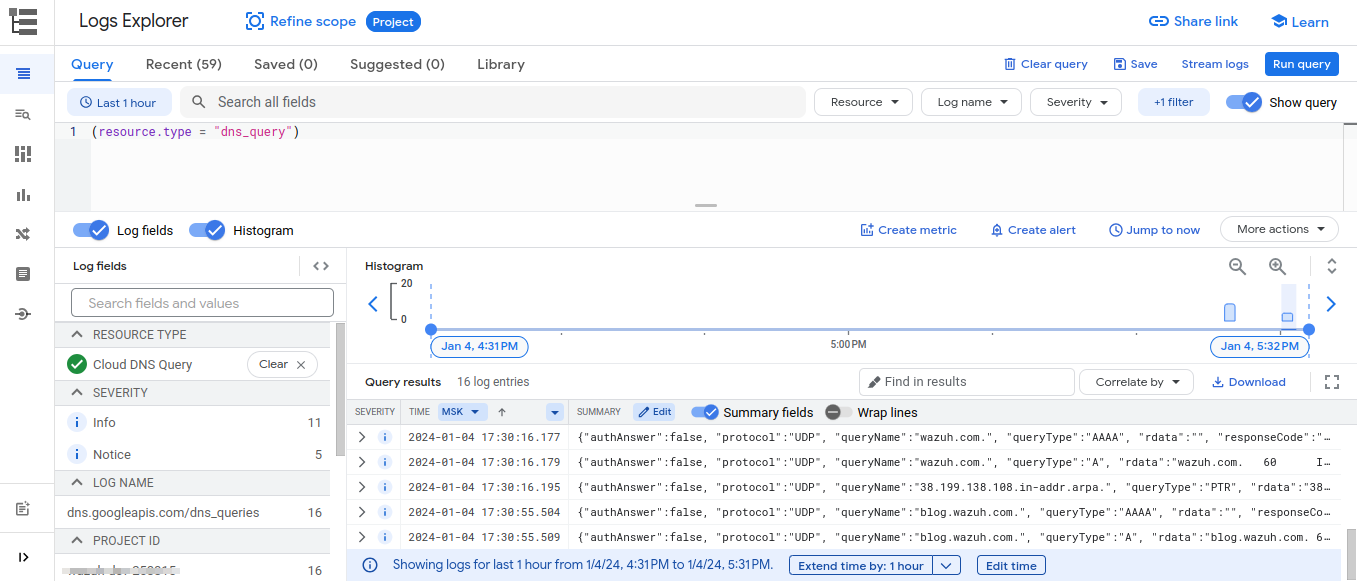
You can confirm that logs are generated in your environment by running the query in the Logs Explorer, as shown in the picture below.
Visualizing the events on the Wazuh dashboard
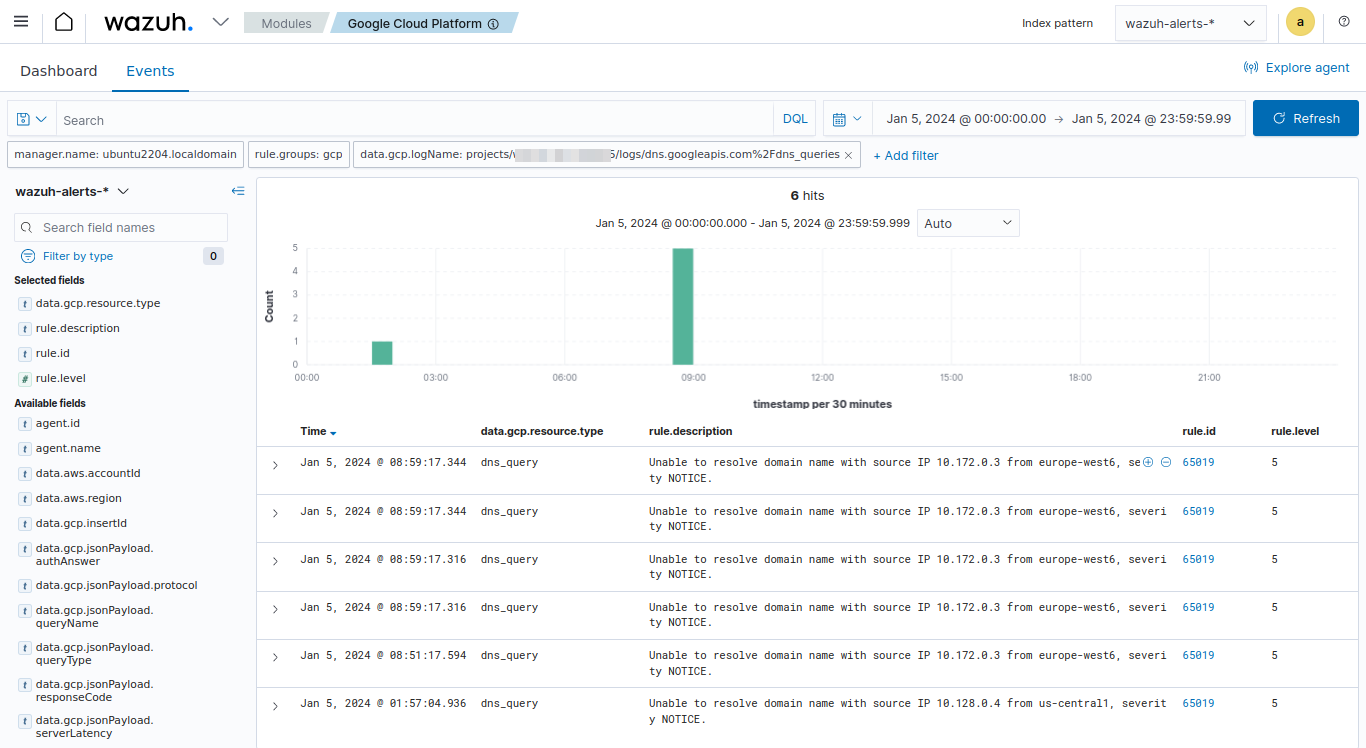
Once you configure the sink, apply the filter below on the Google Cloud module of the Wazuh dashboard to filter for DNS queries logs.
Set the value of data.gcp.logName field to projects/<YOUR_PROJECT_ID>/logs/compute.googleapis.com%2Fdns_queries.
Replace <YOUR_PROJECT_ID> with your project ID on Google Cloud.
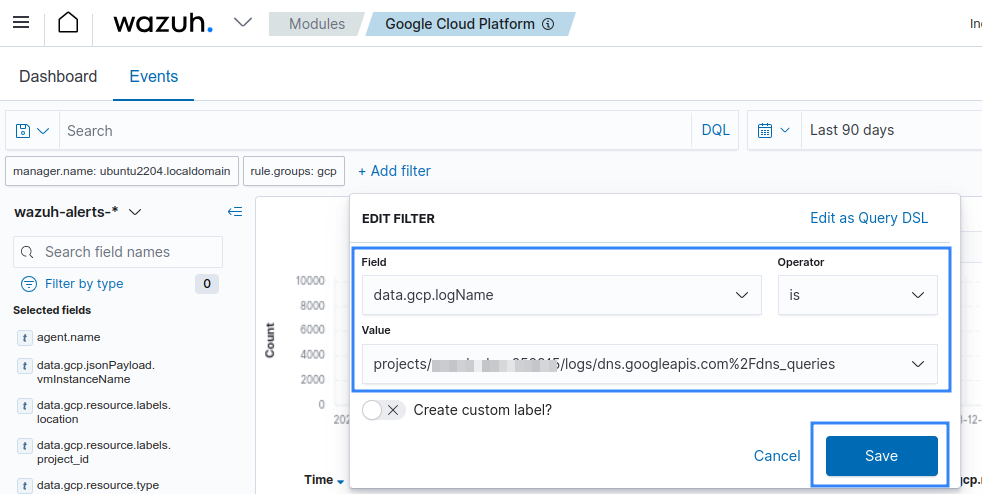
Available logs must appear as shown in the picture below.
VPC Flow Logs
VPC Flow Logs record a sample of network flows sent from and received by VM instances, including instances used as Google Kubernetes Engine nodes. VPC Flow Logs are aggregated by the connection from Compute Engine VMs and exported in real-time.
Note
Before you perform the steps below make sure that you have already configured the Google Cloud Pub/Sub integration and the Wazuh module for Google Cloud Pub/Sub.
Enabling VPC Flow Logs
VPC Flow Logs can be enabled on the VPC networks page in the Google Cloud Console. They can be enabled for both new and existing subnets. Follow the Google Virtual Private Cloud documentation for the most up-to-date instructions on how to enable this feature.
Exporting VPC Flow Logs to Pub/Sub
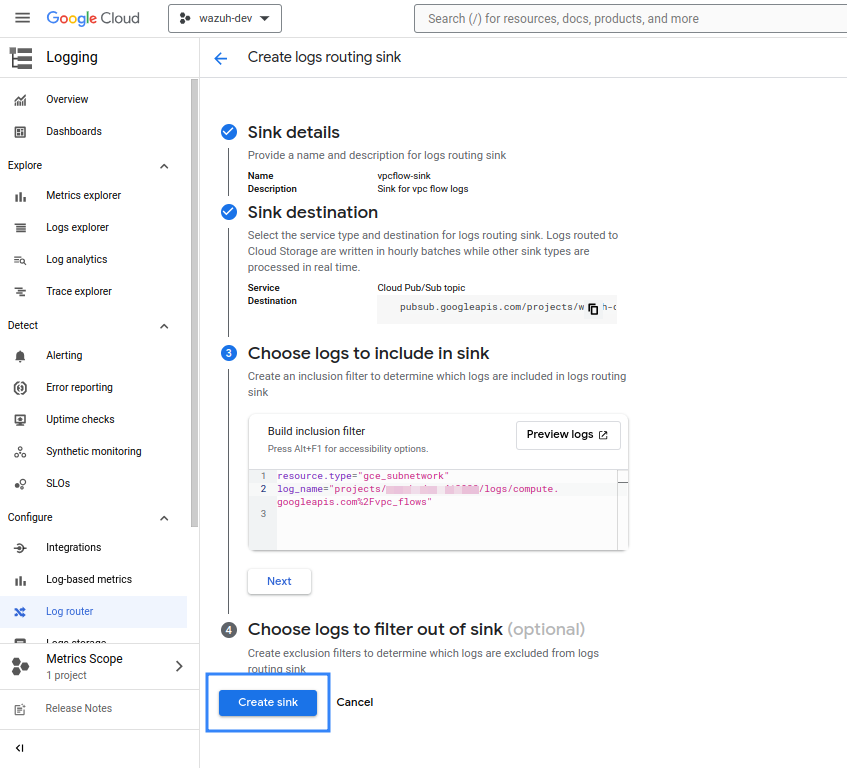
The Export logs via sink section explains how to create a sink to export logs to a Pub/Sub topic. However, this would export every single log available, not just the VPC Flow Logs. It is possible to configure the sink to export VPC Flow Logs only to a topic, ignoring logs coming from other services by adding a filtering condition to the sink. To do so, follow the same instructions as explained in the Export logs via sink section but add the following filter in Step 3 - Choose logs to include in sink:
resource.type="gce_subnetwork"
log_name="projects/<YOUR_PROJECT_ID>/logs/compute.googleapis.com%2Fvpc_flows"
Replace <YOUR_PROJECT_ID> with your project ID on Google Cloud.
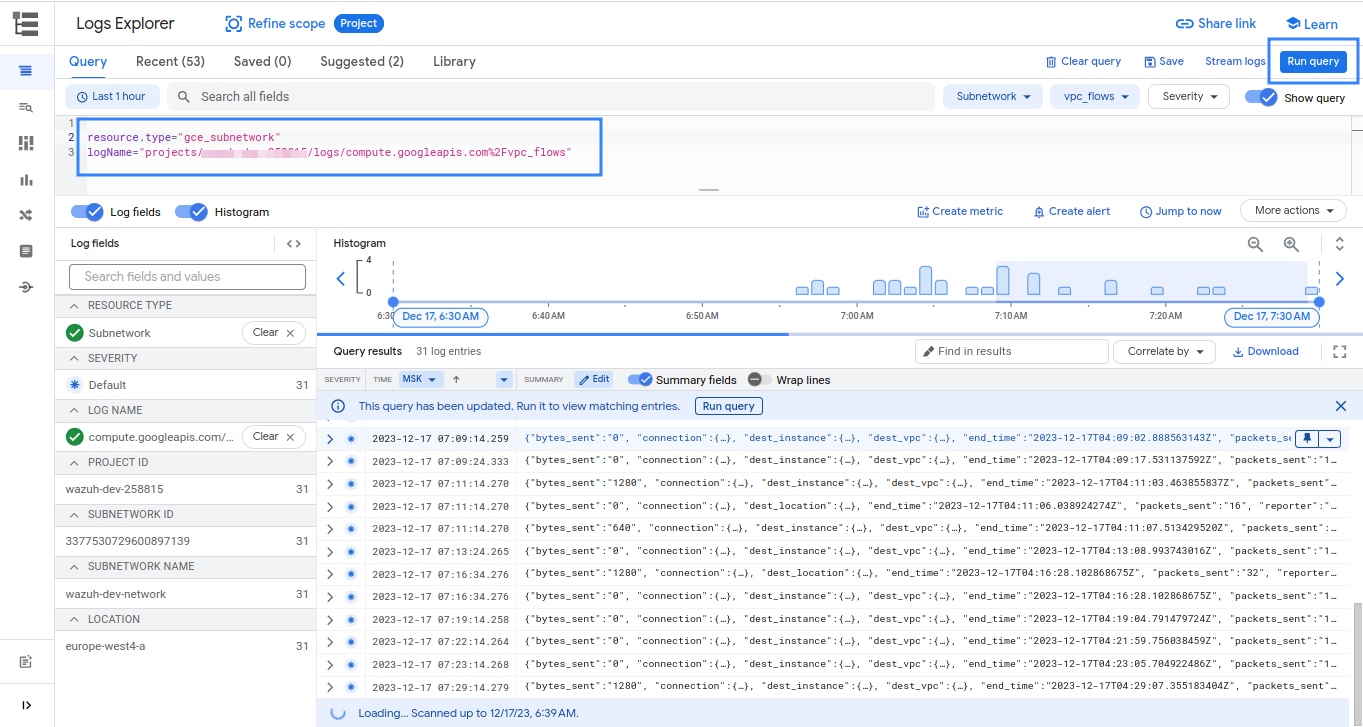
You can confirm that logs are generated in your environment by running the query in the Logs Explorer, as shown in the picture below.
Visualizing the events on Wazuh dashboard
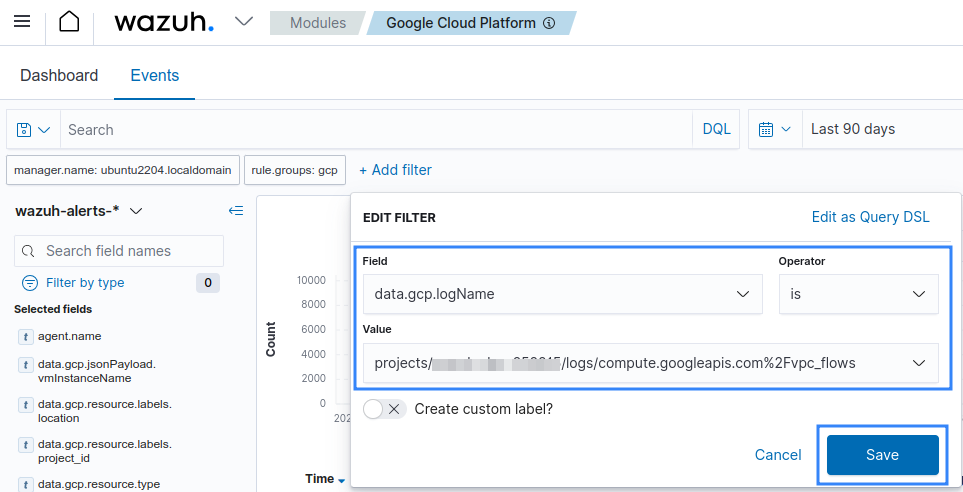
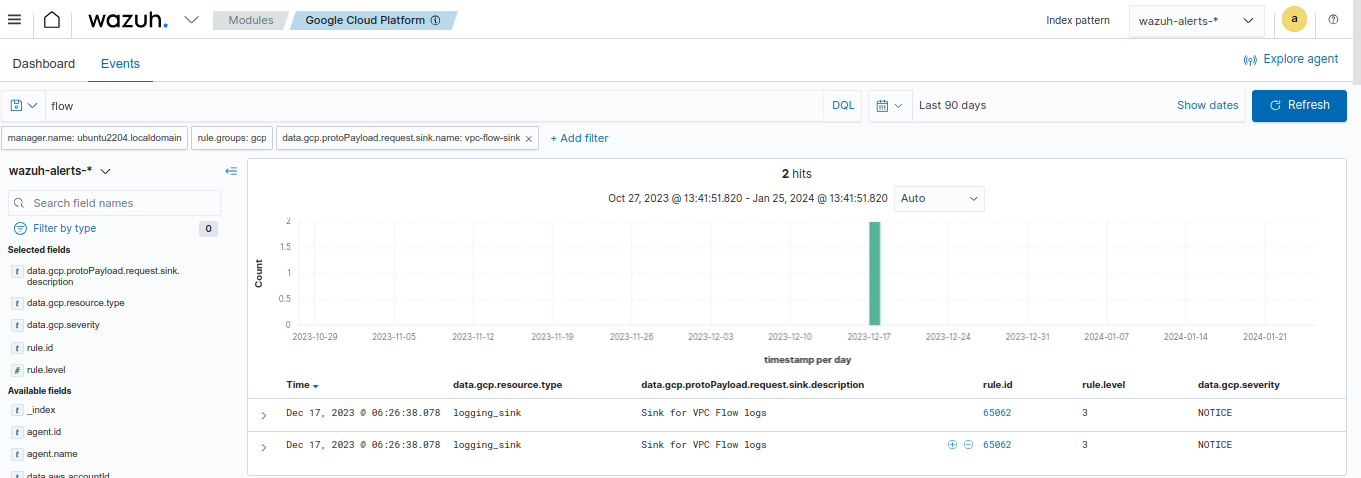
Once you configure the sink, apply the filter below on the Google Cloud module of the Wazuh dashboard to filter for VPC Flow Logs.
Set the value of data.gcp.logName field to projects/<YOUR_PROJECT_ID>/logs/compute.googleapis.com%2Fvpc_flows. Replace <YOUR_PROJECT_ID> with your Google Cloud project ID.
You can write custom rules for your VPC Flow logs use cases. For example, the following custom rules show all VPC Flow logs where the dest_instance.vm_name is instance-20260122-120105.
Add the following rules to your Wazuh server
/var/ossec/etc/rules/local_rules.xmlfile.<group name="gcp_custom,"> <rule id="165050" level="5"> <if_group>gcp</if_group> <field name="gcp.jsonPayload.dest_instance.vm_name">^<INSTANCE-XXXXXXXX-XXXXXX>$</field> <description>GCP VPC flow involving VM <INSTANCE-XXXXXXXX-XXXXXX></description> <options>no_full_log</options> <group>gcp,vm_instance_monitor,</group> </rule> </group>
Where:
<INSTANCE-XXXXXXXX-XXXXXX>: is the monitored instance ID. Please replace this with the virtual machine instance ID you intend to monitor.
Firewall Rules Logging
Firewall Rules Logging records traffic to and from Compute Engine virtual machine (VM) instances. This includes Google Cloud products built on Compute Engine VMs, such as Google Kubernetes Engine (GKE) clusters and App Engine flexible environment instances. To send Firewall Rules Logging logs to Wazuh, you must first configure Cloud Logging to export these logs to Pub/Sub.
Note
Before you perform the steps below make sure that you have already configured the Google Cloud Pub/Sub integration and the Wazuh module for Google Cloud Pub/Sub.
Enabling Firewall Rules Logging
Firewall Rules Logging can be enabled on the Firewall page in the Google Cloud Console. Follow the Google Virtual Private Cloud documentation for the most up-to-date instructions on how to enable this feature.
Exporting Firewall Rules logs to Pub/Sub
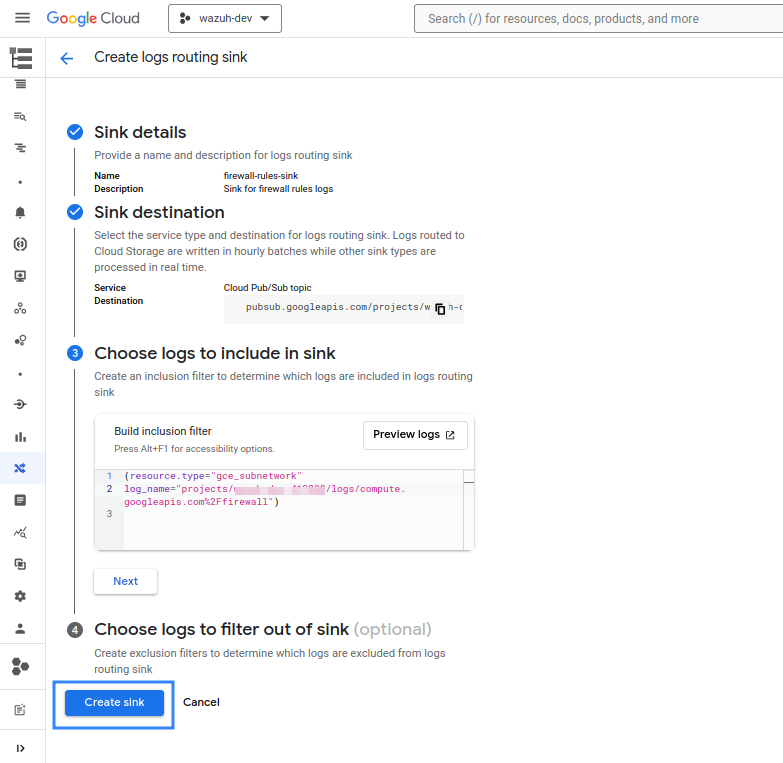
The Export logs via sink section explains how to create a sink to export logs to a Pub/Sub topic. However, this would export every single log available, not only the Firewall Rules Logging. It is possible to configure the sink to export Firewall Rules Logging logs only to a topic, ignoring logs from other services, by adding a filtering condition to the sink. To do so, follow the instructions as explained in the Export logs via sink section but add the following filter in Step 3 - Choose logs to include in sink:
(resource.type="gce_subnetwork"
log_name="projects/<YOUR_PROJECT_ID>/logs/compute.googleapis.com%2Ffirewall")
Replace <YOUR_PROJECT_ID> with your project ID on Google Cloud.
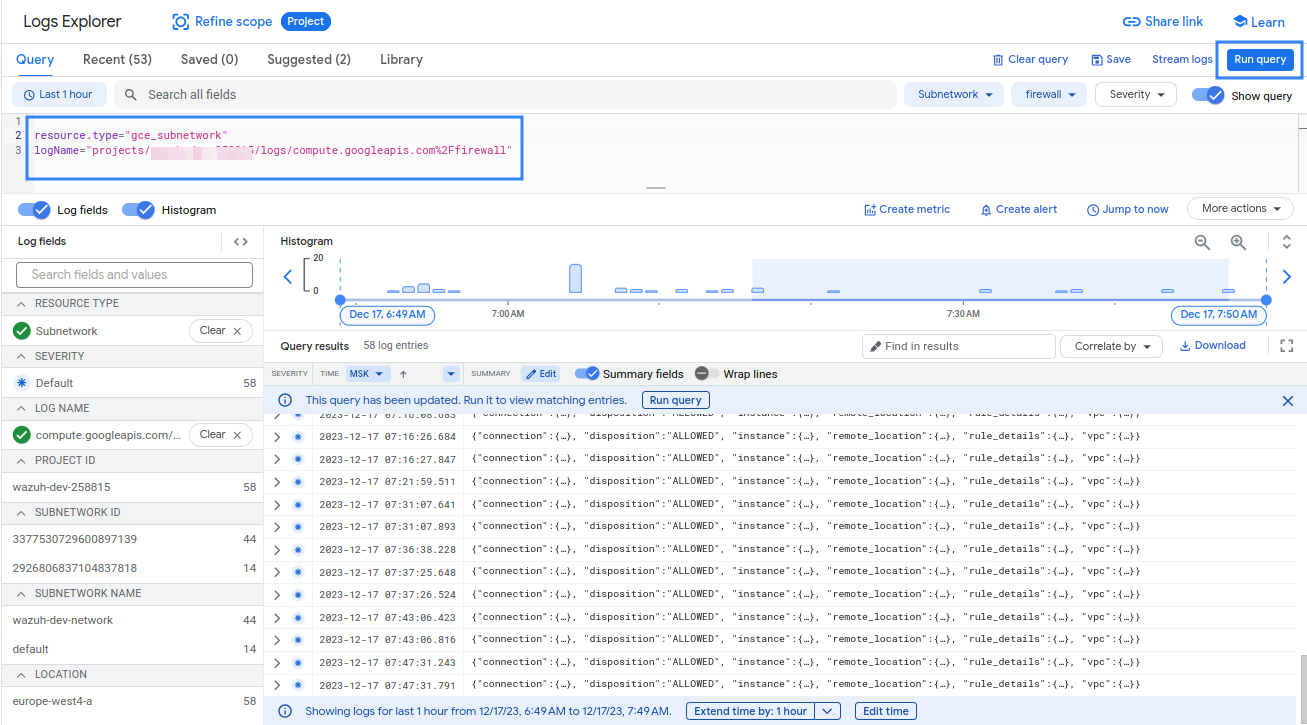
You can confirm that logs are generated in your environment by running the query in the Logs Explorer as shown in the picture below.
Visualizing the events on the Wazuh dashboard
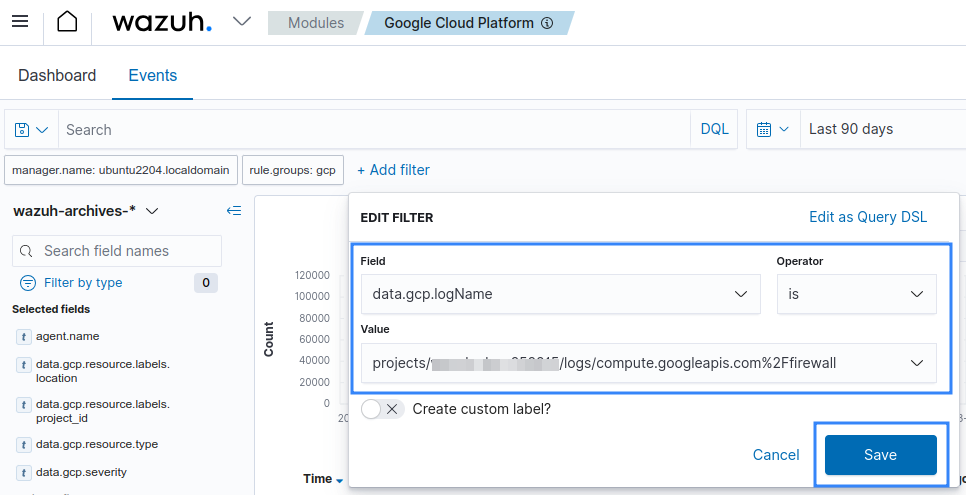
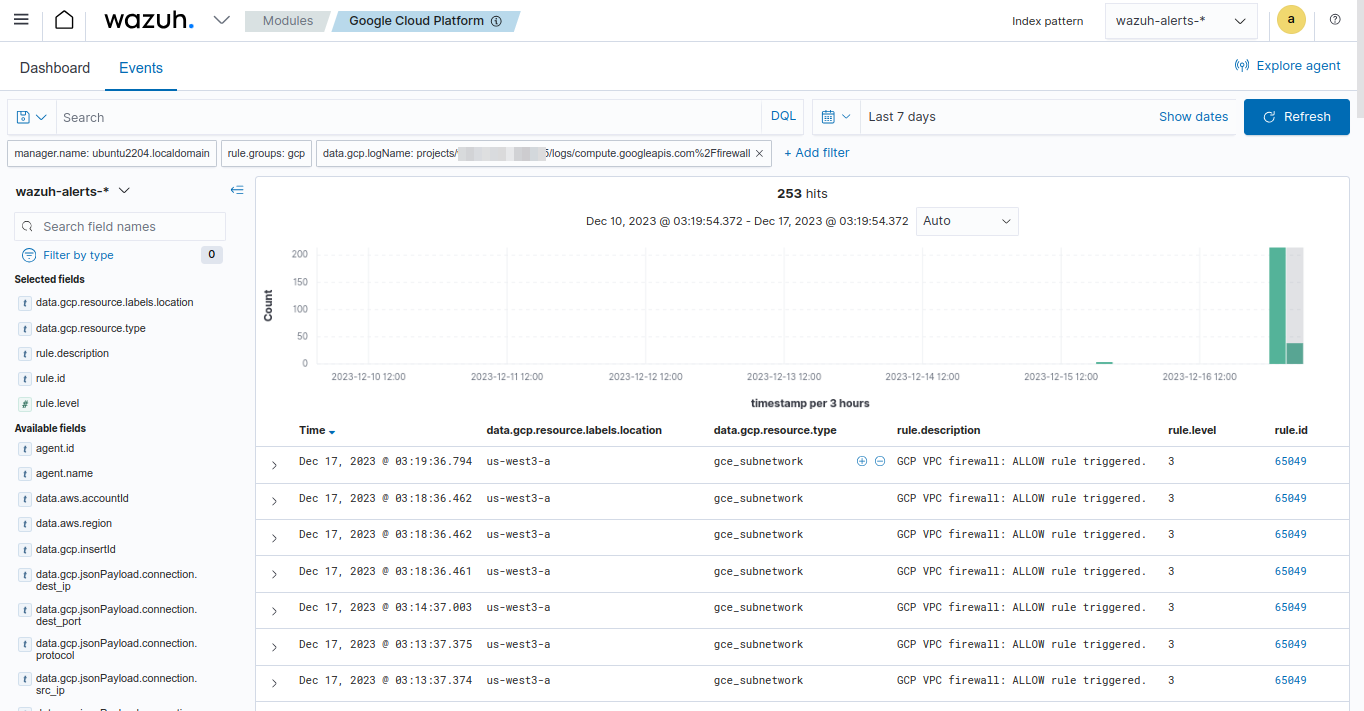
Once you configure the sink, apply the filter below on the Google Cloud module of the Wazuh dashboard to filter for Firewall Rules logs.
Set the value of data.gcp.logName field to projects/<YOUR_PROJECT_ID>/logs/compute.googleapis.com%2Ffirewall. Replace <YOUR_PROJECT_ID> with your own project ID on Google Cloud.
Available logs must appear as shown in the picture below.
HTTP(S) Load Balancing Logging
HTTP(S) Load Balancing Logging allows the user to enable, disable, and view logs for an HTTP(S) Load Balancing backend service. To send HTTP(S) Load Balancing Logging logs to Wazuh, you must first configure Cloud Logging to export these logs to Pub/Sub.
Note
Before you perform the steps below make sure that you have already configured the Google Cloud Pub/Sub integration and the Wazuh module for Google Cloud Pub/Sub.
Enabling logging on HTTP(S) Load Balancer
HTTP(S) Load Balancer Logging can be enabled on the Load Balancing page in the Google Cloud Console. Follow the Google Cloud Load Balancing documentation for the most up-to-date instructions on how to enable this feature.
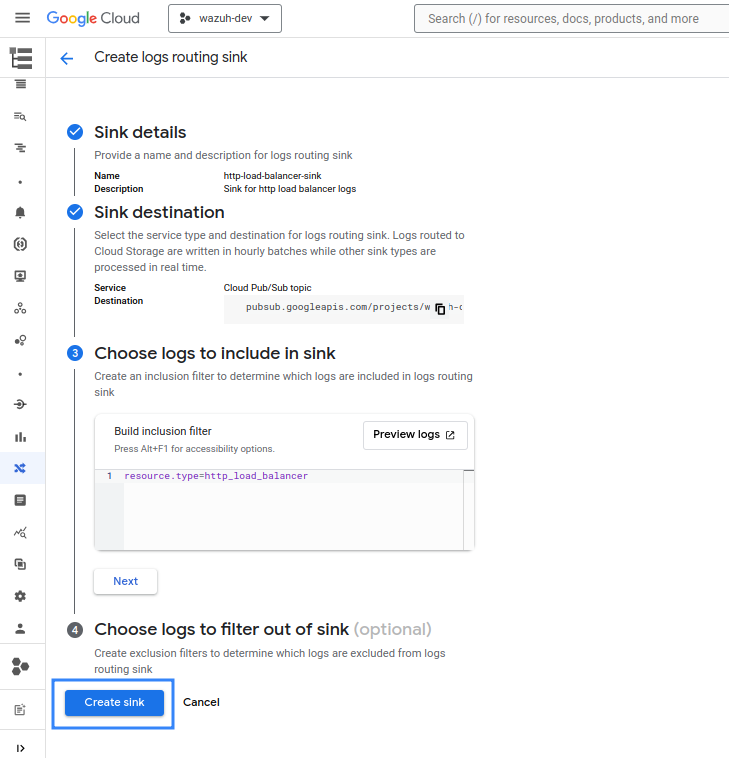
Exporting HTTP(S) Load Balancer logs to Pub/Sub
The Export logs via sink section explains how to create a sink to export logs to a Pub/Sub topic. However, this would export every single log available, not just the HTTP(S) Load Balancer logs. It is possible to configure the sink to export HTTP(S) Load Balancer logs only to a topic, ignoring logs from other services, by adding a filtering condition to the sink. To do so, follow the same instructions as explained in the Export logs via sink section but add the following filter in Step 3 - Choose logs to include in sink:
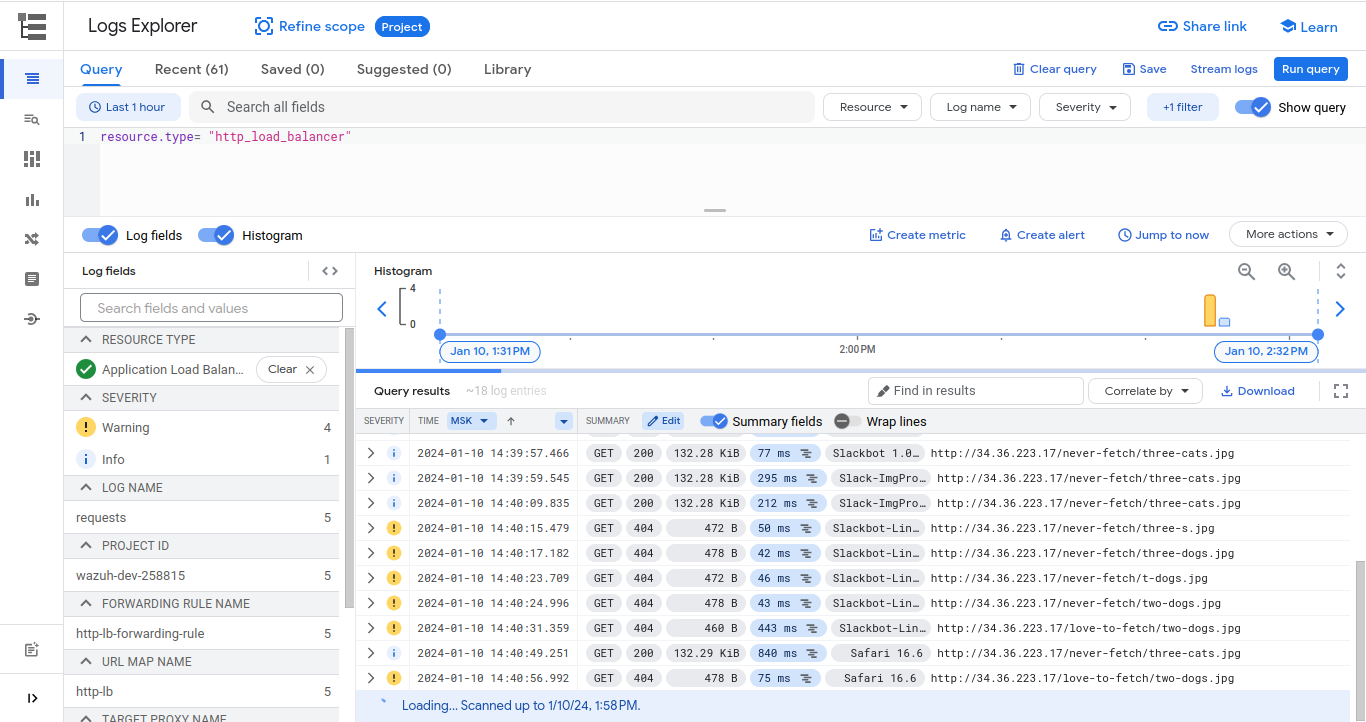
resource.type=http_load_balancer
You can confirm that logs are generated in your environment by running the query in the Logs Explorer, as shown in the picture below.
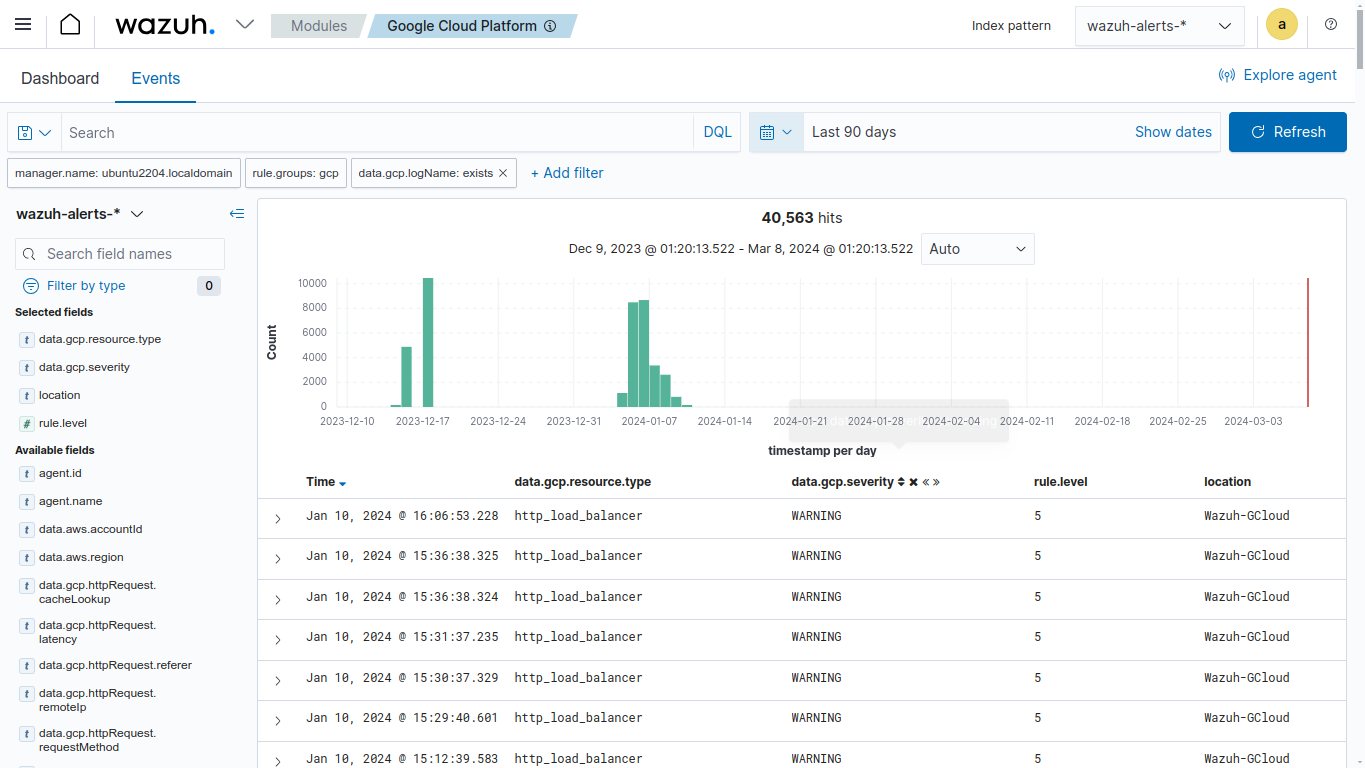
Visualizing the events on the Wazuh dashboard
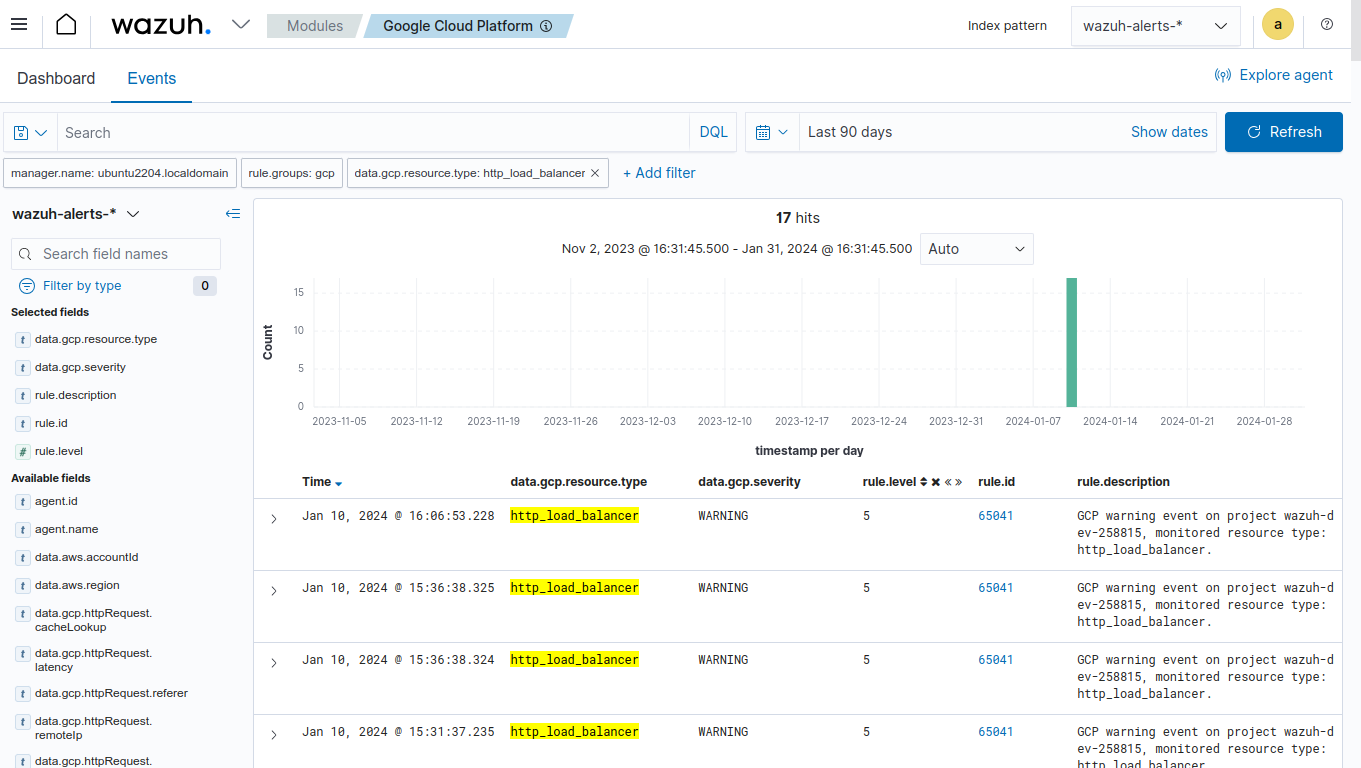
Once you configure the sink, apply the filter below on the Wazuh dashboard to filter for Load balancer logs.
Set the value of the data.gcp.resource.type field to http_load_balancer.
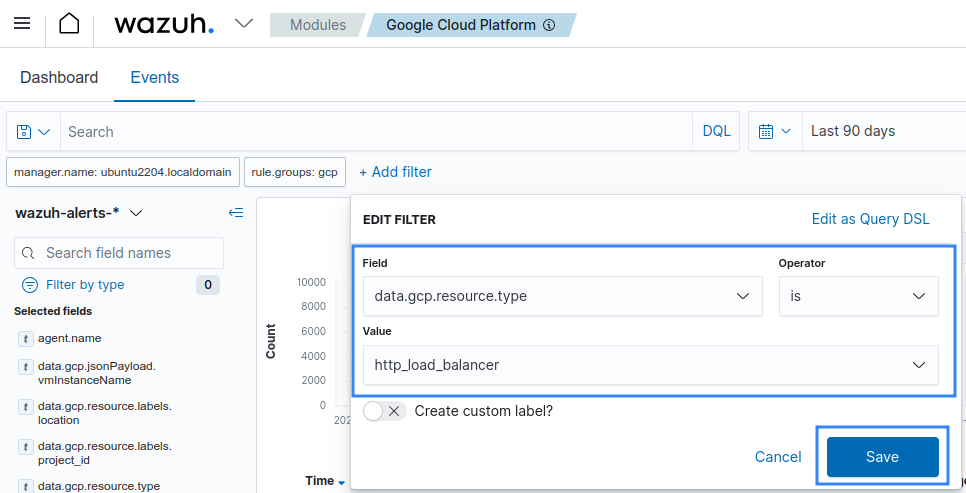
Available logs must appear as shown in the picture below.