Wazuh agent queue
The Wazuh agent includes a queue mechanism queue_ad to prevent large bursts of events on a Wazuh agent from negatively impacting the network or the Wazuh manager. It uses a leaky bucket queue that collects all generated events and sends them to the Wazuh manager at a rate below the specified events per second threshold. This helps to avoid the loss of events or unexpected behavior from the Wazuh components.
Additionally, Wazuh agent modules such as Log collector, File Integrity Monitoring (FIM), Security configuration assessment (SCA), can be configured to limit their event production rate, reducing the risk of saturating the leaky bucket's buffer.
Why a queue is needed
In the Wazuh architecture, Wazuh agents collect information from log files, command outputs, different kinds of scans, etc. They then send all the collected information to the Wazuh manager, separated into individual events. Without any congestion control, a Wazuh agent could potentially send events at a rate as high as the system can transmit, which could be hundreds or thousands of events per second.
Due to this fact, an incorrect configuration in a Wazuh agent may generate enough events to saturate a network or its Wazuh manager. Here are some misconfiguration scenarios that could lead to this problem:
Real-time file integrity monitoring of a directory with files that keep changing:
Events are generated every time a file under a monitored directory changes. If the FIM module monitors a directory that changes constantly, it will generate a large volume of events. In addition, if the monitored directory contains any file to which Wazuh continuously updates when it generates an event, like
/var/ossec/logs/, it will cause an infinite loop.Windows Filtering Platform:
A Windows firewall event (ID 5156) is generated each time an outbound network connection is allowed. When this event is enabled in Windows, and Wazuh is configured to monitor all Windows security event logs, the result is an infinite loop. When the Wazuh agent connects to its Wazuh manager, it generates a Windows firewall event that causes the Wazuh agent to connect again to its manager.
Applications that retry on errors with no rate limiting:
When certain applications encounter an error, such as disk full, they may generate an error log entry and retry the task hundreds of times per second, generating massive events.
Each of these scenarios may create such a high rate of events that the functioning of the Wazuh agent, network, and/or manager may be significantly hampered.
Event congestion controls
To better handle these kinds of situations, the following controls have been deployed:
Agent-to-manager event congestion management (Leaky bucket):
This provides event congestion control with an agent-side leaky bucket queue to guard against saturation of the network or of the Wazuh manager by a Wazuh agent.
Internal agent event congestion management:
This mechanism uses internal limits in different components of the Wazuh agent to control the rate at which they generate events.
Agent-to-manager event congestion management (Leaky bucket)
As mentioned above, the leaky bucket is a congestion control located in Wazuh agents and focused on agent-to-manager communication. The Wazuh agent collects events and stores them temporarily in a buffer that can hold up to 5000 events by default. It then forwards these events to the Wazuh manager, ensuring that no more than 500 events are sent per second, which is the default setting. This ensures a controlled flow of information to the Wazuh manager. These values are set by default; however, you can change them depending on your infrastructure requirement. The following graphic shows how the bucket works.
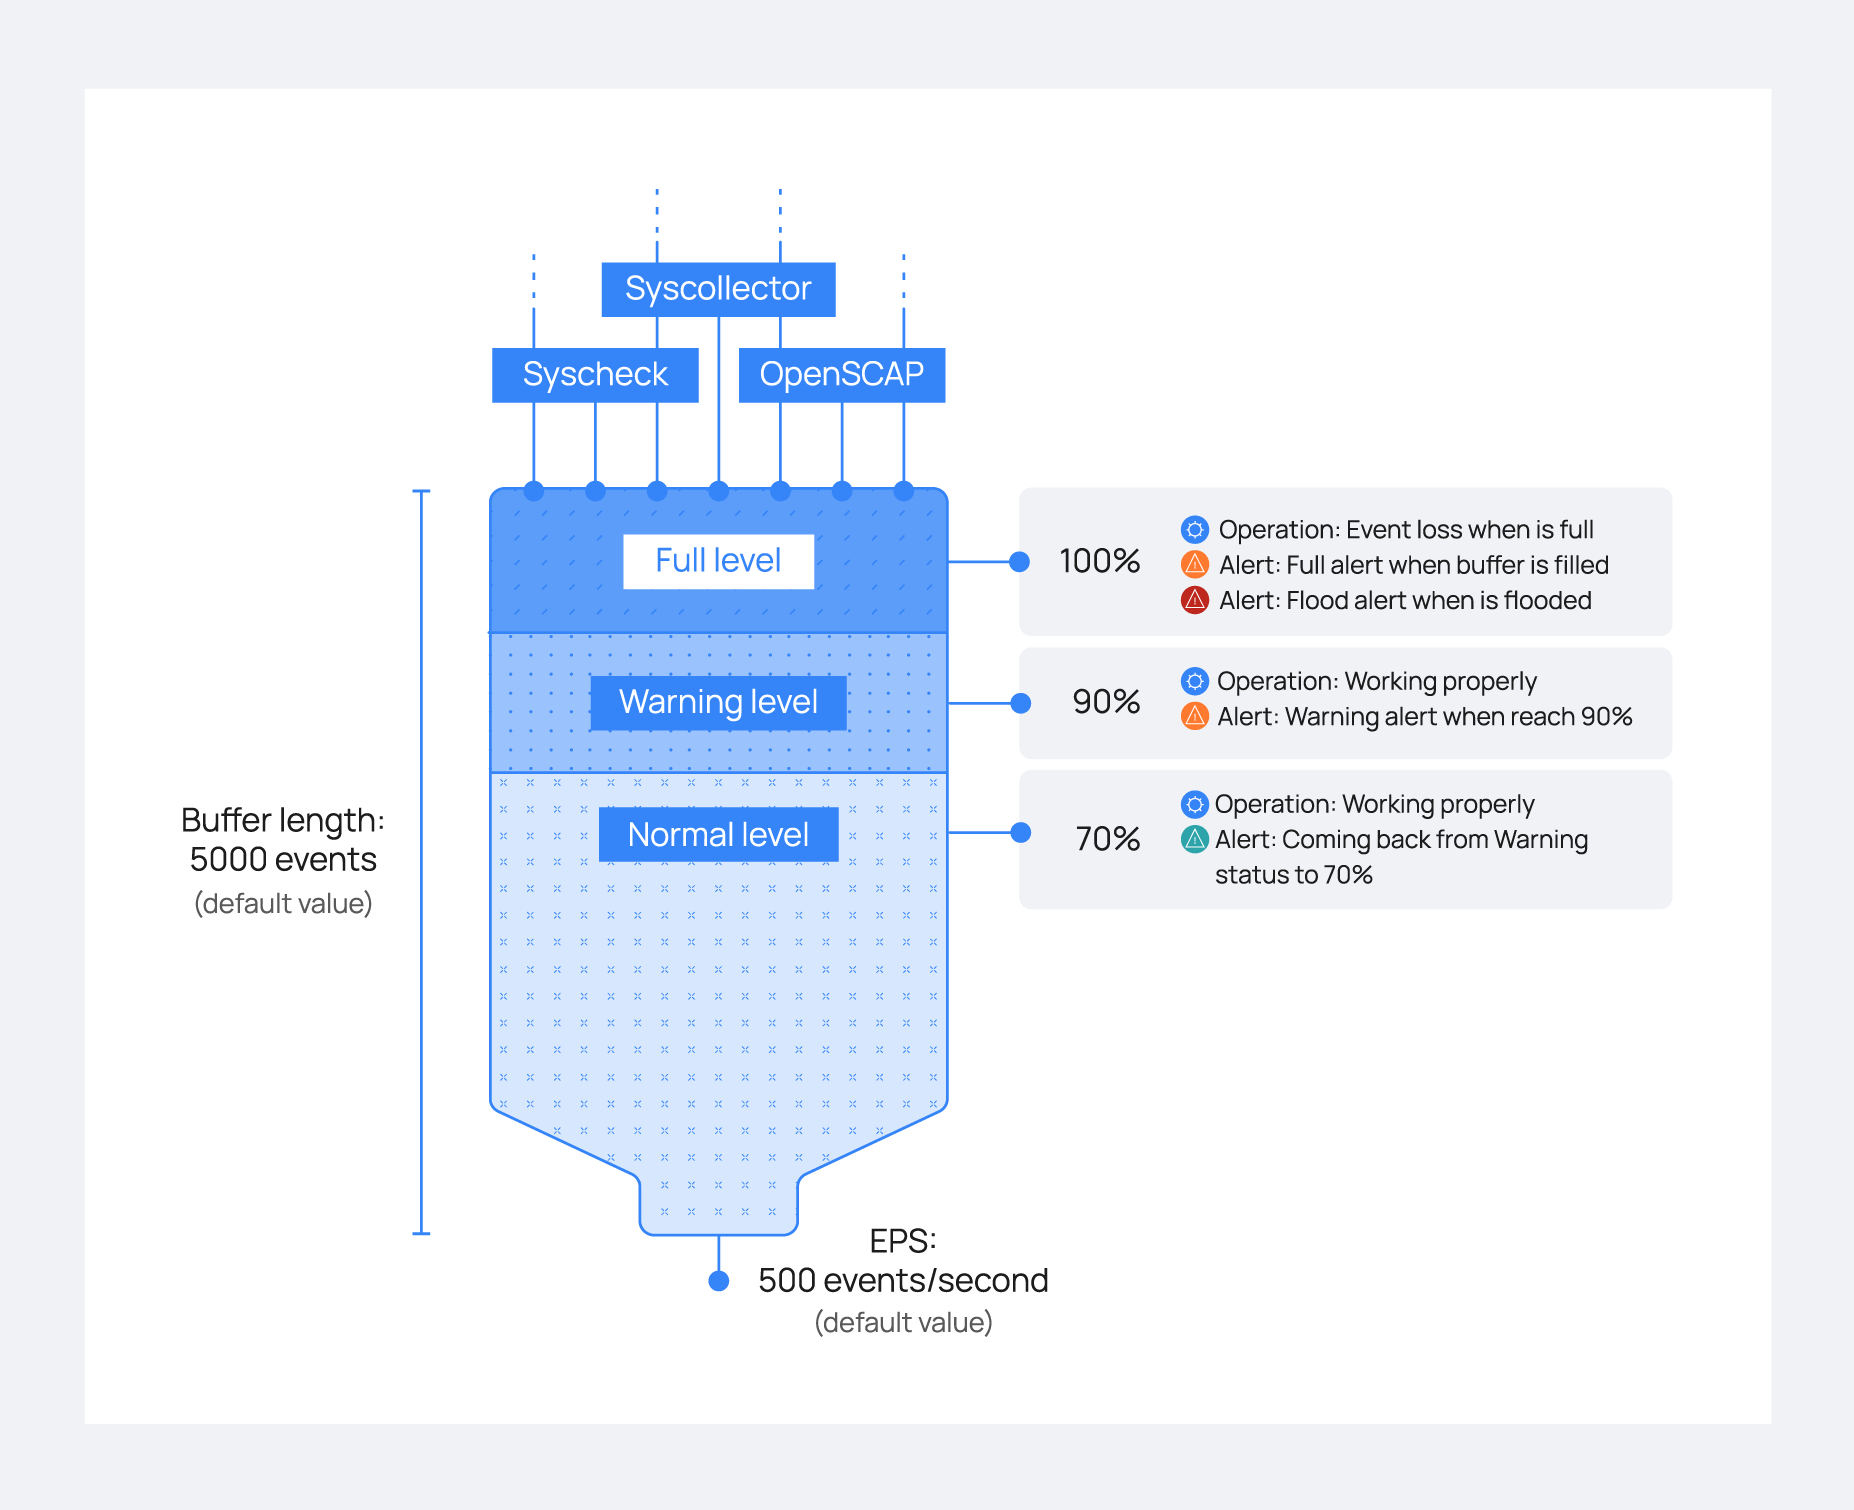
There are several levels of control for the bucket. These control levels are set to monitor the buffer status and address a potential flooding situation. They include:
Warning alert: The first control level will trigger an alert on the Wazuh manager when the occupied capacity of the buffer has reached a certain threshold. By default, it is set at
90%.Full alert: After the first control level, if the buffer gets filled, the Wazuh manager will receive another alert. This new alert is more serious than a warning alert because subsequent events will be dropped when the bucket is filled.
Flood alert: This alert is generated if more than a customizable timeout passes between a full alert event and the buffer level dropping below the
warning level. For example, you might set the timeout to 60 seconds. This means if the buffer remains full for more than 60 seconds after a "Full alert," the "Flood alert" will be triggeredNormal alert: This announces that the buffer level has returned to normal (by default <=
70%) after having previously triggered a warning alert or higher.
The leaky bucket can be configured to adapt to any environment with the use of the following configuration options:
Throughput configuration
In the <client_buffer> section of Local configuration, it is possible to disable the buffer, configure the size of the buffer (number of events), and configure its throughput limit measured in events per second (EPS).
Follow the steps below to configure the Wazuh agent queue.
Modify the
queue_sizeandevents_per_secondto allowable values in theclient_bufferblock in the Wazuh agent configuration file. The file can be found atC:\Program Files (x86)\ossec-agent\ossec.confon Windows,/var/ossec/etc/ossec.confon Linux/Unix, and/Library/Ossec/etc/ossec.confon macOS.<client_buffer> <!-- Agent buffer options --> <disabled>no</disabled> <queue_size>5000</queue_size> <events_per_second>500</events_per_second> </client_buffer>
Disable buffer: This parameter disables the use of the leaky bucket, resulting in no restriction on the rate of events transmitted by the Wazuh agent to the Wazuh manager.
Queue size: The queue size is the maximum number of events that can be held in the leaky bucket once. It should be configured according to the expected rate at which a Wazuh agent may generate events. By default, this value is set to 5000 events, which is a generous buffer size for most environments.
Events per second: This is the maximum rate at which events will be pulled from the Wazuh agent's buffer and transmitted to its manager. The default is a generous 500 EPS, but this should be set considering the network's capacity and the number of agents a manager is serving.
Restart the Wazuh agent with administrative privileges.
# systemctl restart wazuh-agent
# Restart-Service -Name wazuh# /Library/Ossec/bin/wazuh-control restart
This configuration is also available in centralized configuration, which means it can be set in the agent.conf file to configure agents' bucket options from the Wazuh server. When a Wazuh agent is configured by agent.conf, that configuration overrides its local configuration. However, it is possible to configure the minimum number of EPS an agent is allowed to transmit. This can be done by setting the agent.min_eps in the Wazuh agent's /var/ossec/etc/internal_options.conf file. This setting overrides the EPS limit configured at the Wazuh manager level via agent.conf.
Threshold configuration
The /var/ossec/etc/internal_options.conf file contains more advanced options related to buffer operation. These advanced options include the warning and normal level thresholds. Using the internal configuration /var/ossec/etc/internal_options.conf file, we can also configure the tolerance time for triggering a flooding alert.
Internal agent event congestion management
To avoid agent buffer saturation followed by event loss, the event production rates of the Wazuh agent daemons that could cause this saturation have been limited.
Logcollector: If a log file is written faster than the logcollector can read it, this can negatively impact the Wazuh agent's proper functioning. For this reason, the Wazuh agent will restrict itself to reading no more than a configurable maximum number of lines from the same file per read cycle.
Syscollector: The module previously sent the entire set of scan results as soon as a scan was complete. It now sends the scan information to the Wazuh manager at a regulated speed to prevent the buffer from collapsing.
These are advanced configurations located at Internal configuration. The variables defined for this purpose are called logcollector.max_lines, wazuh_modules.max_eps, and much care should be given when changing these values.
Use case: Leaky bucket
In this section, it will be shown how the leaky bucket acts when under high load. In the image below, we show the different phases of the buffer's usage from when it is receiving more events than expected till the flooding is resolved.
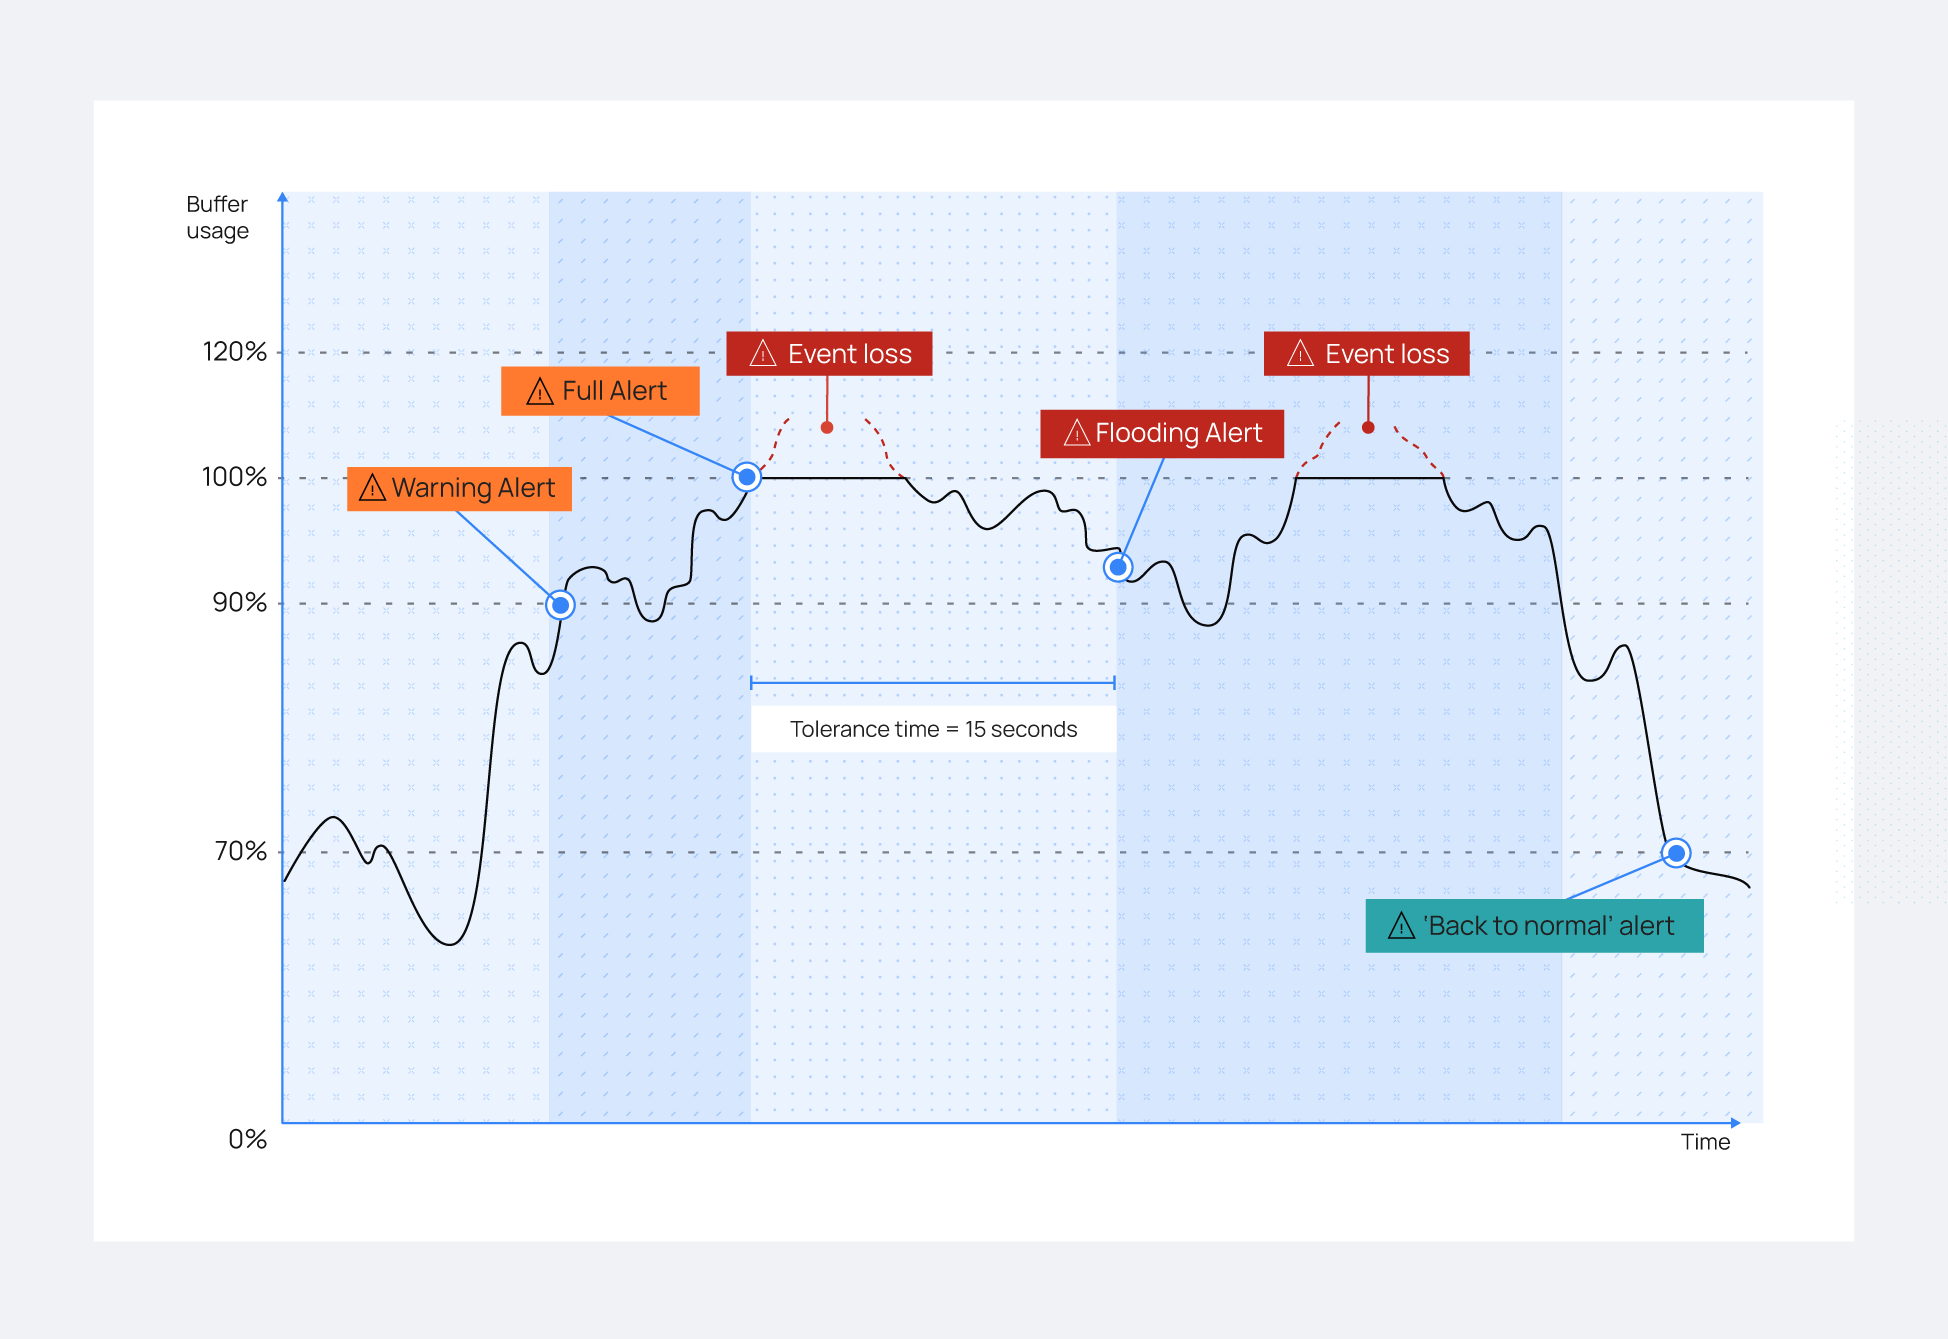
Normal status (green area)
As the graphic in the left area shows, the buffer works normally, receiving and sending events. In this situation, no buffer alerts are triggered on the Wazuh manager. However, many events can trigger an increase in buffer usage, causing it to reach the warning level, which is set at 90%.
Warning status (orange area)
Once it has reached the warning level, you will see alerts with rule.id: 202 on the Wazuh dashboard:
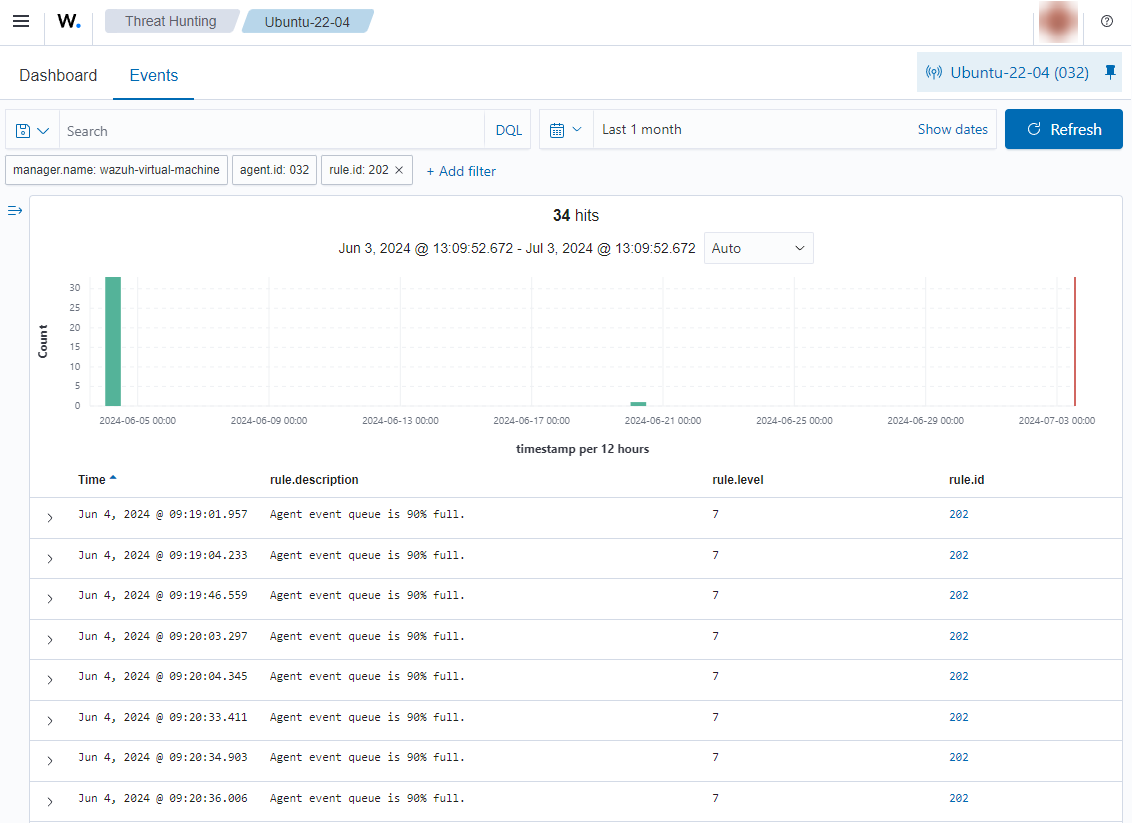
Despite this alert, no events have been dropped because the buffer still has free space.
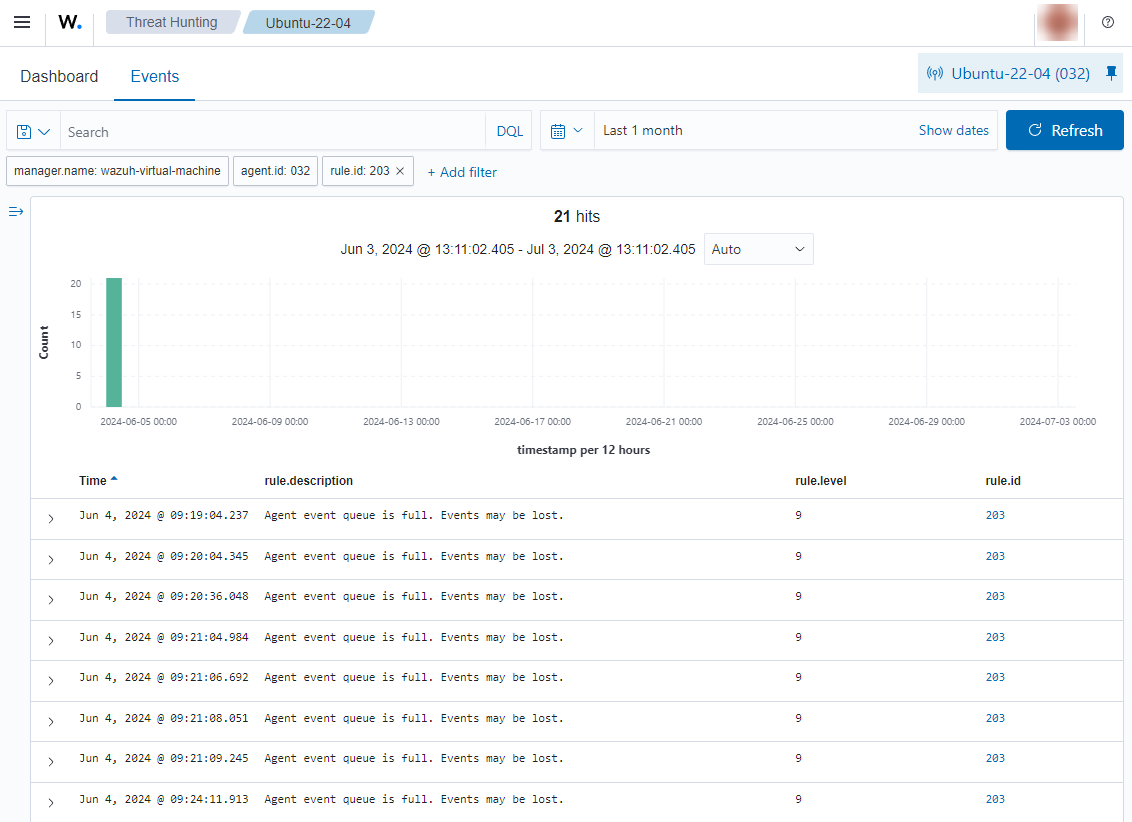
Full status (light red area)
When the buffer continues receiving events faster than they are removed, it will eventually reach 100% of its capacity. You'll see alerts with rule.id 203 on the Wazuh dashboard:
Note
It is important to understand that when the buffer is full, all newly arriving events will be dropped until free space opens up in the buffer. For example, if 1000 events arrive at a full buffer with a throughput limit of 500 EPS in one second, 500 of these events will be stored, and the other 500 will be dropped.
When the buffer is 100% full, a timer is started compared to the agent.tolerance value is set in the /var/ossec/etc/internal_options.conf file.
At this point, two possible things could happen:
The buffer utilization decreases below the
warning levelbefore the timer reaches theagent.tolerancevalue. If this occurs, no alert about flooding appears on the Wazuh manager. This graphic illustrates this situation.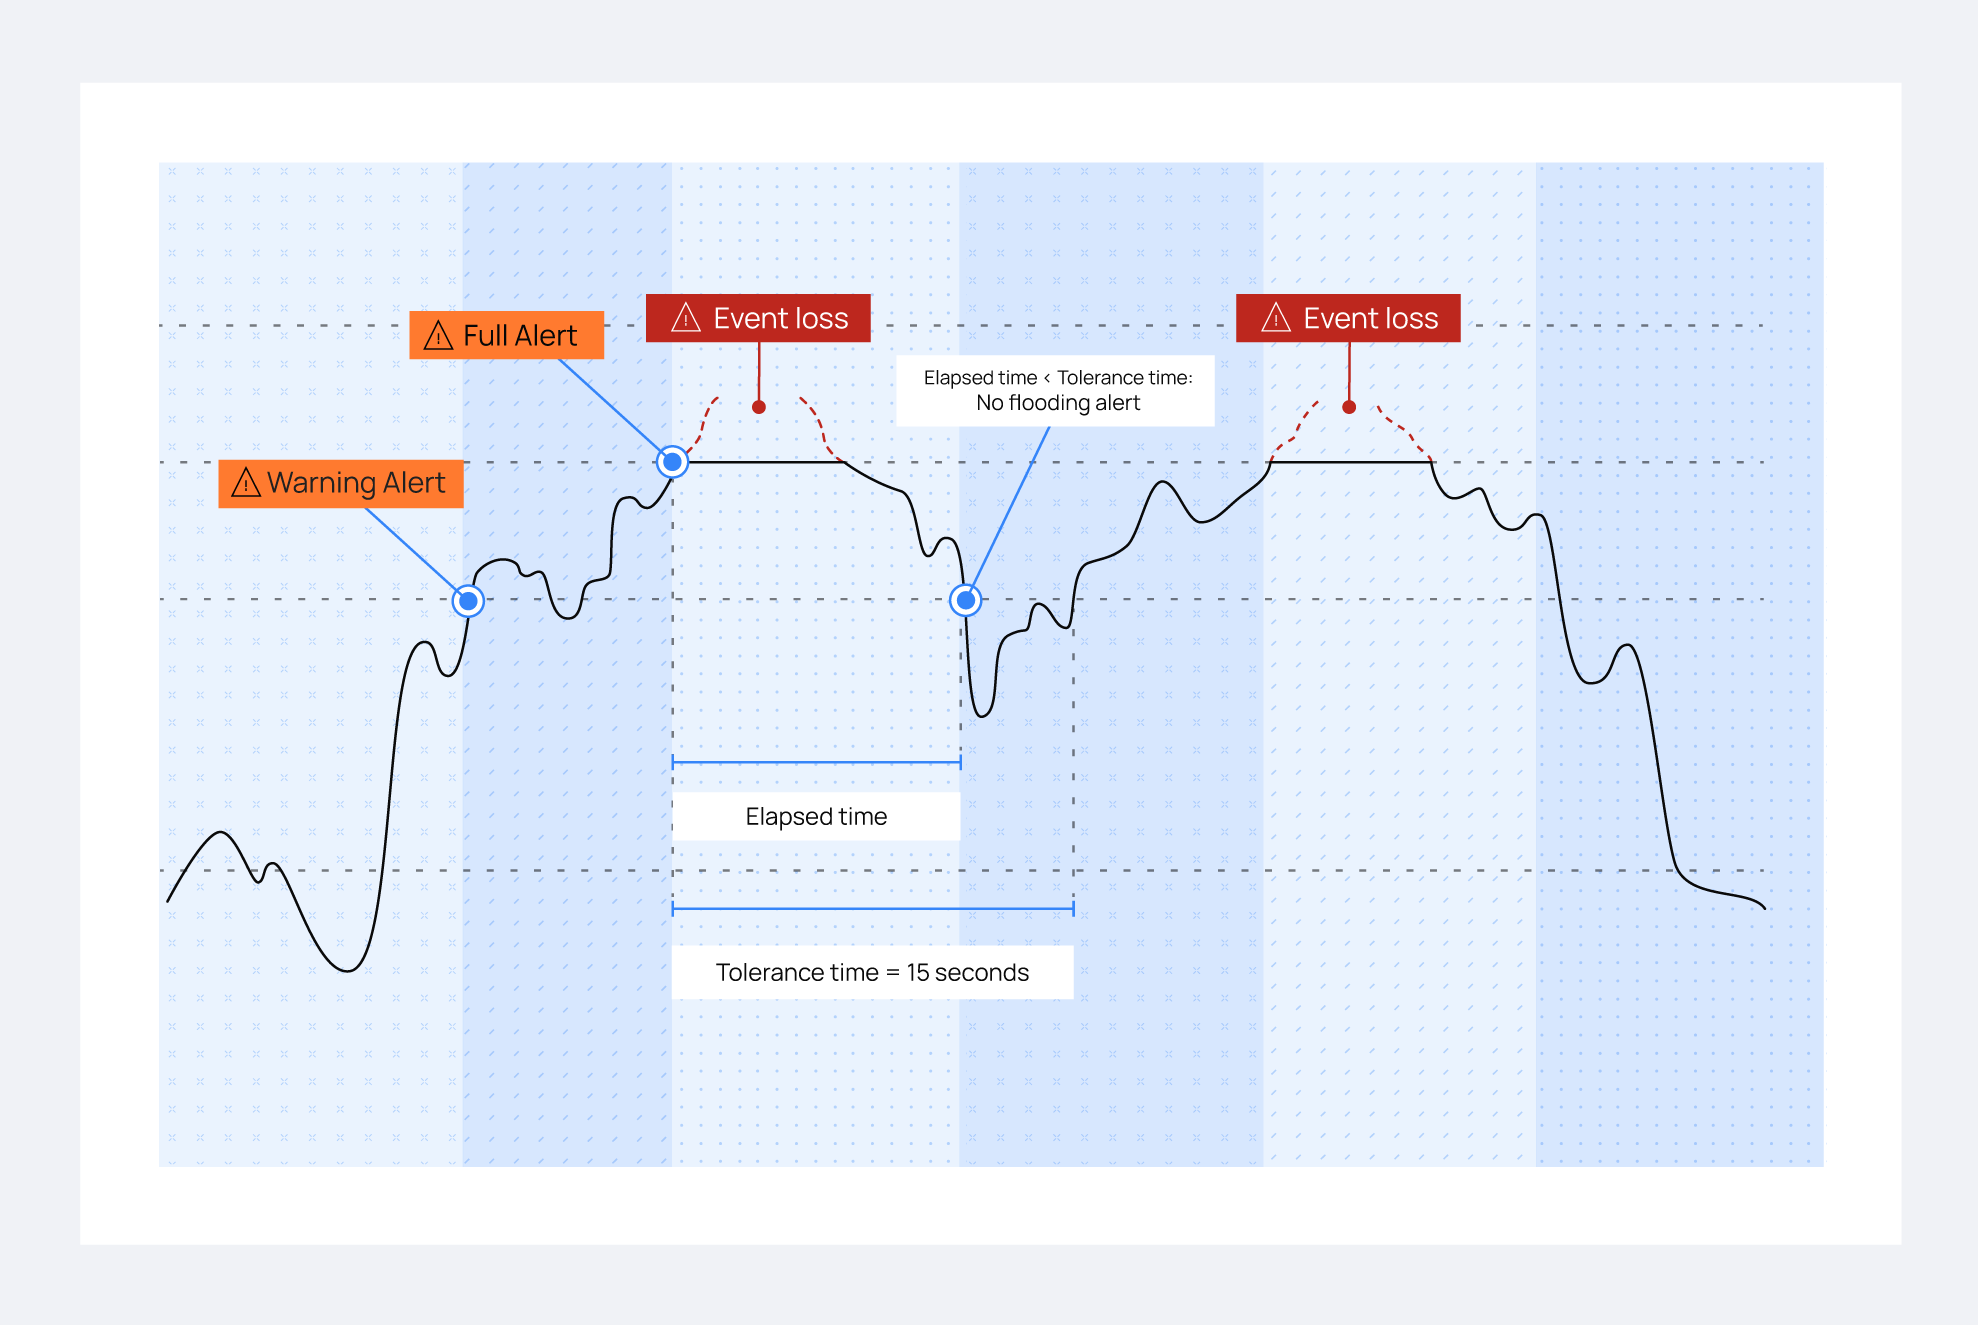
The buffer utilization stays above the
warning leveluntil the specifiedagent.tolerancevalue has elapsed. Now, the buffer may not come back to normal status by itself. For that reason, a more severeFlooding statusalert is triggered on the Wazuh manager.
Flooding status (red area)
If the conditions in number 2 above are met, where the buffer stays above the warning level beyond the defined agent.tolerance value, the Flooding status alert is triggered. You'll see an alert with rule.id 204 on the Wazuh dashboard:
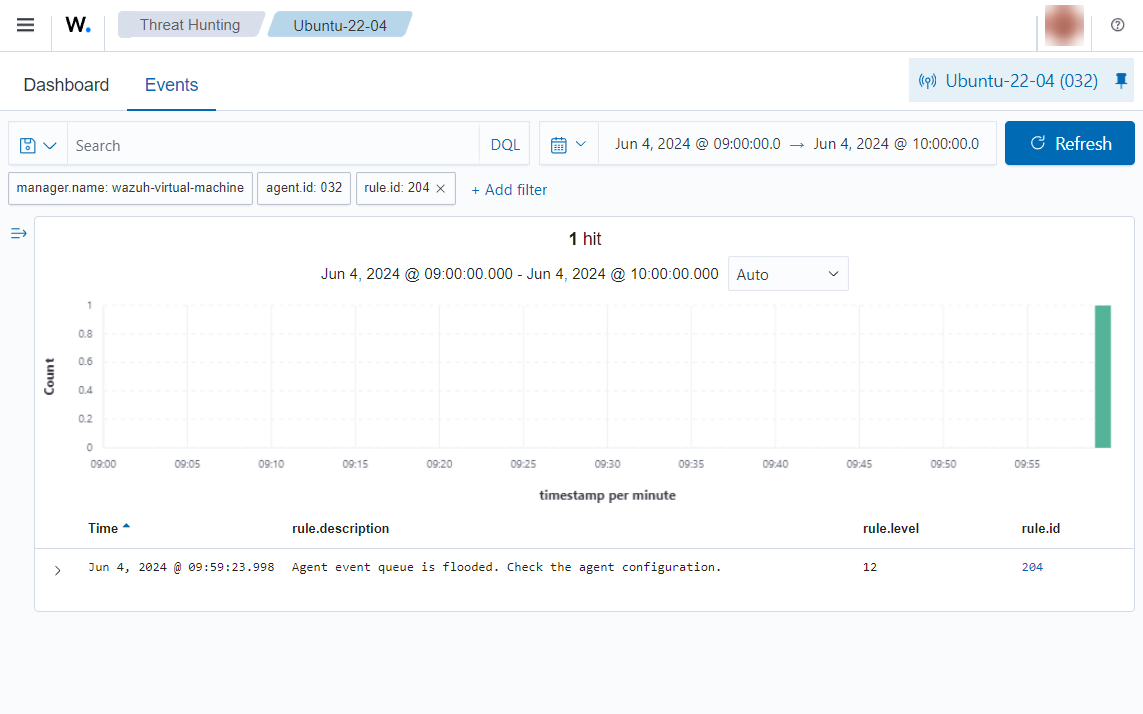
Note
The alert description warns the user to check the Wazuh agent since it is probable that it will not recover to normal status by itself. Remember that a flooded agent is dropping events.
Normal status
The right area of the graphic shows how the buffer returns to normal status after it hits 100%. This could occur when a module stops generating excessive events, either because a task has been completed or because the problematic module was manually shut down.
To let the Wazuh manager know when a Wazuh agent is working properly again, another alert is triggered when the use of a maxed-out buffer decreases to less than the normal level (70% by default). You'll see alerts with rule.id 205 on the Wazuh dashboard:
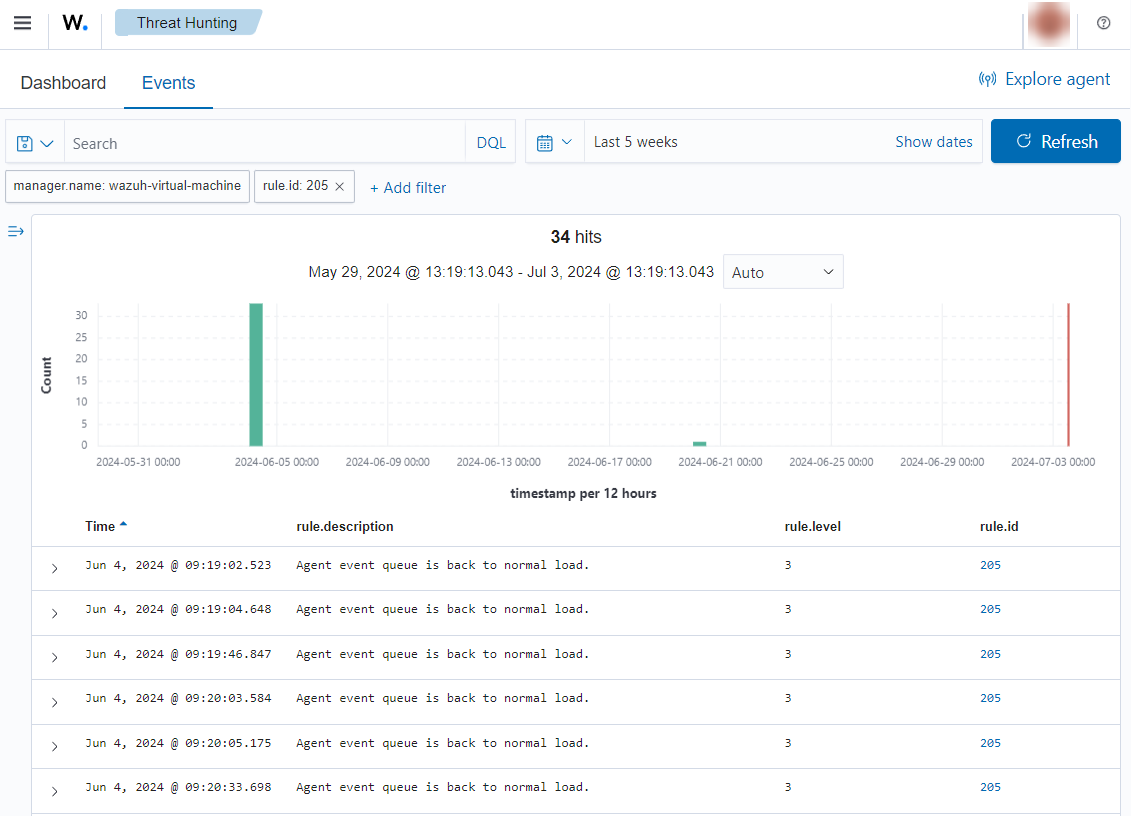
When the bucket is in this status, no events are dropped.