Command output analysis
Wazuh is shipped with a default ruleset that analyzes events from monitored endpoints and generates security alerts. The Wazuh server processes the output of commands executed on the endpoints by the Command or the Logcollector module. Wazuh processes the output like it processes logs from other sources. There are several stages of log processing in Wazuh including pre-decoding, decoding, and rule matching.
Decoding and rule matching
Decoders extract defined fields from logs sent to the Wazuh server. The pre-decoding phase of analysis extracts information such as timestamp, hostname, and program name from the log header. After this phase, the analysis engine looks for a decoder matching a log. When a decoder is found, it extracts the fields of the logs and matches the appropriate rules to generate security alerts. When a decoder is not found, the log is ignored.
Utilize the Wazuh-Logtest utility to simulate and visualize the process of decoding and matching logs against rules. When a decoder is found, it is used to extract the defined fields, otherwise, it throws the message, No decoder matched.
Viewing the raw logs
The Wazuh archives provide the option to view the raw log format of executed commands that the Wazuh server processes. This feature allows you to gather log information required to develop decoders when no decoders are available to process specific log formats.
When you enable the Wazuh archives, all the logs the Wazuh server receives are stored in the /var/ossec/logs/archives/archives.log and /var/ossec/logs/archives/archives.json files on the Wazuh server. By default, this feature is disabled on the Wazuh server to prevent the server from storing raw logs and filling the disk storage.
To view the output of executed commands, you need to enable the Wazuh archives on the Wazuh server using the following steps:
Set the value of the
<logall>and<logall_json>tags toyeswithin the<global>block of the Wazuh server/var/ossec/etc/ossec.conffile.Restart the Wazuh manager to apply the configuration changes:
# systemctl restart wazuh-manager
Open the
/var/ossec/logs/archives/archives.logand/var/ossec/logs/archives/archives.jsonfiles on the Wazuh server to view the newly received logs.
Visit the logall and logall_json options of the global configuration section to get detailed information.
Note
As earlier stated, the Wazuh archives retain logs collected from all monitored endpoints, therefore consuming significant storage resources on the Wazuh server over time. So, you might want to disable it after successful log analyses.
Creating a custom ruleset
The Wazuh agent collects logs and events that contain specific information on monitored endpoints. You need to create a custom ruleset to extract relevant information from the collected logs.
To demonstrate the process of creating a custom ruleset, we configure the Command module to obtain the amount of physical RAM left unused in a Linux endpoint every five minutes. In this example, the module executes a command to generate memory usage events on the Linux endpoint and forward the logs to the Wazuh server.
Perform the steps below to generate the events and create a custom ruleset.
Wazuh server
Enable the Wazuh archives to store the raw logs by setting the value of
<logall_json>toyeswithin the<global>block of the/var/ossec/etc/ossec.conffile.Restart the Wazuh manager to apply the configuration changes:
# systemctl restart wazuh-manager
Linux endpoint
Add the Command module configuration below within the
<ossec_config>block of the/var/ossec/etc/ossec.conffile:<wodle name="command"> <disabled>no</disabled> <tag>unused_memory</tag> <command>grep MemFree /proc/meminfo</command> <interval>5m</interval> <ignore_output>no</ignore_output> <run_on_start>yes</run_on_start> <timeout>0</timeout> </wodle>
Restart the Wazuh agent to apply the configuration changes:
# systemctl restart wazuh-agent
Wazuh server
Run the command below to obtain the log received from the monitored Linux endpoint:
# grep "unused_memory" /var/ossec/logs/archives/archives.json
{"timestamp":"2023-07-26T09:06:08.947+0000","agent":{"id":"002","name":"Ubuntu-22-LTS","ip":"10.0.2.15"},"manager":{"name":"wazuh-server"},"id":"1690362368.662599","full_log":"MemFree: 90008 kB","decoder":{},"location":"command_unused_memory"}The
full_logfield in the log contains the actual event generated on the monitored Linux endpoint.Run the
/var/ossec/bin/wazuh-logtestprogram and paste the value of thefull_logfield in the prompt:# /var/ossec/bin/wazuh-logtest Starting wazuh-logtest v4.12.0 Type one log per line MemFree: 90008 kB **Phase 1: Completed pre-decoding. full event: 'MemFree: 90008 kB' **Phase 2: Completed decoding. No decoder matched.
You can see that there is no decoder available to decode the log as highlighted. You need to create a decoder to extract information from the log.
To extract information such as the free memory and unit of measurement from the log, add the following custom decoder to the
/var/ossec/etc/decoders/local_decoder.xmlfile:<decoder name="unused-memory"> <prematch>^MemFree: </prematch> <regex offset="after_prematch">\t*(\S+)\s(\S+)</regex> <order>free_memory, unit_of_measurment</order> </decoder>
Run the
/var/ossec/bin/wazuh-logtestprogram and paste the value of thefull_logfield in the log again. This time you can see that the log is properly decoded by the decoderunused-memoryand the fieldsfree_memoryandunit_of_measurmentare extracted accordingly:# /var/ossec/bin/wazuh-logtest Starting wazuh-logtest v4.12.0 Type one log per line MemFree: 90008 kB **Phase 1: Completed pre-decoding. full event: 'MemFree: 90008 kB' **Phase 2: Completed decoding. name: 'unused-memory' free_memory: '90008' unit_of_measurment: 'kB'
The decoded output of the command needs to trigger a rule to generate an alert. Add the custom rule below to the
/var/ossec/etc/rules/local_rules.xmlfile to generate an alert when the Command module executes thegrep MemFree /proc/meminfocommand. The rule uses the<decoded_as>tag to reference theunused-memorydecoder created above:<group name="unused_memory"> <rule id="100003" level="5"> <decoded_as>unused-memory</decoded_as> <description>The system’s free memory is $(free_memory) $(unit_of_measurment).</description> </rule> </group>
Restart the Wazuh manager to apply the configuration changes:
# systemctl restart wazuh-manager
Run the command below to see the JSON alert generated when the Command module runs the
grep MemFree /proc/meminfocommand:# grep "unused_memory" /var/ossec/logs/alerts/alerts.json | /var/ossec/framework/python/bin/python3 -mjson.tool
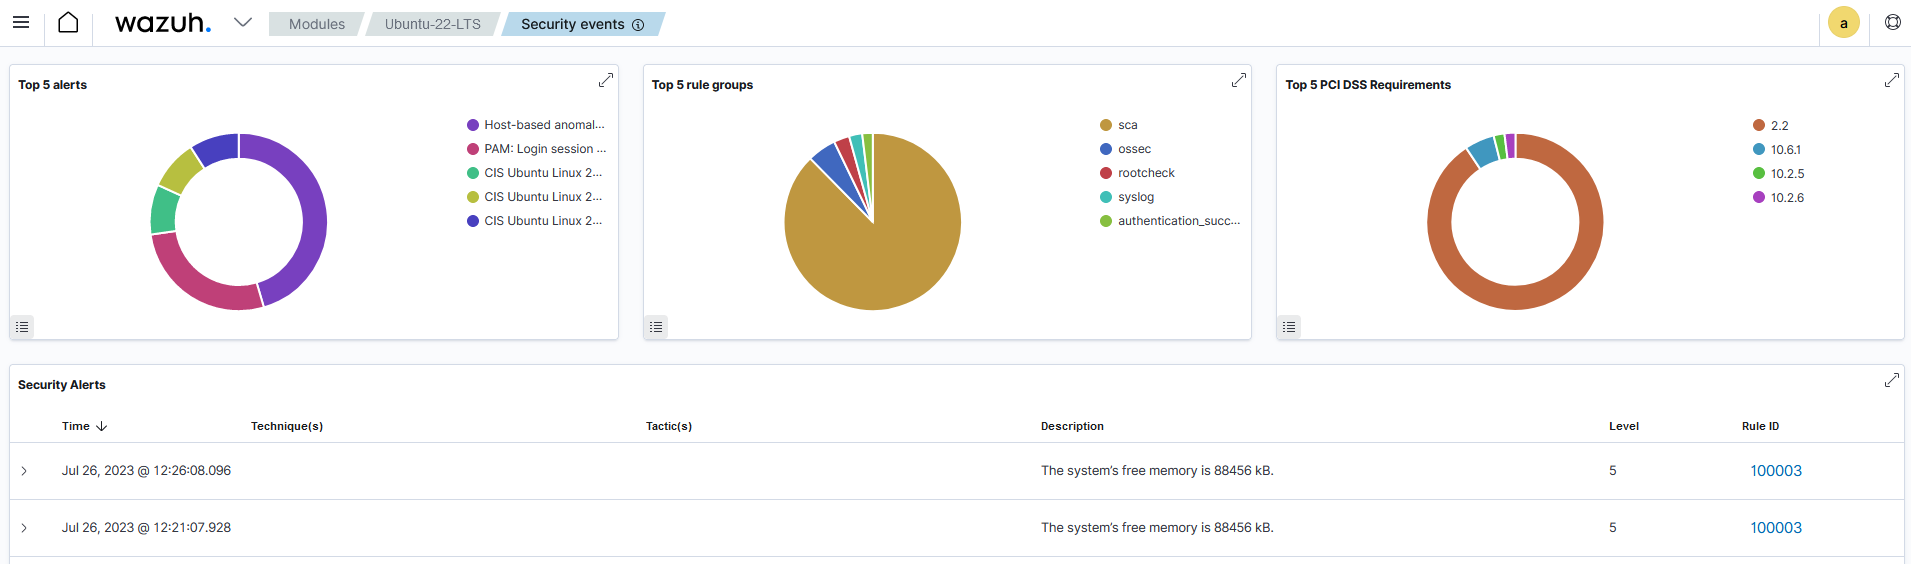
{
    "timestamp": "2023-07-26T09:21:07.928+0000",
    "rule": {
        "level": 5,
        "description": "The system\u2019s free memory is 88456 kB.",
        "id": "100003",
        "firedtimes": 1,
        "mail": false,
        "groups": [
            "unused_memory"
        ]
    },
    "agent": {
        "id": "002",
        "name": "Ubuntu-22-LTS",
        "ip": "10.0.2.15"
    },
    "manager": {
        "name": "wazuh-server"
    },
    "id": "1690363267.663636",
    "full_log": "MemFree:           88456 kB",
    "decoder": {
        "name": "unused-memory"
    },
    "data": {
        "free_memory": "88456",
        "unit_of_measurment": "kB"
    },
    "location": "command_unused_memory"
}
Wazuh dashboard
Click the upper-left menu icon ☰ to open the options, go to Agents management > Summary and select the monitored Linux endpoint. Then, navigate to the Threat Hunting module to view the alerts generated when the Command module runs the grep MemFree /proc/meminfo command.