Wazuh server API use cases
This guide explains practical ways to use the Wazuh server API to manage and automate core security operations. It shows how administrators can configure Wazuh modules, manage custom rules and decoders, and perform Wazuh agent tasks directly from the dashboard or from the command line of an authorized endpoint. The guide includes step-by-step examples, request formats, and sample responses to help streamline Wazuh server administration through the API.
Using the Wazuh dashboard
The following use cases demonstrate how to manage the Wazuh server, Wazuh agent, rules, and decoders, and automate security workflows using the Wazuh server API via the Wazuh dashboard.
Wazuh server management
You can use the Wazuh server API to manage and update the Wazuh manager configuration and retrieve information about the Wazuh server, including the status of the Wazuh daemon. Review the API manager reference for more information on managing the Wazuh manager using the Wazuh server API.
The following use cases demonstrate how to perform various operations on the Wazuh server.
Retrieving the Wazuh manager daemon status
Use the Wazuh server API to retrieve the current status of all Wazuh manager daemons. The /manager/status endpoint provides a quick overview of which services are running, stopped, or unavailable, helping administrators verify the health of the Wazuh manager and troubleshoot operational issues.
Follow the steps below to retrieve the Wazuh daemon status:
Navigate to Server management > Dev Tools to open the Wazuh server API Console.
Set the method and endpoint as
GET /manager/status.Click the play button to execute the request. A response similar to the one below is returned:
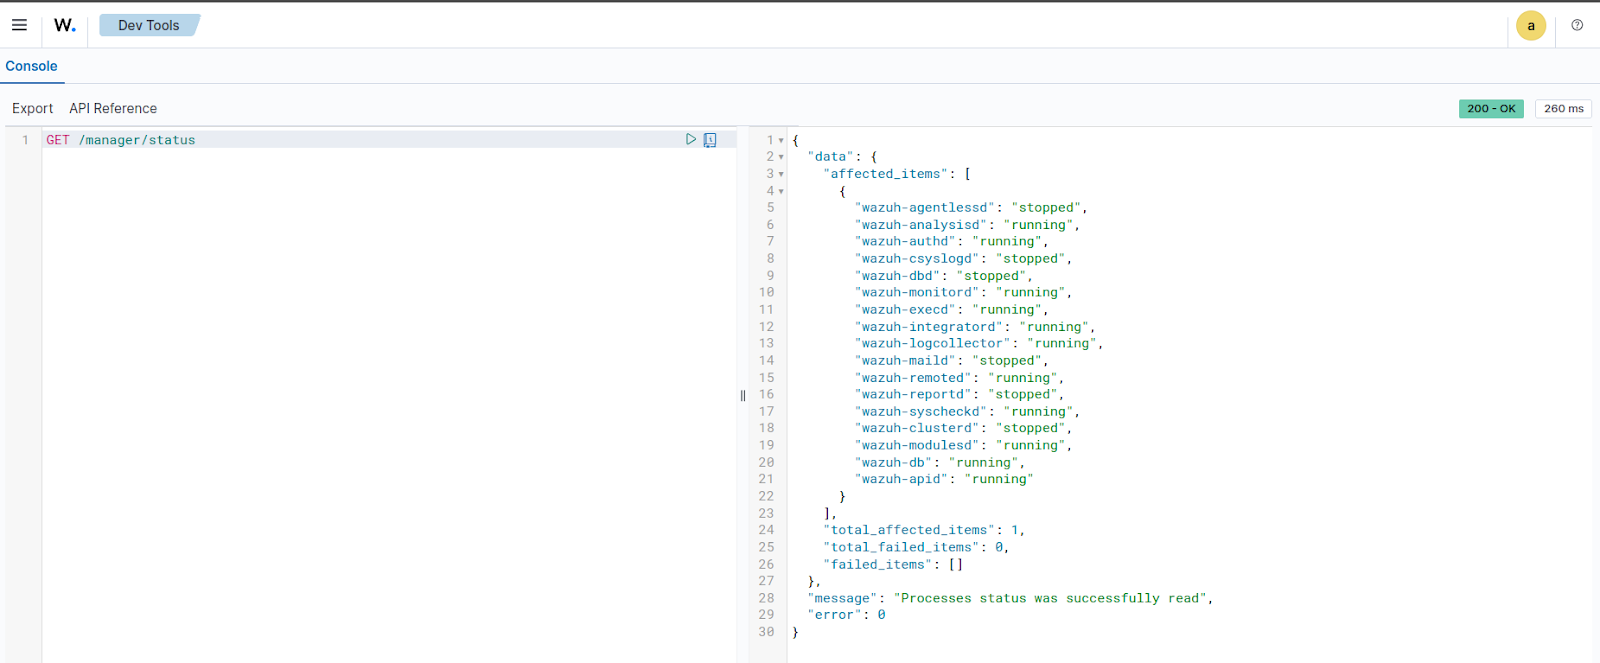
{
  "data": {
    "affected_items": [
      {
        "wazuh-agentlessd": "stopped",
        "wazuh-analysisd": "running",
        "wazuh-authd": "running",
        "wazuh-csyslogd": "stopped",
        "wazuh-dbd": "stopped",
        "wazuh-monitord": "running",
        "wazuh-execd": "running",
        "wazuh-integratord": "stopped",
        "wazuh-logcollector": "running",
        "wazuh-maild": "stopped",
        "wazuh-remoted": "running",
        "wazuh-reportd": "stopped",
        "wazuh-syscheckd": "running",
        "wazuh-clusterd": "stopped",
        "wazuh-modulesd": "running",
        "wazuh-db": "running",
        "wazuh-apid": "running"
      }
    ],
    "total_affected_items": 1,
    "total_failed_items": 0,
    "failed_items": []
  },
  "message": "Processes status was successfully read",
  "error": 0
}
Retrieving Wazuh manager daemon statistics
You can use the Wazuh server API to retrieve real-time statistics for the Wazuh manager daemon. The /manager/daemons/stats endpoint returns detailed metrics for components such as wazuh-remoted, wazuh-analysisd, and wazuh-db. The information retrieved from these daemons helps administrators monitor event processing, queue usage, and database activity on the manager.
Follow the steps below to retrieve Wazuh daemon statistics:
Navigate to Server management > Dev Tools to open the Wazuh server API Console.
Set the method and endpoint as
GET /manager/daemons/stats.Click the play button to execute the request. A response similar to the one below is returned:
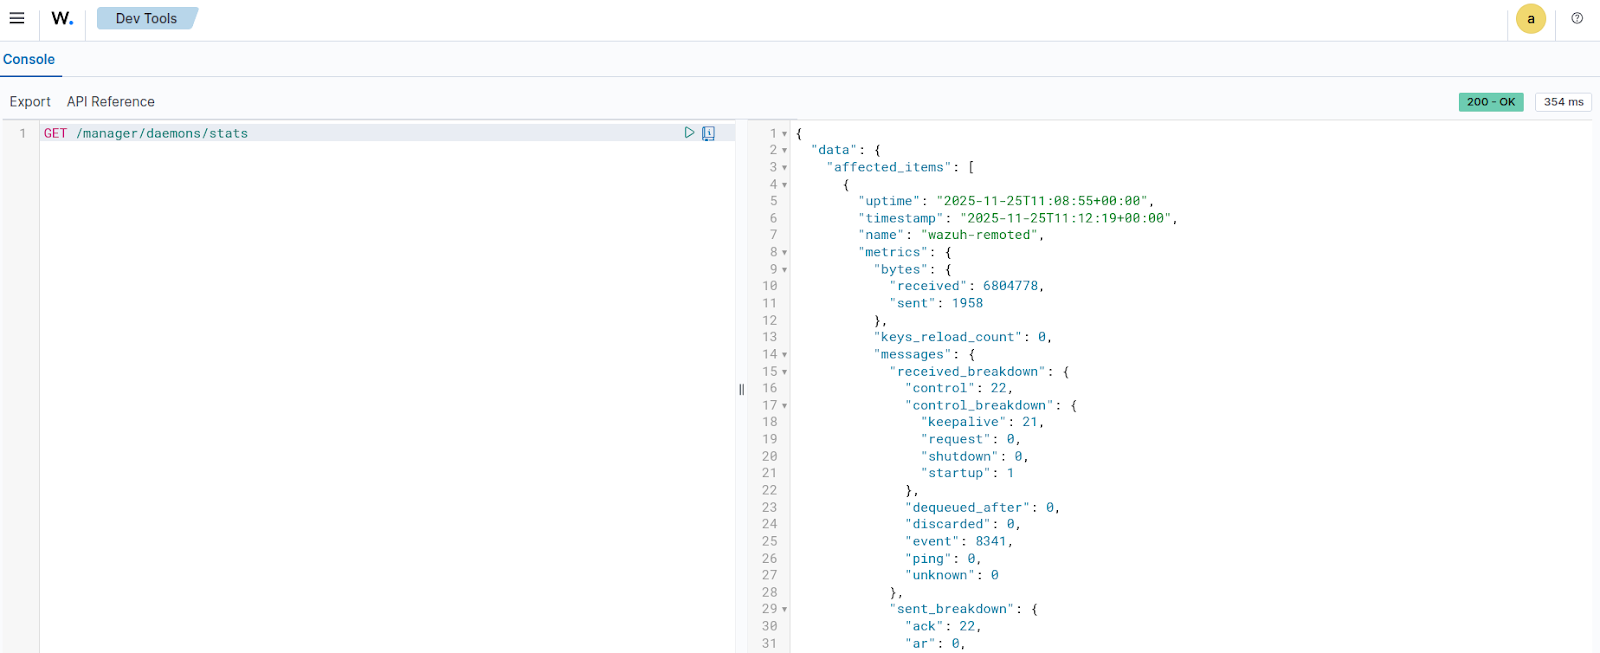
{ "data": { "affected_items": [ { "uptime": "2025-11-25T11:08:55+00:00", "timestamp": "2025-11-25T11:12:19+00:00", "name": "wazuh-remoted", "metrics": { "bytes": { "received": 6804778, "sent": 1958 }, "keys_reload_count": 0, "messages": { "received_breakdown": { "control": 22, "control_breakdown": { "keepalive": 21, "request": 0, "shutdown": 0, "startup": 1 }, "dequeued_after": 0, "discarded": 0, "event": 8341, "ping": 0, "unknown": 0 }, "sent_breakdown": { "ack": 22, "ar": 0, "discarded": 0, "request": 0, "sca": 0, "shared": 0 } }, "queues": { "received": { "size": 131072, "usage": 0 } }, "tcp_sessions": 1, "control_messages_queue_usage": 0, "control_messages_queue_breakdown": { "inserted": 22, "replaced": 0, "processed": 22 } } }, { "uptime": "2025-11-25T11:08:56+00:00", "timestamp": "2025-11-25T11:12:19+00:00", "name": "wazuh-analysisd", "metrics": { "bytes": { "received": 14507032 }, "events": { "processed": 8690, "received": 9849, "received_breakdown": { "decoded_breakdown": { "agent": 0, "agentless": 0, "dbsync": 1155, "integrations_breakdown": { "virustotal": 0 }, "modules_breakdown": { "aws": 0, "azure": 0, "ciscat": 0, "command": 0, "docker": 0, "gcp": 0, "github": 0, "logcollector_breakdown": { "eventchannel": 7039, "eventlog": 0, "macos": 0, "others": 82 }, "office365": 0, "ms-graph": 0, "oscap": 0, "osquery": 0, "rootcheck": 3, "sca": 288, "syscheck": 615, "syscollector": 666, "upgrade": 0, "vulnerability": 0 }, "monitor": 1, "remote": 0, "syslog": 0 }, "dropped_breakdown": { "agent": 0, "agentless": 0, "dbsync": 0, "integrations_breakdown": { "virustotal": 0 }, "modules_breakdown": { "aws": 0, "azure": 0, "ciscat": 0, "command": 0, "docker": 0, "gcp": 0, "github": 0, "logcollector_breakdown": { "eventchannel": 0, "eventlog": 0, "macos": 0, "others": 0 }, "office365": 0, "ms-graph": 0, "oscap": 0, "osquery": 0, "rootcheck": 0, "sca": 0, "syscheck": 0, "syscollector": 0, "upgrade": 0, "vulnerability": 0 }, "monitor": 0, "remote": 0, "syslog": 0 } }, "written_breakdown": { "alerts": 1142, "archives": 0, "firewall": 0, "fts": 0, "stats": 1 } }, "queues": { "alerts": { "size": 16384, "usage": 0 }, "archives": { "size": 16384, "usage": 0 }, "dbsync": { "size": 16384, "usage": 0 }, "eventchannel": { "size": 16384, "usage": 0 }, "firewall": { "size": 16384, "usage": 0 }, "fts": { "size": 16384, "usage": 0 }, "hostinfo": { "size": 16384, "usage": 0 }, "others": { "size": 16384, "usage": 0 }, "processed": { "size": 16384, "usage": 0 }, "rootcheck": { "size": 16384, "usage": 0 }, "sca": { "size": 16384, "usage": 0 }, "stats": { "size": 16384, "usage": 0 }, "syscheck": { "size": 16384, "usage": 0 }, "syscollector": { "size": 16384, "usage": 0 }, "upgrade": { "size": 16384, "usage": 0 } } } }, { "uptime": "2025-11-25T10:54:56+00:00", "timestamp": "2025-11-25T11:12:19+00:00", "name": "wazuh-db", "metrics": { "queries": { "received": 4624, "received_breakdown": { "agent": 3026, "agent_breakdown": { "db": { "begin": 0, "close": 0, "commit": 0, "remove": 0, "sql": 0, "vacuum": 0, "get_fragmentation": 0, "sleep": 0 }, "tables": { "ciscat": { "ciscat": 0 }, "rootcheck": { "rootcheck": 3 }, "sca": { "sca": 586 }, "sync": { "dbsync": 666 }, "syscheck": { "fim_file": 249, "fim_registry": 0, "fim_registry_key": 1, "fim_registry_value": 1, "syscheck": 615 }, "syscollector": { "syscollector_hotfixes": 2, "syscollector_hwinfo": 3, "syscollector_network_address": 13, "syscollector_network_iface": 12, "syscollector_network_protocol": 8, "syscollector_osinfo": 3, "syscollector_packages": 45, "syscollector_ports": 190, "syscollector_processes": 582, "syscollector_users": 15, "syscollector_groups": 2, "syscollector_browser_extensions": 27, "syscollector_services": 2, "deprecated": { "hardware": 0, "hotfix": 0, "netaddr": 0, "netinfo": 0, "netproto": 0, "osinfo": 1, "package": 0, "port": 0, "process": 0 } } } }, "global": 195, "global_breakdown": { "db": { "backup": 0, "sql": 20, "vacuum": 0, "get_fragmentation": 0, "sleep": 0 }, "tables": { "agent": { "delete-agent": 0, "disconnect-agents": 0, "find-agent": 0, "get-agent-info": 13, "get-agents-by-connection-status": 80, "get-all-agents": 1, "get-distinct-groups": 21, "get-groups-integrity": 0, "recalculate-agent-group-hashes": 0, "insert-agent": 0, "reset-agents-connection": 1, "select-agent-group": 21, "select-agent-name": 2, "set-agent-groups": 0, "sync-agent-groups-get": 0, "sync-agent-info-get": 0, "sync-agent-info-set": 0, "update-agent-data": 22, "update-agent-name": 1, "update-connection-status": 0, "update-status-code": 0, "update-keepalive": 1 }, "belongs": { "get-group-agents": 0, "select-group-belong": 0 }, "group": { "delete-group": 0, "find-group": 2, "insert-agent-group": 0, "select-groups": 1 }, "labels": { "get-labels": 9 } } }, "mitre": 1400, "mitre_breakdown": { "db": { "sql": 1400 } }, "task": 3, "task_breakdown": { "db": { "sql": 0 }, "tables": { "tasks": { "delete_old": 1, "set_timeout": 1, "upgrade": 0, "upgrade_cancel_tasks": 1, "upgrade_custom": 0, "upgrade_get_status": 0, "upgrade_result": 0, "upgrade_update_status": 0 } } }, "wazuhdb": 0, "wazuhdb_breakdown": { "db": { "remove": 0 } } } }, "time": { "execution": 50016, "execution_breakdown": { "agent": 49617, "agent_breakdown": { "db": { "open": 33872, "begin": 0, "close": 0, "commit": 0, "remove": 0, "sql": 0, "vacuum": 0, "get_fragmentation": 0, "sleep": 0 }, "tables": { "ciscat": { "ciscat": 0 }, "rootcheck": { "rootcheck": 50 }, "sca": { "sca": 245 }, "sync": { "dbsync": 800 }, "syscheck": { "fim_file": 393, "fim_registry": 0, "fim_registry_key": 364, "fim_registry_value": 751, "syscheck": 12174 }, "syscollector": { "syscollector_hotfixes": 14, "syscollector_hwinfo": 81, "syscollector_network_address": 2, "syscollector_network_iface": 12, "syscollector_network_protocol": 32, "syscollector_osinfo": 14, "syscollector_packages": 277, "syscollector_ports": 177, "syscollector_processes": 348, "syscollector_groups": 23, "syscollector_users": 44, "syscollector_browser_extensions": 176, "syscollector_services": 128, "deprecated": { "hardware": 0, "hotfix": 0, "netaddr": 0, "netinfo": 0, "netproto": 0, "osinfo": 0, "package": 0, "port": 0, "process": 0 } } } }, "global": 78, "global_breakdown": { "db": { "open": 10, "backup": 0, "sql": 9, "vacuum": 0, "get_fragmentation": 0, "sleep": 0 }, "tables": { "agent": { "delete-agent": 0, "disconnect-agents": 0, "find-agent": 0, "get-agent-info": 5, "get-agents-by-connection-status": 26, "get-all-agents": 0, "get-distinct-groups": 6, "get-groups-integrity": 0, "recalculate-agent-group-hashes": 0, "insert-agent": 0, "reset-agents-connection": 0, "select-agent-group": 2, "select-agent-name": 0, "set-agent-groups": 0, "sync-agent-groups-get": 0, "sync-agent-info-get": 0, "sync-agent-info-set": 0, "update-agent-data": 15, "update-agent-name": 0, "update-connection-status": 0, "update-status-code": 0, "update-keepalive": 0 }, "belongs": { "get-group-agents": 0, "select-group-belong": 0 }, "group": { "delete-group": 0, "find-group": 0, "insert-agent-group": 0, "select-groups": 0 }, "labels": { "get-labels": 0 } } }, "mitre": 355, "mitre_breakdown": { "db": { "sql": 355 } }, "task": 6, "task_breakdown": { "db": { "sql": 0 }, "tables": { "tasks": { "delete_old": 3, "set_timeout": 2, "upgrade": 0, "upgrade_cancel_tasks": 0, "upgrade_custom": 0, "upgrade_get_status": 0, "upgrade_result": 0, "upgrade_update_status": 0 } } }, "wazuhdb": 0, "wazuhdb_breakdown": { "db": { "remove": 0 } } } } } } ], "total_affected_items": 3, "total_failed_items": 0, "failed_items": [] }, "message": "Statistical information for each daemon was successfully read", "error": 0 }
Retrieving Wazuh manager logs
You can use the Wazuh server API to retrieve log messages generated by the Wazuh manager. The /manager/logs endpoint provides insight into module activity, scan progress, errors, warnings, and other operational events. The endpoint helps troubleshoot issues with modules such as Syscollector, Rootcheck, SCA, or File Integrity Monitoring (FIM). It also helps verify that scheduled scans and evaluations are running correctly.
Follow the steps below to retrieve the last 100 log messages generated by the Wazuh manager:
Navigate to Server management > Dev Tools to open the Wazuh server API Console.
Set the method and endpoint as
GET /manager/logs?limit=100.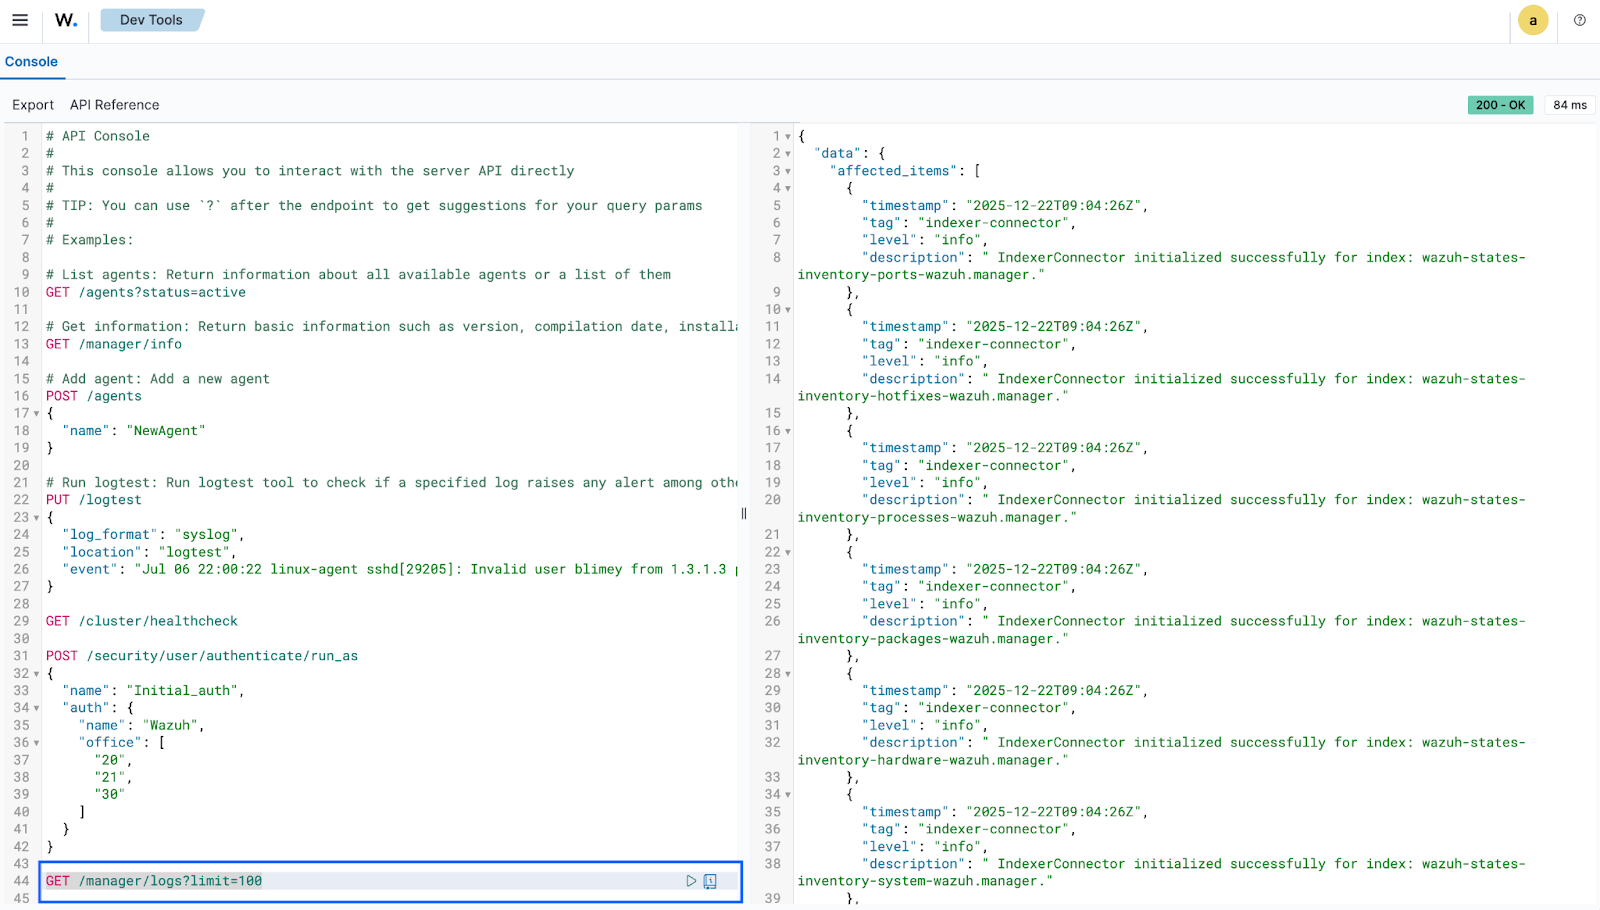
Click the play button to execute the request. A response similar to the one below is returned:
{
  "data": {
    "affected_items": [
      {
        "timestamp": "2025-11-25T12:18:38Z",
        "tag": "wazuh-integratord",
        "level": "debug",
        "description": " Command ran successfully."
      },
      {
        "timestamp": "2025-11-25T12:18:38Z",
        "tag": "wazuh-integratord",
        "level": "debug",
        "description": " Sending new alert."
      },
      {
        "timestamp": "2025-11-25T12:18:23Z",
        "tag": "wazuh-integratord",
        "level": "debug",
        "description": " Command ran successfully."
      },
      {
        "timestamp": "2025-11-25T12:18:23Z",
        "tag": "wazuh-integratord",
        "level": "debug",
        "description": " Sending new alert."
      },
      {
        "timestamp": "2025-11-25T12:18:08Z",
        "tag": "wazuh-integratord",
        "level": "debug",
        "description": " Command ran successfully."
      },
      {
        "timestamp": "2025-11-25T12:18:08Z",
        "tag": "wazuh-integratord",
        "level": "debug",
        "description": " Sending new alert."
      },
      {
        "timestamp": "2025-11-25T12:17:52Z",
        "tag": "wazuh-integratord",
        "level": "debug",
        "description": " Command ran successfully."
      },
      {
        "timestamp": "2025-11-25T12:17:52Z",
        "tag": "wazuh-integratord",
        "level": "debug",
        "description": " Sending new alert."
      },
      {
        "timestamp": "2025-11-25T12:17:37Z",
        "tag": "wazuh-integratord",
        "level": "debug",
        "description": " Command ran successfully."
      },
      {
        "timestamp": "2025-11-25T12:17:37Z",
        "tag": "wazuh-integratord",
        "level": "debug",
        "description": " Sending new alert."
      },
      {
        "timestamp": "2025-11-25T12:17:22Z",
        "tag": "wazuh-integratord",
        "level": "debug",
        "description": " Command ran successfully."
      },
      {
        "timestamp": "2025-11-25T12:17:22Z",
        "tag": "wazuh-integratord",
        "level": "debug",
        "description": " Sending new alert."
      },
      {
        "timestamp": "2025-11-25T12:17:19Z",
        "tag": "wazuh-modulesd:vulnerability-scanner",
        "level": "info",
        "description": " Triggered a re-scan after content update."
      },
      {
        "timestamp": "2025-11-25T12:17:19Z",
        "tag": "wazuh-modulesd:vulnerability-scanner",
        "level": "info",
        "description": " Feed update process completed."
      },
      {
        "timestamp": "2025-11-25T12:17:06Z",
        "tag": "wazuh-integratord",
        "level": "debug",
        "description": " Command ran successfully."
      },
      {
        "timestamp": "2025-11-25T12:17:06Z",
        "tag": "wazuh-integratord",
        "level": "debug",
        "description": " Sending new alert."
      },
      {
        "timestamp": "2025-11-25T12:16:50Z",
        "tag": "wazuh-integratord",
        "level": "debug",
        "description": " Command ran successfully."
      },
      {
        "timestamp": "2025-11-25T12:16:50Z",
        "tag": "wazuh-integratord",
        "level": "debug",
        "description": " Sending new alert."
      },
      {
        "timestamp": "2025-11-25T12:16:34Z",
        "tag": "wazuh-integratord",
        "level": "debug",
        "description": " Command ran successfully."
      },
      {
        "timestamp": "2025-11-25T12:16:34Z",
        "tag": "wazuh-integratord",
        "level": "debug",
        "description": " Sending new alert."
      },
      {
        "timestamp": "2025-11-25T12:16:19Z",
        "tag": "wazuh-integratord",
        "level": "debug",
        "description": " Command ran successfully."
      },
      {
        "timestamp": "2025-11-25T12:16:19Z",
        "tag": "wazuh-integratord",
        "level": "debug",
        "description": " Sending new alert."
      },
      {
        "timestamp": "2025-11-25T12:16:04Z",
        "tag": "wazuh-integratord",
        "level": "debug",
        "description": " Command ran successfully."
      },
      {
        "timestamp": "2025-11-25T12:16:04Z",
        "tag": "wazuh-integratord",
        "level": "debug",
        "description": " Sending new alert."
      },
      {
        "timestamp": "2025-11-25T12:15:48Z",
        "tag": "wazuh-integratord",
        "level": "debug",
        "description": " Command ran successfully."
      },
      {
        "timestamp": "2025-11-25T12:15:48Z",
        "tag": "wazuh-integratord",
        "level": "debug",
        "description": " Sending new alert."
      },
      {
        "timestamp": "2025-11-25T12:15:32Z",
        "tag": "wazuh-integratord",
        "level": "debug",
        "description": " Command ran successfully."
      },
      {
        "timestamp": "2025-11-25T12:15:32Z",
        "tag": "wazuh-integratord",
        "level": "debug",
        "description": " Sending new alert."
      },
      {
        "timestamp": "2025-11-25T12:15:17Z",
        "tag": "wazuh-integratord",
        "level": "debug",
        "description": " Command ran successfully."
      },
      {
        "timestamp": "2025-11-25T12:15:17Z",
        "tag": "wazuh-integratord",
        "level": "debug",
        "description": " Sending new alert."
      },
      {
        "timestamp": "2025-11-25T12:15:00Z",
        "tag": "wazuh-integratord",
        "level": "debug",
        "description": " Command ran successfully."
      },
      {
        "timestamp": "2025-11-25T12:15:00Z",
        "tag": "wazuh-integratord",
        "level": "debug",
        "description": " Sending new alert."
      },
      {
        "timestamp": "2025-11-25T12:14:44Z",
        "tag": "wazuh-integratord",
        "level": "debug",
        "description": " Command ran successfully."
      },
      {
        "timestamp": "2025-11-25T12:14:44Z",
        "tag": "wazuh-integratord",
        "level": "debug",
        "description": " Sending new alert."
      },
      {
        "timestamp": "2025-11-25T12:14:29Z",
        "tag": "wazuh-integratord",
        "level": "debug",
        "description": " Command ran successfully."
      },
      {
        "timestamp": "2025-11-25T12:14:29Z",
        "tag": "wazuh-integratord",
        "level": "debug",
        "description": " Sending new alert."
      },
      {
        "timestamp": "2025-11-25T12:14:13Z",
        "tag": "wazuh-integratord",
        "level": "debug",
        "description": " Command ran successfully."
      },
      {
        "timestamp": "2025-11-25T12:14:13Z",
        "tag": "wazuh-integratord",
        "level": "debug",
        "description": " Sending new alert."
      },
      {
        "timestamp": "2025-11-25T12:13:59Z",
        "tag": "wazuh-rootcheck",
        "level": "info",
        "description": " Ending rootcheck scan."
      },
      {
        "timestamp": "2025-11-25T12:13:56Z",
        "tag": "wazuh-integratord",
        "level": "debug",
        "description": " Command ran successfully."
      },
      {
        "timestamp": "2025-11-25T12:13:56Z",
        "tag": "wazuh-integratord",
        "level": "debug",
        "description": " Sending new alert."
      },
      {
        "timestamp": "2025-11-25T12:13:54Z",
        "tag": "wazuh-syscheckd",
        "level": "info",
        "description": " netstat not available. Skipping port check."
      },
      {
        "timestamp": "2025-11-25T12:13:40Z",
        "tag": "wazuh-integratord",
        "level": "debug",
        "description": " Command ran successfully."
      },
      {
        "timestamp": "2025-11-25T12:13:40Z",
        "tag": "wazuh-integratord",
        "level": "debug",
        "description": " Sending new alert."
      },
      {
        "timestamp": "2025-11-25T12:13:24Z",
        "tag": "wazuh-integratord",
        "level": "debug",
        "description": " Command ran successfully."
      },
      {
        "timestamp": "2025-11-25T12:13:24Z",
        "tag": "wazuh-integratord",
        "level": "debug",
        "description": " Sending new alert."
      },
      {
        "timestamp": "2025-11-25T12:13:07Z",
        "tag": "wazuh-integratord",
        "level": "debug",
        "description": " Command ran successfully."
      },
      {
        "timestamp": "2025-11-25T12:13:07Z",
        "tag": "wazuh-integratord",
        "level": "debug",
        "description": " Sending new alert."
      },
      {
        "timestamp": "2025-11-25T12:12:51Z",
        "tag": "wazuh-integratord",
        "level": "debug",
        "description": " Command ran successfully."
      },
      {
        "timestamp": "2025-11-25T12:12:51Z",
        "tag": "wazuh-integratord",
        "level": "debug",
        "description": " Sending new alert."
      },
      {
        "timestamp": "2025-11-25T12:12:36Z",
        "tag": "wazuh-integratord",
        "level": "debug",
        "description": " Command ran successfully."
      },
      {
        "timestamp": "2025-11-25T12:12:36Z",
        "tag": "wazuh-integratord",
        "level": "debug",
        "description": " Sending new alert."
      },
      {
        "timestamp": "2025-11-25T12:12:19Z",
        "tag": "wazuh-integratord",
        "level": "debug",
        "description": " Command ran successfully."
      },
      {
        "timestamp": "2025-11-25T12:12:19Z",
        "tag": "wazuh-integratord",
        "level": "debug",
        "description": " Sending new alert."
      },
      {
        "timestamp": "2025-11-25T12:12:04Z",
        "tag": "wazuh-integratord",
        "level": "debug",
        "description": " Command ran successfully."
      },
      {
        "timestamp": "2025-11-25T12:12:04Z",
        "tag": "wazuh-integratord",
        "level": "debug",
        "description": " Sending new alert."
      },
      {
        "timestamp": "2025-11-25T12:11:48Z",
        "tag": "wazuh-integratord",
        "level": "debug",
        "description": " Command ran successfully."
      },
      {
        "timestamp": "2025-11-25T12:11:48Z",
        "tag": "wazuh-integratord",
        "level": "debug",
        "description": " Sending new alert."
      },
      {
        "timestamp": "2025-11-25T12:11:32Z",
        "tag": "wazuh-integratord",
        "level": "debug",
        "description": " Command ran successfully."
      },
      {
        "timestamp": "2025-11-25T12:11:32Z",
        "tag": "wazuh-integratord",
        "level": "debug",
        "description": " Sending new alert."
      },
      {
        "timestamp": "2025-11-25T12:11:16Z",
        "tag": "wazuh-integratord",
        "level": "debug",
        "description": " Command ran successfully."
      },
      {
        "timestamp": "2025-11-25T12:11:16Z",
        "tag": "wazuh-integratord",
        "level": "debug",
        "description": " Sending new alert."
      },
      {
        "timestamp": "2025-11-25T12:10:58Z",
        "tag": "wazuh-integratord",
        "level": "debug",
        "description": " Command ran successfully."
      },
      {
        "timestamp": "2025-11-25T12:10:58Z",
        "tag": "wazuh-integratord",
        "level": "debug",
        "description": " Sending new alert."
      },
      {
        "timestamp": "2025-11-25T12:10:42Z",
        "tag": "wazuh-integratord",
        "level": "debug",
        "description": " Command ran successfully."
      },
      {
        "timestamp": "2025-11-25T12:10:42Z",
        "tag": "wazuh-integratord",
        "level": "debug",
        "description": " Sending new alert."
      },
      {
        "timestamp": "2025-11-25T12:10:41Z",
        "tag": "wazuh-syscheckd",
        "level": "info",
        "description": " (6009): File integrity monitoring scan ended."
      },
      {
        "timestamp": "2025-11-25T12:10:41Z",
        "tag": "wazuh-syscheckd",
        "level": "info",
        "description": " FIM sync module started."
      },
      {
        "timestamp": "2025-11-25T12:10:26Z",
        "tag": "wazuh-integratord",
        "level": "debug",
        "description": " Command ran successfully."
      },
      {
        "timestamp": "2025-11-25T12:10:26Z",
        "tag": "wazuh-integratord",
        "level": "debug",
        "description": " Sending new alert."
      },
      {
        "timestamp": "2025-11-25T12:10:14Z",
        "tag": "sca",
        "level": "info",
        "description": " Evaluation finished for policy '/var/ossec/ruleset/sca/cis_ubuntu24-04.yml'"
      },
      {
        "timestamp": "2025-11-25T12:10:14Z",
        "tag": "sca",
        "level": "info",
        "description": " Security Configuration Assessment scan finished. Duration: 76 seconds."
      },
      {
        "timestamp": "2025-11-25T12:10:06Z",
        "tag": "wazuh-integratord",
        "level": "debug",
        "description": " Command ran successfully."
      },
      {
        "timestamp": "2025-11-25T12:10:06Z",
        "tag": "wazuh-integratord",
        "level": "debug",
        "description": " Sending new alert."
      },
      {
        "timestamp": "2025-11-25T12:09:57Z",
        "tag": "wazuh-modulesd:vulnerability-scanner",
        "level": "info",
        "description": " Initiating update feed process."
      },
      {
        "timestamp": "2025-11-25T12:09:41Z",
        "tag": "wazuh-integratord",
        "level": "debug",
        "description": " Command ran successfully."
      },
      {
        "timestamp": "2025-11-25T12:09:41Z",
        "tag": "wazuh-integratord",
        "level": "debug",
        "description": " Sending new alert."
      },
      {
        "timestamp": "2025-11-25T12:09:40Z",
        "tag": "wazuh-modulesd:syscollector",
        "level": "info",
        "description": " Evaluation finished."
      },
      {
        "timestamp": "2025-11-25T12:09:23Z",
        "tag": "indexer-connector",
        "level": "info",
        "description": " IndexerConnector initialized successfully for index: wazuh-states-inventory-services-wazuh-virtualbox."
      },
      {
        "timestamp": "2025-11-25T12:09:19Z",
        "tag": "wazuh-modulesd:vulnerability-scanner",
        "level": "info",
        "description": " Vulnerability scanner module started."
      },
      {
        "timestamp": "2025-11-25T12:09:18Z",
        "tag": "indexer-connector",
        "level": "info",
        "description": " IndexerConnector initialized successfully for index: wazuh-states-inventory-browser-extensions-wazuh-virtualbox."
      },
      {
        "timestamp": "2025-11-25T12:09:18Z",
        "tag": "logger-helper",
        "level": "info",
        "description": " InventoryHarvesterFacade module started."
      },
      {
        "timestamp": "2025-11-25T12:09:17Z",
        "tag": "indexer-connector",
        "level": "info",
        "description": " IndexerConnector initialized successfully for index: wazuh-states-inventory-groups-wazuh-virtualbox."
      },
      {
        "timestamp": "2025-11-25T12:09:16Z",
        "tag": "indexer-connector",
        "level": "info",
        "description": " IndexerConnector initialized successfully for index: wazuh-states-inventory-users-wazuh-virtualbox."
      },
      {
        "timestamp": "2025-11-25T12:09:16Z",
        "tag": "indexer-connector",
        "level": "info",
        "description": " IndexerConnector initialized successfully for index: wazuh-states-vulnerabilities-wazuh-virtualbox."
      },
      {
        "timestamp": "2025-11-25T12:09:13Z",
        "tag": "indexer-connector",
        "level": "info",
        "description": " IndexerConnector initialized successfully for index: wazuh-states-inventory-interfaces-wazuh-virtualbox."
      },
      {
        "timestamp": "2025-11-25T12:09:13Z",
        "tag": "indexer-connector",
        "level": "info",
        "description": " IndexerConnector initialized successfully for index: wazuh-states-inventory-networks-wazuh-virtualbox."
      },
      {
        "timestamp": "2025-11-25T12:09:12Z",
        "tag": "indexer-connector",
        "level": "info",
        "description": " IndexerConnector initialized successfully for index: wazuh-states-inventory-hardware-wazuh-virtualbox."
      },
      {
        "timestamp": "2025-11-25T12:09:12Z",
        "tag": "indexer-connector",
        "level": "info",
        "description": " IndexerConnector initialized successfully for index: wazuh-states-inventory-protocols-wazuh-virtualbox."
      },
      {
        "timestamp": "2025-11-25T12:09:11Z",
        "tag": "indexer-connector",
        "level": "info",
        "description": " IndexerConnector initialized successfully for index: wazuh-states-inventory-ports-wazuh-virtualbox."
      },
      {
        "timestamp": "2025-11-25T12:09:11Z",
        "tag": "indexer-connector",
        "level": "info",
        "description": " IndexerConnector initialized successfully for index: wazuh-states-inventory-hotfixes-wazuh-virtualbox."
      },
      {
        "timestamp": "2025-11-25T12:09:10Z",
        "tag": "indexer-connector",
        "level": "info",
        "description": " IndexerConnector initialized successfully for index: wazuh-states-inventory-processes-wazuh-virtualbox."
      },
      {
        "timestamp": "2025-11-25T12:09:06Z",
        "tag": "indexer-connector",
        "level": "info",
        "description": " IndexerConnector initialized successfully for index: wazuh-states-inventory-system-wazuh-virtualbox."
      },
      {
        "timestamp": "2025-11-25T12:09:04Z",
        "tag": "indexer-connector",
        "level": "info",
        "description": " IndexerConnector initialized successfully for index: wazuh-states-inventory-packages-wazuh-virtualbox."
      },
      {
        "timestamp": "2025-11-25T12:08:59Z",
        "tag": "wazuh-logcollector",
        "level": "info",
        "description": " (9203): Monitoring journal entries."
      },
      {
        "timestamp": "2025-11-25T12:08:58Z",
        "tag": "wazuh-monitord",
        "level": "info",
        "description": " Started (pid: 6696)."
      },
      {
        "timestamp": "2025-11-25T12:08:58Z",
        "tag": "wazuh-modulesd:router",
        "level": "info",
        "description": " Loaded router module."
      },
      {
        "timestamp": "2025-11-25T12:08:58Z",
        "tag": "wazuh-modulesd:content_manager",
        "level": "info",
        "description": " Loaded content_manager module."
      },
      {
        "timestamp": "2025-11-25T12:08:58Z",
        "tag": "wazuh-modulesd:inventory-harvester",
        "level": "info",
        "description": " Loaded Inventory harvester module."
      },
      {
        "timestamp": "2025-11-25T12:08:58Z",
        "tag": "wazuh-modulesd",
        "level": "info",
        "description": " Started (pid: 6706)."
      }
    ],
    "total_affected_items": 284,
    "total_failed_items": 0,
    "failed_items": []
  },
  "message": "Logs were successfully read",
  "error": 0
}
The output above shows a detailed look at the Wazuh manager logs, it contains module activity, scan progress, errors, warnings, and other operational events.
Restarting Wazuh manager cluster
You can use the Wazuh server API to initiate a coordinated restart of the manager nodes within your environment. The /cluster/restart endpoint allows you to trigger a restart across the cluster to ensure that configuration changes or updates are properly applied. This endpoint is particularly useful for maintaining synchronization across the master and worker nodes without having to manually access each server's command line. It also helps verify that the cluster can gracefully reload its services and resume normal communication and data processing.
Follow the steps below to restart the Wazuh server cluster nodes:
Navigate to Server management > Dev Tools to open the Wazuh server API Console.
Set the method and endpoint as
PUT /cluster/restart.Click the play button to execute the request. A response similar to the one below is returned:
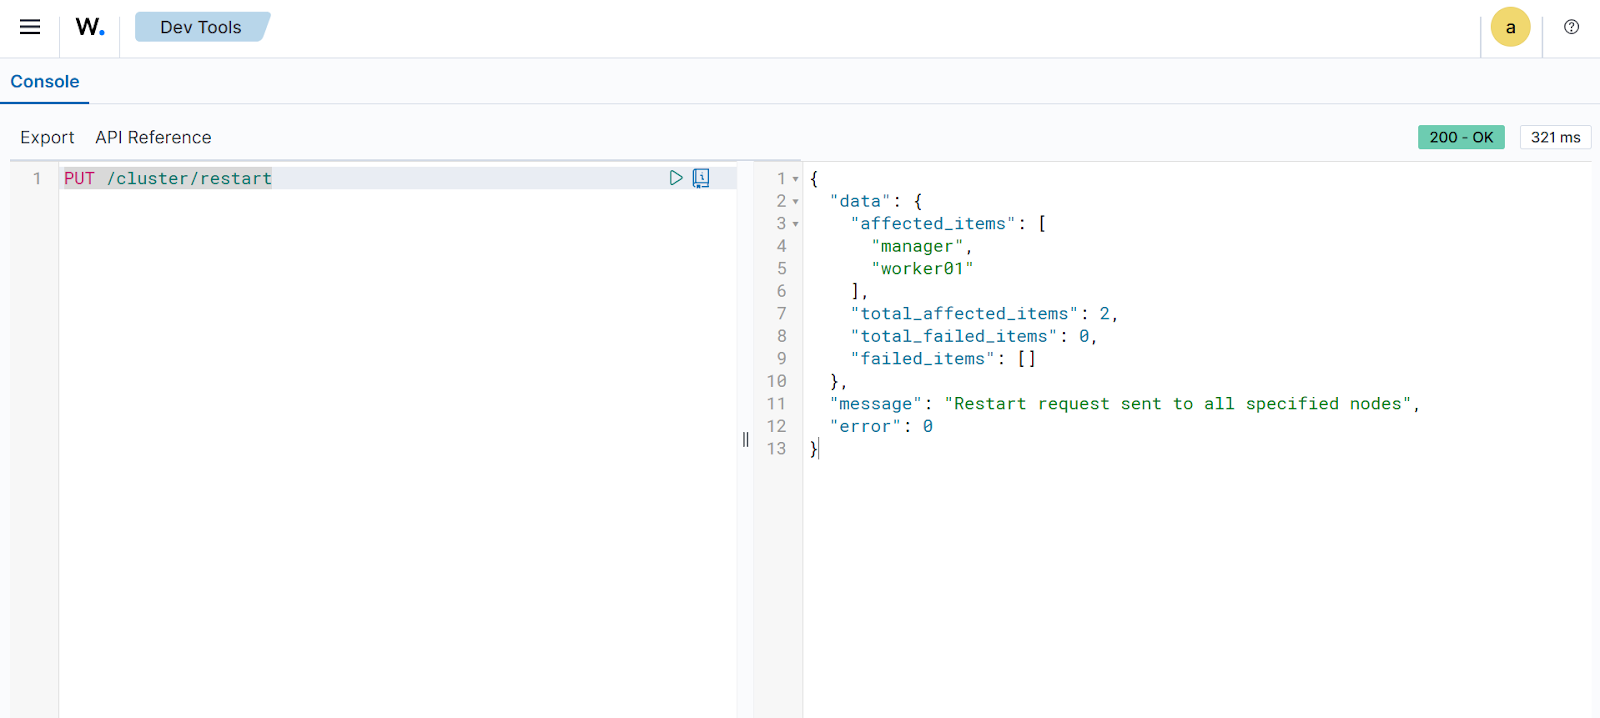
{
  "data": {
    "affected_items": [
      "manager",
      "worker01"
    ],
    "total_affected_items": 2,
    "total_failed_items": 0,
    "failed_items": []
  },
  "message": "Restart request sent to all specified nodes",
  "error": 0
}
The output above confirms the successful execution of the cluster restart command across your environment. It shows the status of each node as the restart is triggered, ensuring that all manager services are synchronized and up to date.
Wazuh agent management
You can use the Wazuh server API to manage Wazuh agents, including enrolling, querying, and removing them from the Wazuh environment. Review the API reference to find out more about managing Wazuh agents using the Wazuh server API.
The following use cases demonstrate how to perform various operations on Wazuh agents.
Generating Wazuh agent enrollment key
Follow the steps below to generate a key for enrolling a new Wazuh agent:
Navigate to Server management > Dev Tools, then paste the following query:
POST /agents
{
  "name": "UBUNTU_AGENT_01"
}
Where:
UBUNTU_AGENT_01is a unique name for the Wazuh agent.
This enrolls the Wazuh agent under the specified name and generates a key that maps the Wazuh agent to the Wazuh manager.
Click the play button to execute the request. The Wazuh server responds with an enrollment token, which can be used to enroll a Wazuh agent:
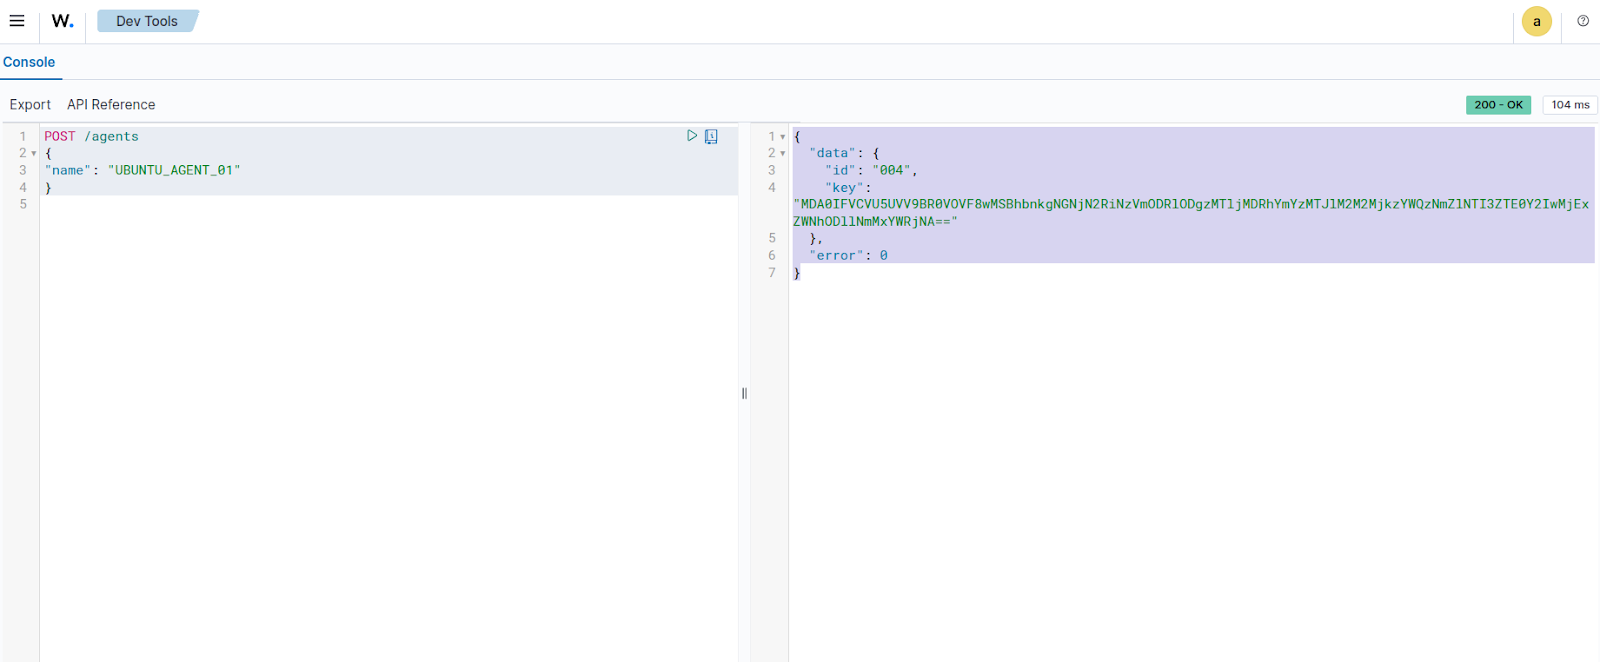
{
  "data": {
    "id": "004",
    "key": "MDA0IFVCVU5UVV9BR0VOVF8wMSBhbnkgNGNjN2RiNzVmODRlODgzMTljMDRhYmYzMTJlM2M2MjkzYWQzNmZlNTI3ZTE0Y2IwMjExZWNhODllNmMxYWRjNA=="
  },
  "error": 0
}
The output above shows a Wazuh agent enrollment key that can be used to register a new Wazuh agent.
Querying the Wazuh agents
The /agents endpoint queries all connected Wazuh agents to gather valuable information about them. For example, we can query for all inactive Wazuh agents. This is useful for troubleshooting Wazuh agent health issues.
Navigate to Server management > Dev Tools, then paste the following query:
GET /agents?status=disconnected,pending,never_connected&select=ip,name
Click the play button to execute the request. This returns information about the IP and enrolled name of all inactive Wazuh agents:
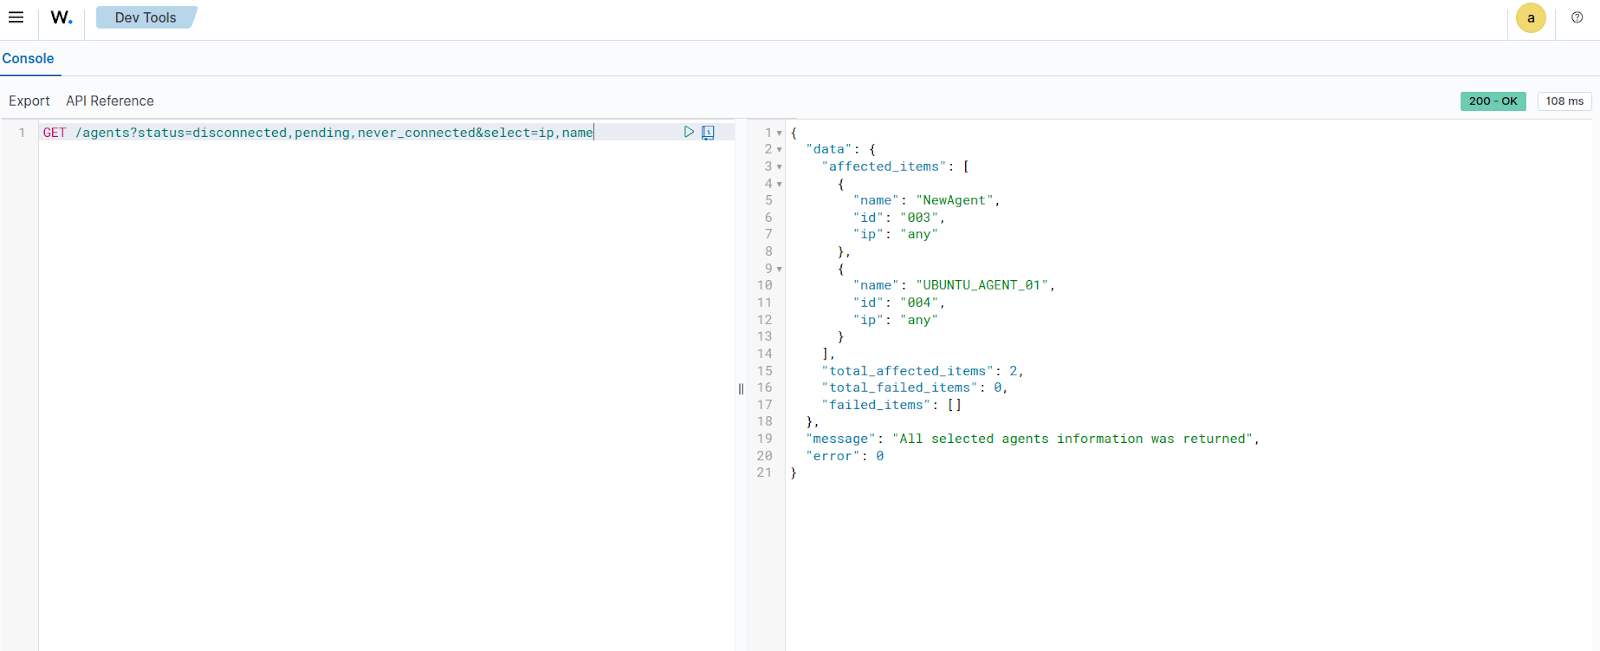
{
  "data": {
    "affected_items": [
      {
        "name": "NewAgent",
        "id": "003",
        "ip": "any"
      },
      {
        "name": "UBUNTU_AGENT_01",
        "id": "004",
        "ip": "any"
      }
    ],
    "total_affected_items": 2,
    "total_failed_items": 0,
    "failed_items": []
  },
  "message": "All selected agents information was returned",
  "error": 0
}
The output above shows two Wazuh agents with IP value
anythat were either disconnected, pending, or never connected.
Restarting a Wazuh agent remotely
Wazuh agents can be restarted using the Wazuh server API from the Wazuh dashboard. Follow the steps below to restart a Wazuh agent.
Navigate to Server management > Dev Tools, then paste the following query:
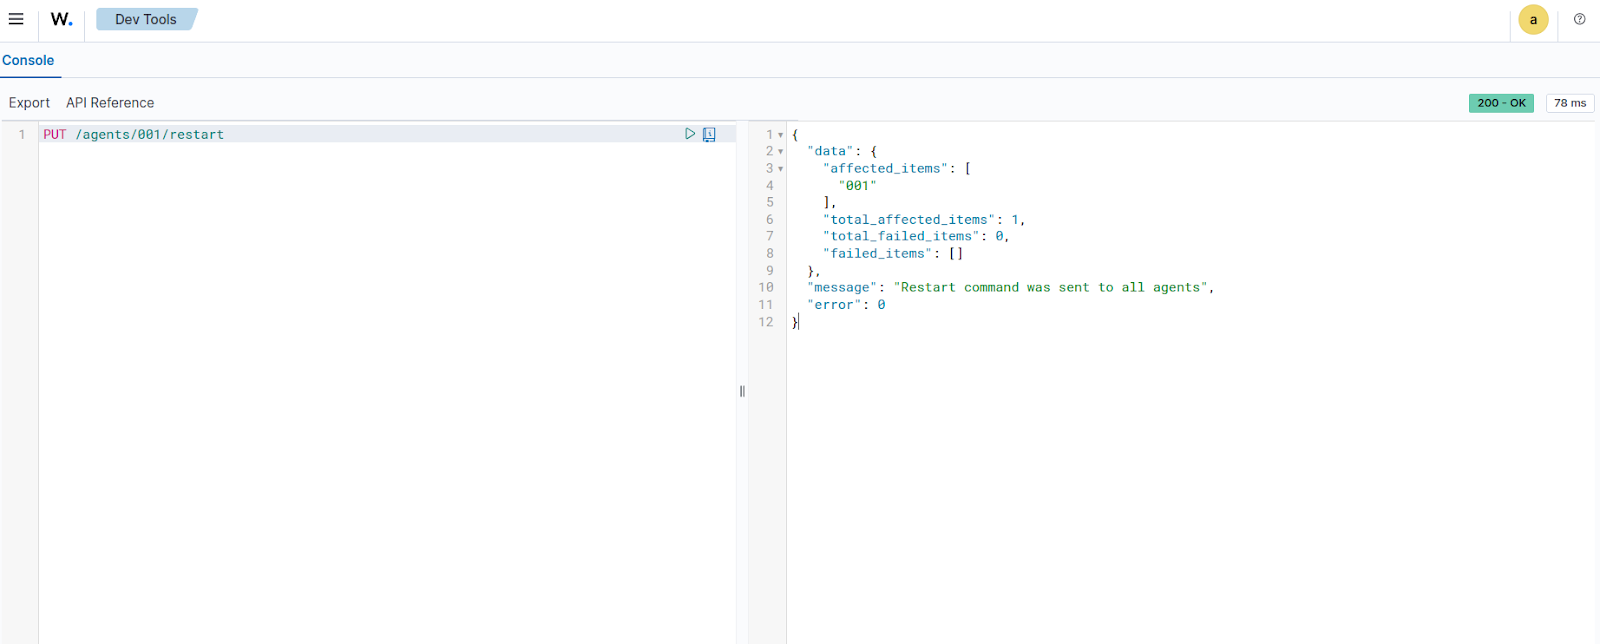
PUT /agents/001/restart
Where:
001is the ID of the Wazuh agent that is to be restarted.
Click the play button to execute the request. A response similar to the one below is received:
{
  "data": {
    "affected_items": [
      {
        "name": "NewAgent",
        "id": "003",
        "ip": "any"
      },
      {
        "name": "UBUNTU_AGENT_01",
        "id": "004",
        "ip": "any"
      }
    ],
    "total_affected_items": 2,
    "total_failed_items": 0,
    "failed_items": []
  },
  "message": "All selected agents information was returned",
  "error": 0
}
The output above shows the Wazuh agent that was restarted.
Upgrading the Wazuh agents
To upgrade a Wazuh agent, can use the /agents/upgrade endpoint. We can specify the IDs of Wazuh agents to upgrade (separated by commas), or specify all to update all enrolled Wazuh agents.
Navigate to Server management > Dev Tools, then paste the following query:
PUT /agents/upgrade?agents_list=001
Where:
001is the ID of the Wazuh agent that is to be restarted. This parameter accepts a comma-separated list of Wazuh agent IDs. We can also useallto send the request to all Wazuh agents.
Click the play button to execute the request. A response similar to the one below is received:
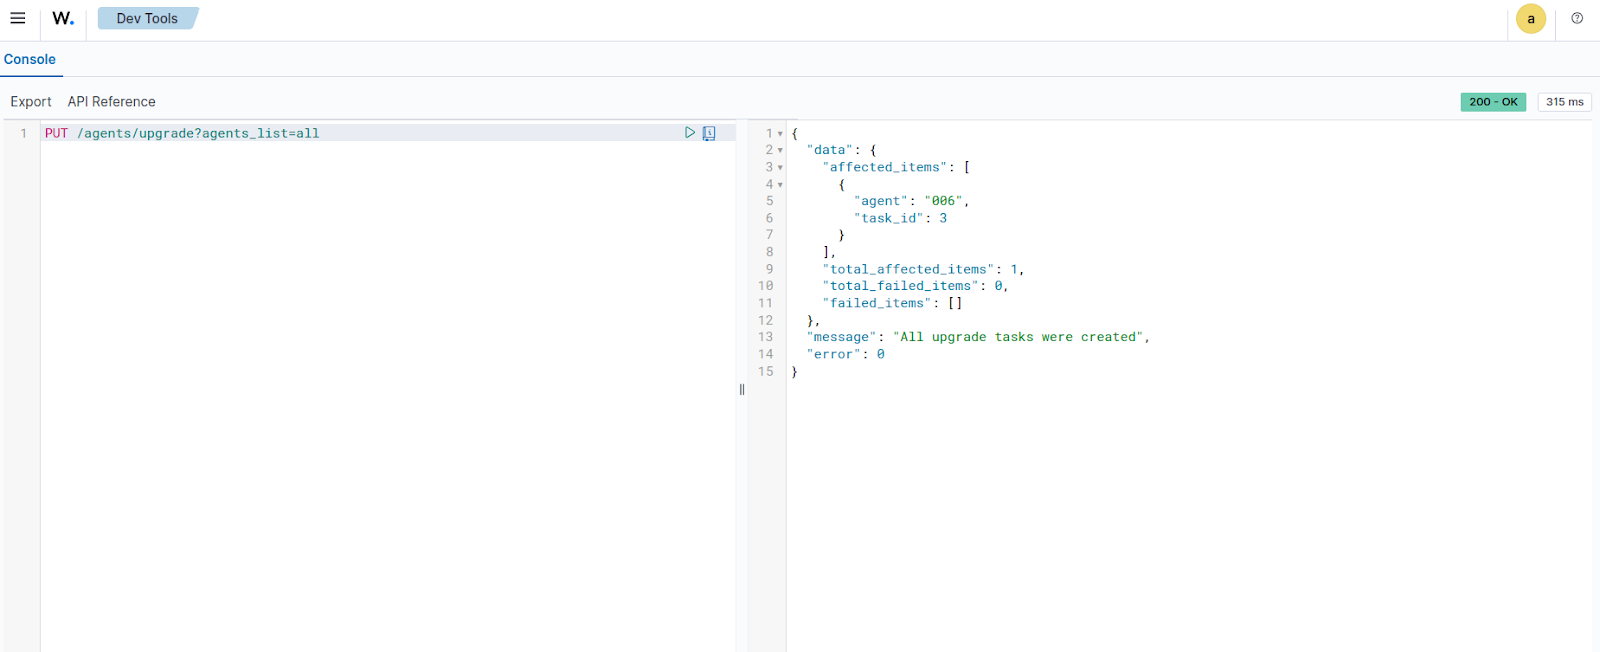
{
  "data": {
    "affected_items": [
      {
        "agent": "006",
        "task_id": 3
      }
    ],
    "total_affected_items": 1,
    "total_failed_items": 0,
    "failed_items": []
  },
  "message": "All upgrade tasks were created",
  "error": 0
}
The output above shows the upgraded Wazuh agent.
Using an authenticated terminal
The following use cases demonstrate how to run queries against Wazuh rules and decoders, and to manage the Wazuh agent using the Wazuh server API via an authenticated terminal.
Prerequisites
Generate a JWT to authenticate with the Wazuh server API by making a curl request. The default Wazuh server API credentials are wazuh:wazuh. Replace <WAZUH_MANAGER_IP_ADDRESS> with the Wazuh manager IP address or FQDN (Fully Qualified Domain Name):
# TOKEN=$(curl -u <USER>:<PASSWORD> -k -X POST "https://<WAZUH_MANAGER_IP_ADDRESS>:55000/security/user/authenticate?raw=true")
Run the command echo $TOKEN to confirm that the token was successfully generated:
# echo $TOKEN
You should get an output like this:
eyJhbGciOiJFUzUxMiIsInR5cCI6IkpXVCJ9.eyJpc3MiOiJ3YXp1aCIsImF1ZCI6IldhenVoIEFQSSBSRVNUIiwibmJmIjoxNjQzMDExMjQ0LCJleHAiOjE2NDMwMTIxNDQsInN1YiI6IndhenVoIiwicnVuX2FzIjpmYWxzZSwicmJhY19yb2xlcyI6WzFdLCJyYmFjX21vZGUiOiJ3aGl0ZSJ9.Ad6zOZvx0BEV7K0J6s3pIXAXTWB-zdVfxaX2fotLfZMQkiYPMkwDaQHUFiOInsWJ_7KZV3y2BbhEs9-kBqlJAMvMAD0NDBPhEQ2qBd_iutZ7QWZECd6eYfIP83xGqH9iqS7uMI6fXOKr3w4aFV13Q6qsHSUQ1A-1LgDnnDGGaqF5ITYo
This token will be used to make subsequent queries to the Wazuh server from your terminal.
Note
You can find your Wazuh server API user password in the wazuh-install-files.tar file generated during the Wazuh server installation. You can also reset the password for the Wazuh server API user if you have forgotten it.
Wazuh server management
You can use the Wazuh server API to manage and update the Wazuh manager configuration and retrieve information about the Wazuh server, including the ruleset. Review the API manager reference for more information on managing the Wazuh manager using the Wazuh server API.
The following use cases demonstrate how to perform a log test from a terminal using the Wazuh server API.
Testing rules and decoders
You can use the Wazuh server API to perform a log test and see exactly which decoders and rules match a sample event. By sending a test log line to the /logtest endpoint, you can validate that your custom rules are applied as expected.
Run the command below to execute a log test against a sample event and retrieve the rules and decoders that match it.:
curl -k -X PUT "https://localhost:55000/logtest?pretty=true" \
  -H "Authorization: Bearer $TOKEN" \
  -H "Content-Type: application/json" \
  -d '{
        "log_format": "syslog",
        "location": "myhost->/var/log/auth.log",
        "event": "Jan 23 10:00:00 myhost sshd[12345]: Failed password for invalid user admin from 10.0.0.5 port 54321 ssh2"
      }'
A response similar to the one below is expected when the command runs:
{
   "error": 0,
   "data": {
      "messages": [
         "INFO: (7202): Session initialized with token '1f8ec388'"
      ],
      "token": "1f8ec388",
      "output": {
         "timestamp": "2026-01-23T09:20:51.969000Z",
         "rule": {
            "level": 5,
            "description": "sshd: Attempt to login using a non-existent user",
            "id": "5710",
            "mitre": {
               "id": [
                  "T1110.001",
                  "T1021.004"
               ],
               "tactic": [
                  "Credential Access",
                  "Lateral Movement"
               ],
               "technique": [
                  "Password Guessing",
                  "SSH"
               ]
            },
            "firedtimes": 1,
            "mail": false,
            "groups": [
               "syslog",
               "sshd",
               "authentication_failed",
               "invalid_login"
            ],
            "gdpr": [
               "IV_35.7.d",
               "IV_32.2"
            ],
            "gpg13": [
               "7.1"
            ],
            "hipaa": [
               "164.312.b"
            ],
            "nist_800_53": [
               "AU.14",
               "AC.7",
               "AU.6"
            ],
            "pci_dss": [
               "10.2.4",
               "10.2.5",
               "10.6.1"
            ],
            "tsc": [
               "CC6.1",
               "CC6.8",
               "CC7.2",
               "CC7.3"
            ]
         },
         "agent": {
            "id": "000",
            "name": "wazuh.manager"
         },
         "manager": {
            "name": "wazuh.manager"
         },
         "id": "1769160011.119294",
         "full_log": "Jan 23 10:00:00 myhost sshd[12345]: Failed password for invalid user admin from 10.0.0.5 port 54321 ssh2",
         "predecoder": {
            "program_name": "sshd",
            "timestamp": "Jan 23 10:00:00",
            "hostname": "myhost"
         },
         "decoder": {
            "parent": "sshd",
            "name": "sshd"
         },
         "data": {
            "srcip": "10.0.0.5",
            "srcuser": "admin"
         },
         "location": "myhost->/var/log/auth.log"
      },
      "alert": true,
      "codemsg": 0
   }
}
The output above shows rules that match the log test event you submitted through the Wazuh server API.
Wazuh agent management
You can use the Wazuh server API to manage Wazuh agents, including enrolling, querying, and removing them from the Wazuh environment. Review the API reference to find out more about managing Wazuh agents using the Wazuh server API.
The following use cases demonstrate how to perform various operations on Wazuh agents.
Deleting Wazuh agent(s)
Using the Wazuh server API, we can delete all or specific Wazuh agents based on a predetermined criterion. Refer to the Wazuh server API reference to see other categories that can be queried.
Run the following request:
# curl -k -X DELETE "https://localhost:55000/agents?agents_list=<AGENT_ID>"&status=all&older_than=1&pretty=true" -H "Authorization: Bearer $TOKEN"
This query deletes the specified Wazuh agent.
Where:
<AGENT_ID>is the ID of the agent. We can also specify a list of Wazuh agent IDs (separated by commas) to be deleted.
A response similar to the one below is expected when the command runs:
{
  "data": {
    "affected_items": [
      "001"
    ],
    "total_affected_items": 1,
    "total_failed_items": 0,
    "failed_items": []
  },
  "message": "All selected agents were deleted",
  "error": 0
}
The output above shows the deleted Wazuh agent.
Getting Wazuh agent configuration state
You can use the Wazuh server API to return the active configuration of any Wazuh agent. This is useful for checking the configuration state of a Wazuh agent: whether it has been modified or is still pending restart. Refer to the Wazuh server API reference to see other categories that can be queried.
Run the following query to get the active configuration state of a Wazuh agent:
# curl -k -X GET "https://localhost:55000/agents/<AGENT_ID>/config/agent/client?&pretty=true" -H "Authorization: Bearer $TOKEN"
Where:
<AGENT_ID>is the ID of the Wazuh agent to be queried.
A response similar to the one below is expected when the command runs:
{
  "data": {
    "client": {
      "config-profile": "windows, windows10",
      "notify_time": 10,
      "time-reconnect": 60,
      "force_reconnect_interval": 0,
      "ip_update_interval": 0,
      "auto_restart": "yes",
      "remote_conf": "yes",
      "crypto_method": "aes",
      "server": [
        {
          "address": "192.168.56.105",
          "port": 1514,
          "max_retries": 5,
          "retry_interval": 10,
          "protocol": "tcp"
        }
      ],
      "enrollment": {
        "enabled": "yes",
        "delay_after_enrollment": 20,
        "port": 1515,
        "agent_name": "windows_temp",
        "ssl_cipher": "HIGH:!ADH:!EXP:!MD5:!RC4:!3DES:!CAMELLIA:@STRENGTH",
        "auto_method": "no"
      }
    }
  },
  "error": 0
}
The above output shows the configuration state of a Windows 10 endpoint running the Wazuh server agent.
Getting a summary of Wazuh agent information
You can use the /agents/summary endpoint to return a summary of the available Wazuh agents, operating systems, status, and groups.
Run the following command to retrieve information about the registered Wazuh agents:
# curl -k -X GET "https://localhost:55000/agents/summary?pretty=true" -H "Authorization: Bearer $TOKEN"
A response similar to the one below is expected when the command runs:
{
  "data": {
    "status": {
      "active": 8,
      "disconnected": 0,
      "never_connected": 1,
      "pending": 2
    },
    "os": {
      "debian": 8,
      "ubuntu": 3
    },
    "groups": {
      "default": 11,
      "test": 5
    }
  },
  "error": 0
}
The output above shows details for all Wazuh agents connected to the Wazuh server, including their operating system and current status.
Analyzing the File Integrity Monitoring (FIM) data of a Wazuh agent
You can utilize the Wazuh server API to display information about all files monitored by the Wazuh FIM module. The following example shows all events associated with Python .py files installed on a monitored endpoint:
# curl -k -X GET "https://localhost:55000/syscheck/<AGENT_ID>?pretty=true&search=.py" -H "Authorization: Bearer $TOKEN"
Where:
<AGENT_ID>is the ID of the agent.{ "data": { "affected_items": [ { "file": "/etc/python2.7/sitecustomize.py", "perm": "rw-r--r--", "sha1": "67b0a8ccf18bf5d2eb8c7f214b5a5d0d4a5e409d", "changes": 1, "md5": "d6b276695157bde06a56ba1b2bc53670", "inode": 29654607, "size": 155, "uid": "0", "gname": "root", "mtime": "2020-04-15T17:20:14Z", "sha256": "43d81125d92376b1a69d53a71126a041cc9a18d8080e92dea0a2ae23be138b1e", "date": "2020-05-25T14:28:41Z", "uname": "root", "type": "file", "gid": "0" }, { "file": "/etc/python3.6/sitecustomize.py", "perm": "rw-r--r--", "sha1": "67b0a8ccf18bf5d2eb8c7f214b5a5d0d4a5e409d", "changes": 1, "md5": "d6b276695157bde06a56ba1b2bc53670", "inode": 29762235, "size": 155, "uid": "0", "gname": "root", "mtime": "2020-04-18T01:56:04Z", "sha256": "43d81125d92376b1a69d53a71126a041cc9a18d8080e92dea0a2ae23be138b1e", "date": "2020-05-25T14:28:41Z", "uname": "root", "type": "file", "gid": "0" } ], "total_affected_items": 2, "total_failed_items": 0, "failed_items": [] }, "message": "FIM findings of the agent were returned", "error": 0 }
You can find a file using its SHA1 or MD5 hash. In the following examples, we retrieve the same using both its SHA1 and MD5 hash:
# curl -k -X GET "https://localhost:55000/syscheck/<AGENT_ID>?pretty=true&hash=bc929cb047b79d5c16514f2c553e6b759abfb1b8" -H "Authorization: Bearer $TOKEN"{ "data": { "affected_items": [ { "file": "/sbin/swapon", "perm": "rwxr-xr-x", "sha1": "bc929cb047b79d5c16514f2c553e6b759abfb1b8", "changes": 1, "md5": "085c1161d814a8863562694b3819f6a5", "inode": 14025822, "size": 47184, "uid": "0", "gname": "root", "mtime": "2020-01-08T18:31:23Z", "sha256": "f274025a1e4870301c5678568ab9519152f49d3cb907c01f7c71ff17b1a6e870", "date": "2020-05-25T14:29:44Z", "uname": "root", "type": "file", "gid": "0" } ], "total_affected_items": 1, "total_failed_items": 0, "failed_items": [] }, "message": "FIM findings of the agent were returned", "error": 0 }# curl -k -X GET "https://localhost:55000/syscheck/<AGENT_ID>?pretty=true&hash=085c1161d814a8863562694b3819f6a5" -H "Authorization: Bearer $TOKEN"{ "data": { "affected_items": [ { "file": "/sbin/swapon", "perm": "rwxr-xr-x", "sha1": "bc929cb047b79d5c16514f2c553e6b759abfb1b8", "changes": 1, "md5": "085c1161d814a8863562694b3819f6a5", "inode": 14025822, "size": 47184, "uid": "0", "gname": "root", "mtime": "2020-01-08T18:31:23Z", "sha256": "f274025a1e4870301c5678568ab9519152f49d3cb907c01f7c71ff17b1a6e870", "date": "2020-05-25T14:29:44Z", "uname": "root", "type": "file", "gid": "0" } ], "total_affected_items": 1, "total_failed_items": 0, "failed_items": [] }, "message": "FIM findings of the agent were returned", "error": 0 }
Analyzing Syscollector data of a Wazuh agent
You can use the Wazuh server API to retrieve endpoint inventory information collected by the Syscollector module on monitored endpoints. Syscollector gathers detailed data about the operating system, installed packages, hardware components, network interfaces, ports, and running processes. This information is useful for asset inventory, exposure analysis, and threat-hunting activities.
Retrieving hardware inventory information
Run the following command to retrieve hardware inventory information collected by Syscollector from the monitored endpoint:
curl -k -X GET "https://localhost:55000/syscollector/<AGENT_ID>/hardware?pretty=true" -H "Authorization: Bearer $TOKEN"
Where:
<AGENT_ID>is the ID of the agent.
A response similar to the one below is expected when the command is executed:
{
   "data": {
      "affected_items": [
         {
            "cpu": {
               "cores": 2,
               "mhz": 2593,
               "name": "Intel(R) Core(TM) i7-8850H CPU @ 2.60GHz"
            },
            "ram": {
               "free": 1455508,
               "total": 1965964,
               "usage": 26
            },
            "scan": {
               "id": 0,
               "time": "2026-02-05T16:36:32+00:00"
            },
            "board_serial": "None",
            "agent_id": "001"
         }
      ],
      "total_affected_items": 1,
      "total_failed_items": 0,
      "failed_items": []
   },
   "message": "All specified syscollector information was returned",
   "error": 0
}
Retrieving software packages
Run the following command to retrieve installed packages on the monitored endpoint that match the keyword python:
curl -k -X GET "https://localhost:55000/syscollector/<AGENT_ID>/packages?pretty=true&search=python&limit=3" -H "Authorization: Bearer $TOKEN"
Where:
<AGENT_ID>is the ID of the agent.
A response similar to the one below is expected when the command is executed:
{
   "data": {
      "affected_items": [
         {
            "scan": {
               "id": 0,
               "time": "2026-01-06T14:03:22+00:00"
            },
            "size": 29901824,
            "name": "python-babel-localedata",
            "architecture": "all",
            "multiarch": "foreign",
            "description": "tools for internationalizing Python applications - locale data files",
            "vendor": "Ubuntu Developers <ubuntu-devel-discuss@lists.ubuntu.com>",
            "format": "deb",
            "location": " ",
            "install_time": " ",
            "section": "python",
            "version": "2.10.3-3build1",
            "source": "python-babel",
            "priority": "optional",
            "agent_id": "001"
         },
         {
            "scan": {
               "id": 0,
               "time": "2026-01-06T14:03:24+00:00"
            },
            "size": 114688,
            "name": "python3-minimal",
            "architecture": "amd64",
            "multiarch": "allowed",
            "description": "minimal subset of the Python language (default python3 version)",
            "vendor": "Ubuntu Developers <ubuntu-devel-discuss@lists.ubuntu.com>",
            "format": "deb",
            "location": " ",
            "install_time": " ",
            "section": "python",
            "version": "3.12.3-0ubuntu2.1",
            "source": "python3-defaults",
            "priority": "optional",
            "agent_id": "001"
         },
         {
            "scan": {
               "id": 0,
               "time": "2026-01-06T14:03:24+00:00"
            },
            "size": 1061888,
            "name": "python3-boto3",
            "architecture": "all",
            "description": "Python interface to Amazon's Web Services - Python 3.x",
            "vendor": "Ubuntu Developers <ubuntu-devel-discuss@lists.ubuntu.com>",
            "format": "deb",
            "location": " ",
            "install_time": " ",
            "section": "python",
            "version": "1.34.46+dfsg-1ubuntu1",
            "source": "python-boto3",
            "priority": "optional",
            "agent_id": "001"
         }
      ],
      "total_affected_items": 96,
      "total_failed_items": 0,
      "failed_items": []
   },
   "message": "All specified syscollector information was returned",
   "error": 0
}
Retrieving network interface information
Run the following command to retrieve network interface inventory information collected by Syscollector from the monitored endpoint:
curl -k -X GET "https://localhost:55000/syscollector/<AGENT_ID>/netiface?pretty=true" -H "Authorization: Bearer $TOKEN"
Where:
<AGENT_ID>is the ID of the agent.
A response similar to the one below is expected when the command is executed:
{
   "data": {
      "affected_items": [
         {
            "rx": {
               "bytes": 338126113,
               "dropped": 0,
               "errors": 0,
               "packets": 349300
            },
            "scan": {
               "id": 0,
               "time": "2026-02-05T17:36:42+00:00"
            },
            "tx": {
               "bytes": 23743629,
               "dropped": 0,
               "errors": 0,
               "packets": 127261
            },
            "mtu": 1500,
            "state": "up",
            "name": "ens33",
            "type": "ethernet",
            "mac": "00:0c:29:dd:ed:65",
            "agent_id": "001"
         }
      ],
      "total_affected_items": 1,
      "total_failed_items": 0,
      "failed_items": []
   },
   "message": "All specified syscollector information was returned",
   "error": 0
}
Retrieving open network ports
Run the following command to retrieve information about open ports detected by Syscollector on the monitored endpoint:
curl -k -X GET "https://localhost:55000/syscollector/<AGENT_ID>/ports?pretty=true" -H "Authorization: Bearer $TOKEN"
Where:
<AGENT_ID>is the ID of the agent.
A response similar to the one below is expected when the command is executed:
{
   "data": {
      "affected_items": [
         {
            "local": {
               "ip": "::",
               "port": 22
            },
            "remote": {
               "ip": "::",
               "port": 0
            },
            "scan": {
               "id": 0,
               "time": "2026-02-02T19:11:59+00:00"
            },
            "protocol": "tcp6",
            "tx_queue": 0,
            "process": "systemd",
            "inode": 14404,
            "pid": 1,
            "rx_queue": 0,
            "state": "listening",
            "agent_id": "001"
         },
         {
            "local": {
               "ip": "0.0.0.0",
               "port": 22
            },
            "remote": {
               "ip": "0.0.0.0",
               "port": 0
            },
            "scan": {
               "id": 0,
               "time": "2026-02-02T19:12:00+00:00"
            },
            "protocol": "tcp",
            "tx_queue": 0,
            "process": "systemd",
            "inode": 14398,
            "pid": 1,
            "rx_queue": 0,
            "state": "listening",
            "agent_id": "001"
         },
         {
            "local": {
               "ip": "127.0.0.54",
               "port": 53
            },
            "remote": {
               "ip": "0.0.0.0",
               "port": 0
            },
            "scan": {
               "id": 0,
               "time": "2026-02-03T10:14:58+00:00"
            },
            "protocol": "udp",
            "tx_queue": 0,
            "process": "systemd-resolve",
            "inode": 705623,
            "pid": 125810,
            "rx_queue": 0,
            "agent_id": "001"
         },
         {
            "local": {
               "ip": "127.0.0.54",
               "port": 53
            },
            "remote": {
               "ip": "0.0.0.0",
               "port": 0
            },
            "scan": {
               "id": 0,
               "time": "2026-02-03T10:14:58+00:00"
            },
            "protocol": "tcp",
            "tx_queue": 0,
            "process": "systemd-resolve",
            "inode": 705624,
            "pid": 125810,
            "rx_queue": 0,
            "state": "listening",
            "agent_id": "001"
         },
         {
            "local": {
               "ip": "127.0.0.53",
               "port": 53
            },
            "remote": {
               "ip": "0.0.0.0",
               "port": 0
            },
            "scan": {
               "id": 0,
               "time": "2026-02-03T10:14:59+00:00"
            },
            "protocol": "tcp",
            "tx_queue": 0,
            "process": "systemd-resolve",
            "inode": 705622,
            "pid": 125810,
            "rx_queue": 0,
            "state": "listening",
            "agent_id": "001"
         },
         {
            "local": {
               "ip": "::",
               "port": 80
            },
            "remote": {
               "ip": "::",
               "port": 0
            },
            "scan": {
               "id": 0,
               "time": "2026-02-03T10:15:02+00:00"
            },
            "protocol": "tcp6",
            "tx_queue": 0,
            "process": "apache2",
            "inode": 705484,
            "pid": 125941,
            "rx_queue": 0,
            "state": "listening",
            "agent_id": "001"
         },
         {
            "local": {
               "ip": "127.0.0.53",
               "port": 53
            },
            "remote": {
               "ip": "0.0.0.0",
               "port": 0
            },
            "scan": {
               "id": 0,
               "time": "2026-02-03T10:15:03+00:00"
            },
            "protocol": "udp",
            "tx_queue": 0,
            "process": "systemd-resolve",
            "inode": 705621,
            "pid": 125810,
            "rx_queue": 0,
            "agent_id": "001"
         },
         {
            "local": {
               "ip": "192.168.71.129",
               "port": 49535
            },
            "remote": {
               "ip": "192.168.71.252",
               "port": 1514
            },
            "scan": {
               "id": 0,
               "time": "2026-02-05T16:36:32+00:00"
            },
            "protocol": "tcp",
            "tx_queue": 0,
            "process": "wazuh-agentd",
            "inode": 2390758,
            "pid": 126102,
            "rx_queue": 0,
            "state": "established",
            "agent_id": "001"
         },
         {
            "local": {
               "ip": "192.168.71.129",
               "port": 68
            },
            "remote": {
               "ip": "0.0.0.0",
               "port": 0
            },
            "scan": {
               "id": 0,
               "time": "2026-02-05T19:37:01+00:00"
            },
            "protocol": "udp",
            "tx_queue": 0,
            "process": "systemd-network",
            "inode": 2928082,
            "pid": 126024,
            "rx_queue": 0,
            "agent_id": "001"
         }
      ],
      "total_affected_items": 9,
      "total_failed_items": 0,
      "failed_items": []
   },
   "message": "All specified syscollector information was returned",
   "error": 0
}
Retrieving running processes
Run the following command to retrieve information about running processes collected by Syscollector on a monitored endpoint:
curl -k -X GET "https://localhost:55000/syscollector/<AGENT_ID>/processes?pretty=true&limit=5" -H "Authorization: Bearer $TOKEN"
Where:
<AGENT_ID>is the ID of the agent.
A response similar to the one below is expected when the command is executed:
{
   "data": {
      "affected_items": [
         {
            "scan": {
               "id": 0,
               "time": "2026-02-05T20:37:11+00:00"
            },
            "start_time": 1770113685,
            "fgroup": "root",
            "vm_size": 6824,
            "ppid": 1,
            "stime": 35,
            "egroup": "root",
            "processor": 0,
            "session": 125736,
            "tty": 0,
            "nlwp": 1,
            "argvs": "-f -P",
            "rgroup": "root",
            "state": "S",
            "share": 672,
            "size": 1706,
            "name": "cron",
            "utime": 6,
            "suser": "root",
            "resident": 2816,
            "tgid": 125736,
            "nice": 0,
            "pgrp": 125736,
            "priority": 20,
            "euser": "root",
            "ruser": "root",
            "pid": "125736",
            "sgroup": "root",
            "cmd": "/usr/sbin/cron",
            "agent_id": "001"
         },
         {
            "scan": {
               "id": 0,
               "time": "2026-02-05T20:37:11+00:00"
            },
            "start_time": 1770113685,
            "fgroup": "root",
            "vm_size": 601328,
            "ppid": 1,
            "stime": 1407,
            "egroup": "root",
            "processor": 1,
            "session": 125745,
            "tty": 0,
            "nlwp": 6,
            "rgroup": "root",
            "state": "S",
            "share": 9408,
            "size": 150332,
            "name": "fwupd",
            "utime": 666,
            "suser": "root",
            "resident": 44368,
            "tgid": 125745,
            "nice": 0,
            "pgrp": 125745,
            "priority": 20,
            "euser": "root",
            "ruser": "root",
            "pid": "125745",
            "sgroup": "root",
            "cmd": "/usr/libexec/fwupd/fwupd",
            "agent_id": "001"
         },
         {
            "scan": {
               "id": 0,
               "time": "2026-02-05T20:37:11+00:00"
            },
            "start_time": 1770113685,
            "fgroup": "root",
            "vm_size": 11344,
            "ppid": 1,
            "stime": 40,
            "egroup": "root",
            "processor": 0,
            "session": 125763,
            "tty": 0,
            "nlwp": 2,
            "rgroup": "root",
            "state": "S",
            "share": 448,
            "size": 2836,
            "name": "auditd",
            "utime": 30,
            "suser": "root",
            "resident": 1920,
            "tgid": 125763,
            "nice": -4,
            "pgrp": 125763,
            "priority": 16,
            "euser": "root",
            "ruser": "root",
            "pid": "125763",
            "sgroup": "root",
            "cmd": "/sbin/auditd",
            "agent_id": "001"
         },
         {
            "scan": {
               "id": 0,
               "time": "2026-02-05T20:37:11+00:00"
            },
            "start_time": 1770113685,
            "fgroup": "root",
            "vm_size": 50416,
            "ppid": 1,
            "stime": 232,
            "egroup": "root",
            "processor": 0,
            "session": 125765,
            "tty": 0,
            "nlwp": 1,
            "rgroup": "root",
            "state": "S",
            "share": 4224,
            "size": 12604,
            "name": "systemd-journal",
            "utime": 195,
            "suser": "root",
            "resident": 17920,
            "tgid": 125765,
            "nice": -1,
            "pgrp": 125765,
            "priority": 19,
            "euser": "root",
            "ruser": "root",
            "pid": "125765",
            "sgroup": "root",
            "cmd": "/usr/lib/systemd/systemd-journald",
            "agent_id": "001"
         },
         {
            "scan": {
               "id": 0,
               "time": "2026-02-05T20:37:11+00:00"
            },
            "start_time": 1770113685,
            "fgroup": "systemd-timesync",
            "vm_size": 91028,
            "ppid": 1,
            "stime": 94,
            "egroup": "systemd-timesync",
            "processor": 1,
            "session": 125777,
            "tty": 0,
            "nlwp": 2,
            "rgroup": "systemd-timesync",
            "state": "S",
            "share": 1728,
            "size": 22757,
            "name": "systemd-timesyn",
            "utime": 27,
            "suser": "systemd-timesync",
            "resident": 7808,
            "tgid": 125777,
            "nice": 0,
            "pgrp": 125777,
            "priority": 20,
            "euser": "systemd-timesync",
            "ruser": "systemd-timesync",
            "pid": "125777",
            "sgroup": "systemd-timesync",
            "cmd": "/usr/lib/systemd/systemd-timesyncd",
            "agent_id": "001"
         }
      ],
      "total_affected_items": 223,
      "total_failed_items": 0,
      "failed_items": []
   },
   "message": "All specified syscollector information was returned",
   "error": 0
}