Log data analysis
Log data analysis is a crucial process that involves examining and extracting valuable insights from log files created by different systems, applications, or devices. These logs contain records of events that provide useful information for troubleshooting, security analysis and monitoring, and optimizing performance. Log data analysis is an essential practice that contributes to a secure, efficient, and reliable IT ecosystem.
Wazuh collects, analyzes, and stores logs from endpoints, network devices, and applications. The Wazuh agent, running on a monitored endpoint collects and forwards system and application logs to the Wazuh server for analysis. Additionally, you can send log messages to the Wazuh server via syslog or third-party API integrations.
Log data collection
Wazuh collects logs from a wide range of sources, enabling comprehensive monitoring of various aspects of your IT environment. You can check our documentation on Log data collection to understand better how Wazuh collects and analyzes logs from monitored endpoints. Some of the common log sources supported by Wazuh include:
Operating system logs: Wazuh collects logs from several operating systems, including Linux, Windows, and macOS.
Wazuh can collect syslog, auditd, application logs, and others from Linux endpoints.
Wazuh collects logs on Windows endpoints using the Windows event channel and Windows event log format. By default, the Wazuh agent monitors the System, Application, and Security Windows event channels on Windows endpoints. The Wazuh agent offers the flexibility to configure and monitor other Windows event channels.
Wazuh utilizes the unified logging system (ULS) to collect logs on macOS endpoints. The macOS ULS centralizes the management and storage of logs across all the system levels.
The image below shows an event collected from the
Microsoft-Windows-Sysmon/Operationalevent channel on a Windows endpoint.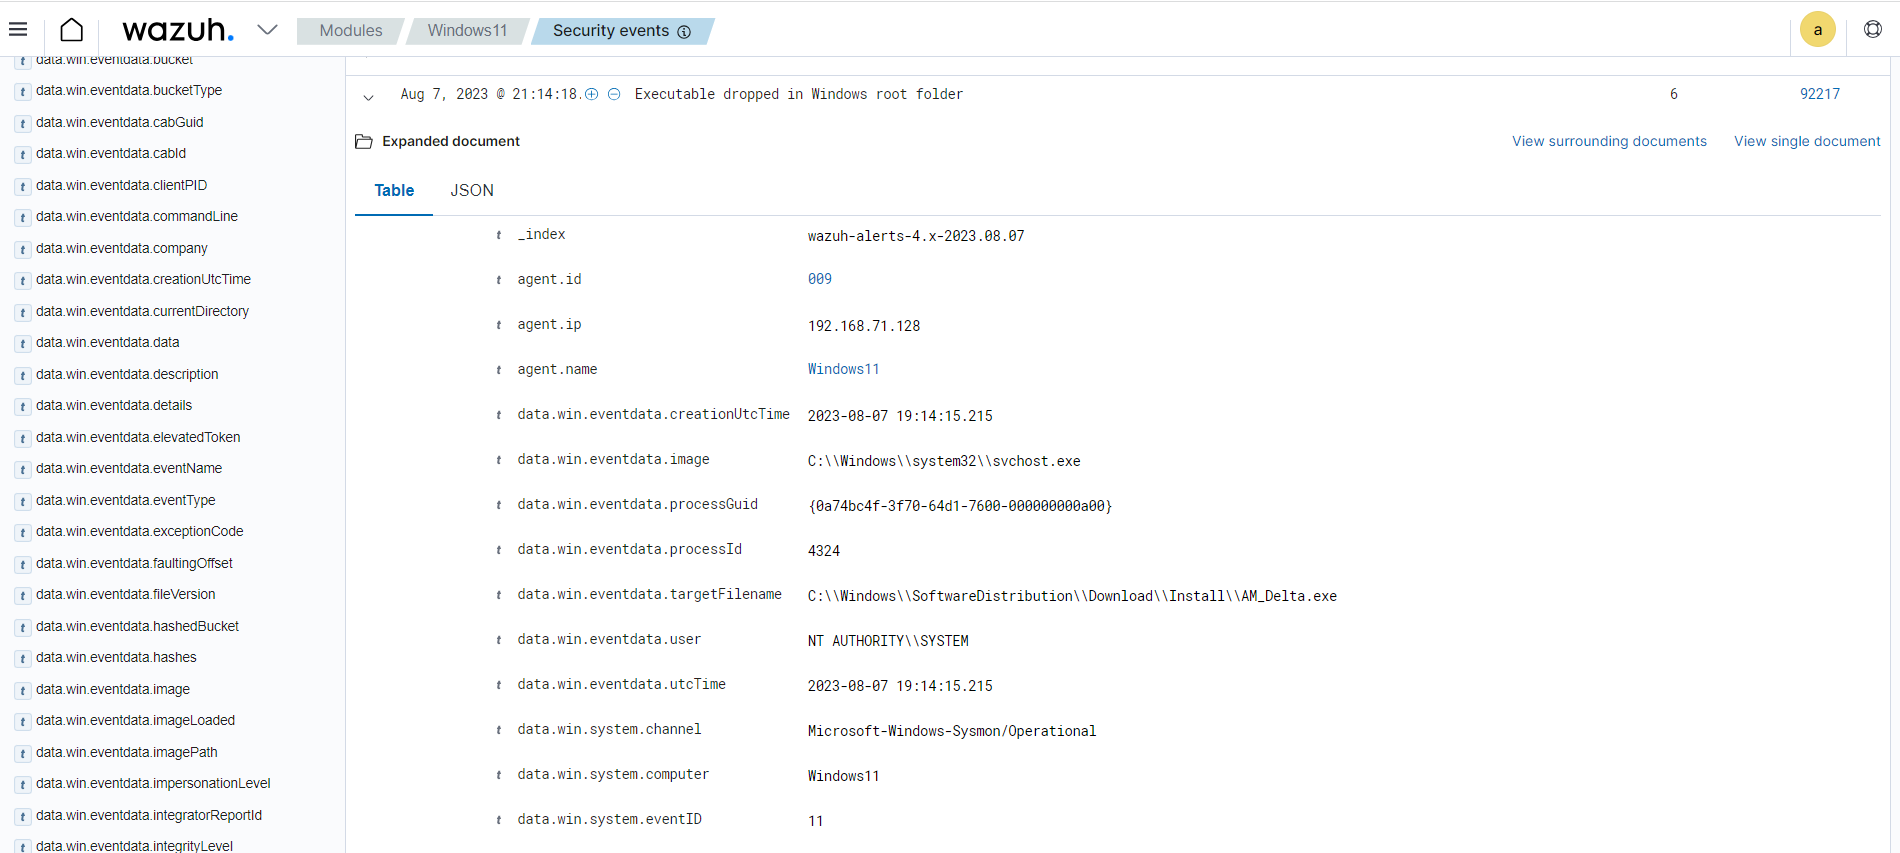
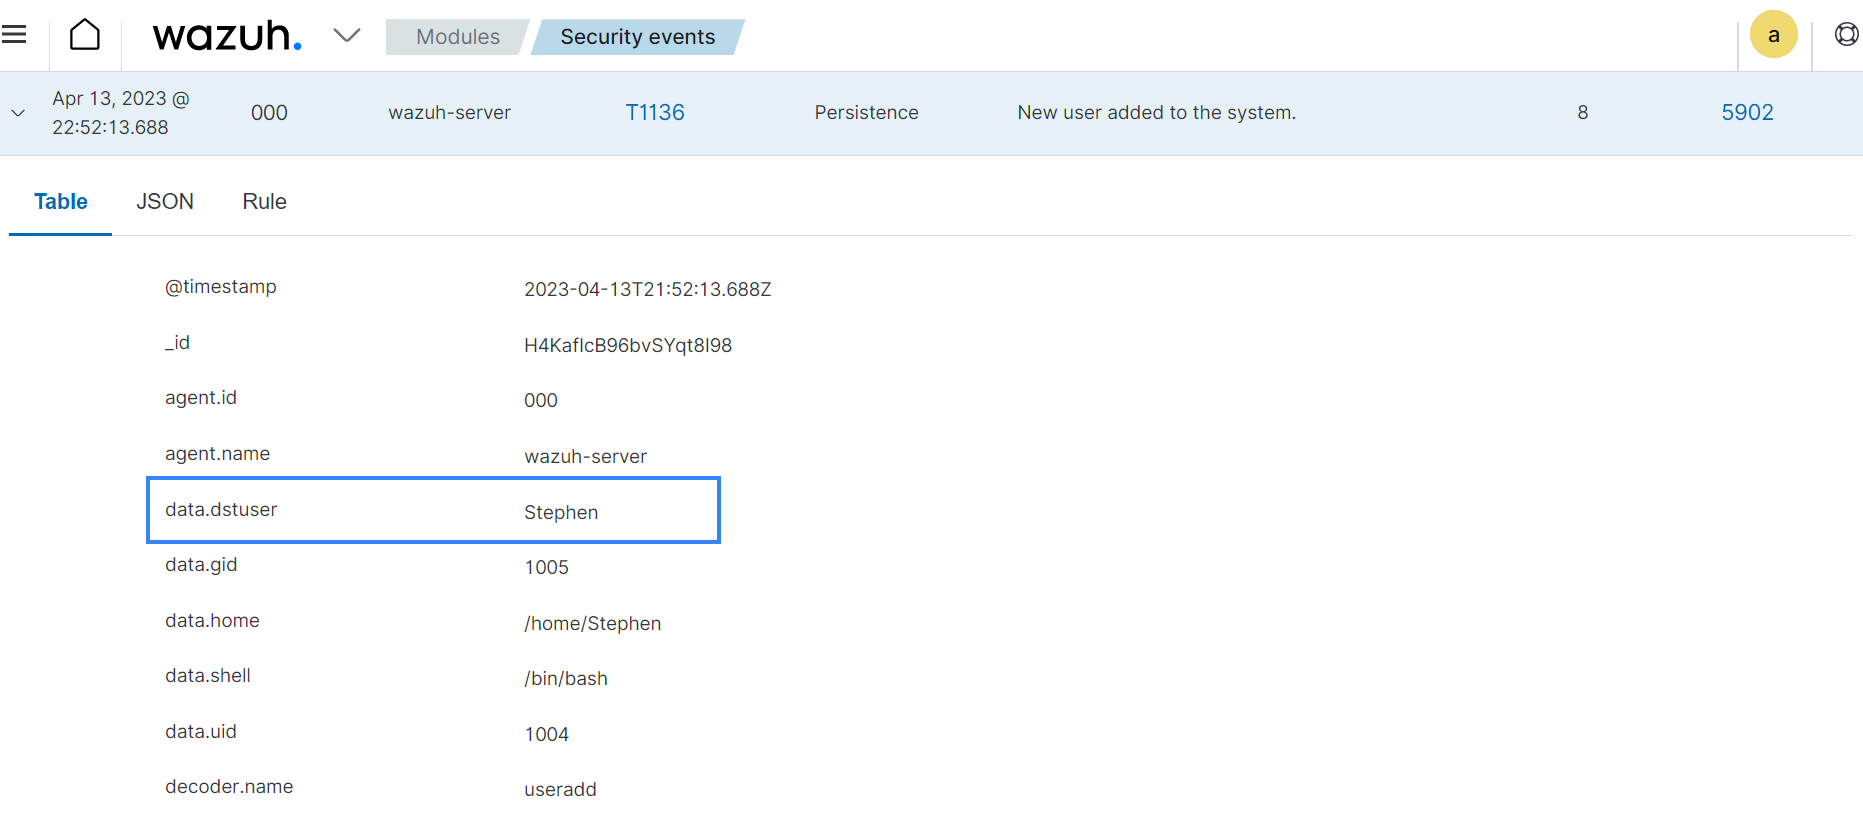
Syslog events: Wazuh gathers logs from syslog-enabled devices, encompassing a wide array of sources including Linux/Unix systems and network devices that do not support agent installation. The image below shows an alert triggered when a new user is created on the Linux endpoint and the log is forwarded to the Wazuh server via rsyslog.
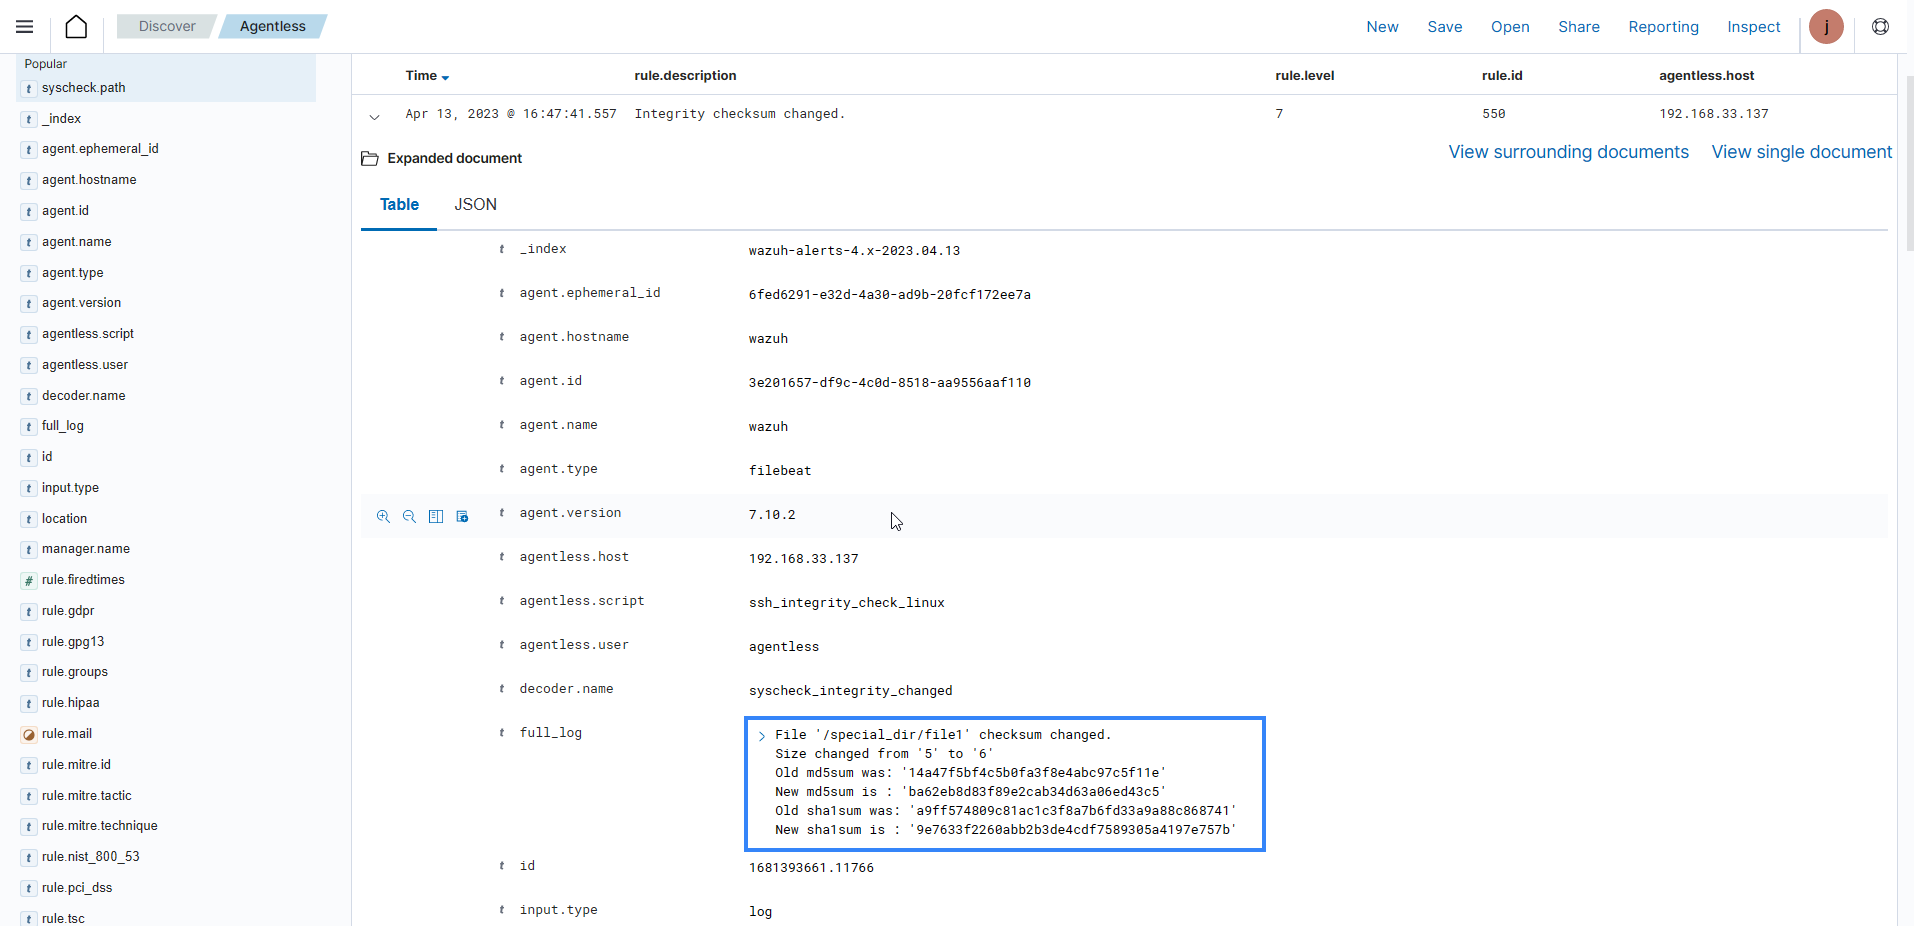
Agentless monitoring: The Wazuh agentless monitoring module monitors endpoints that don't support agent installation. It requires an SSH connection between the endpoint and the Wazuh server. The Wazuh agentless monitoring module monitors files, directories, or configurations and runs commands on the endpoint. The image below is an alert from an agentless device on the Wazuh dashboard.
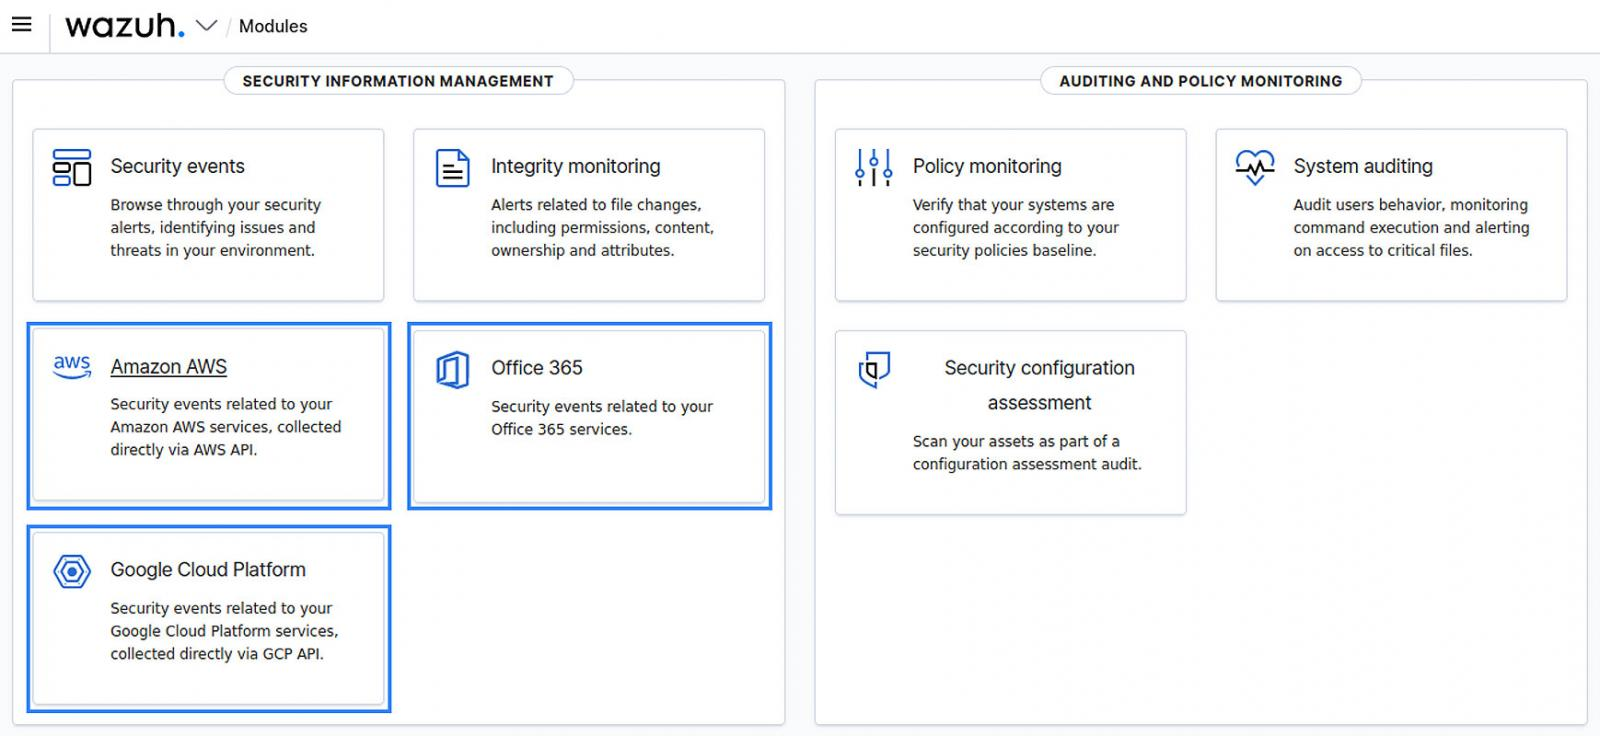
Cloud provider logs: Wazuh integrates with cloud providers like AWS, Azure, Google Cloud, and Office 365 to collect logs from cloud services such as EC2 instances, S3 buckets, Azure VMs, and more. The image below shows the CLOUD SECURITY section in the Wazuh dashboard.
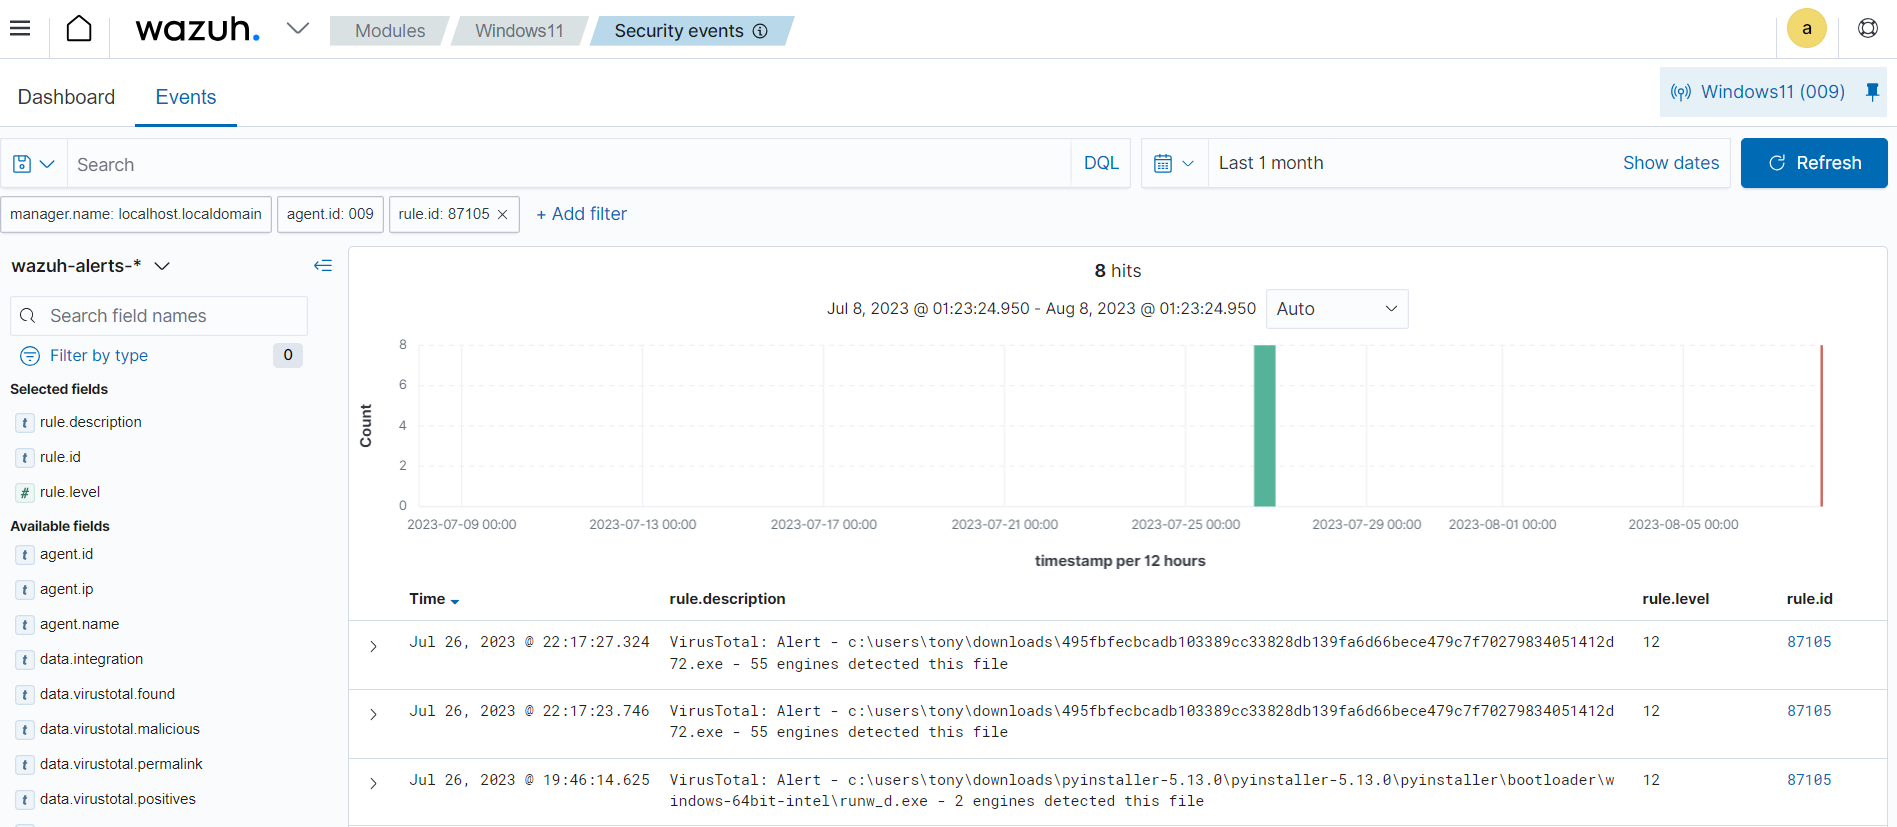
Custom logs: You can configure Wazuh to collect and parse logs from several applications and third-party security tools like VirusTotal, Windows Defender, and ClamAV. The image below shows an alert of a log from VirusTotal processed by the Wazuh server.
Rules and decoders
Wazuh rules and decoders are core components in log data analysis and threat detection and response. Wazuh provides a powerful platform for log data analysis, allowing organizations to enhance their security posture by promptly detecting and responding to potential security threats.
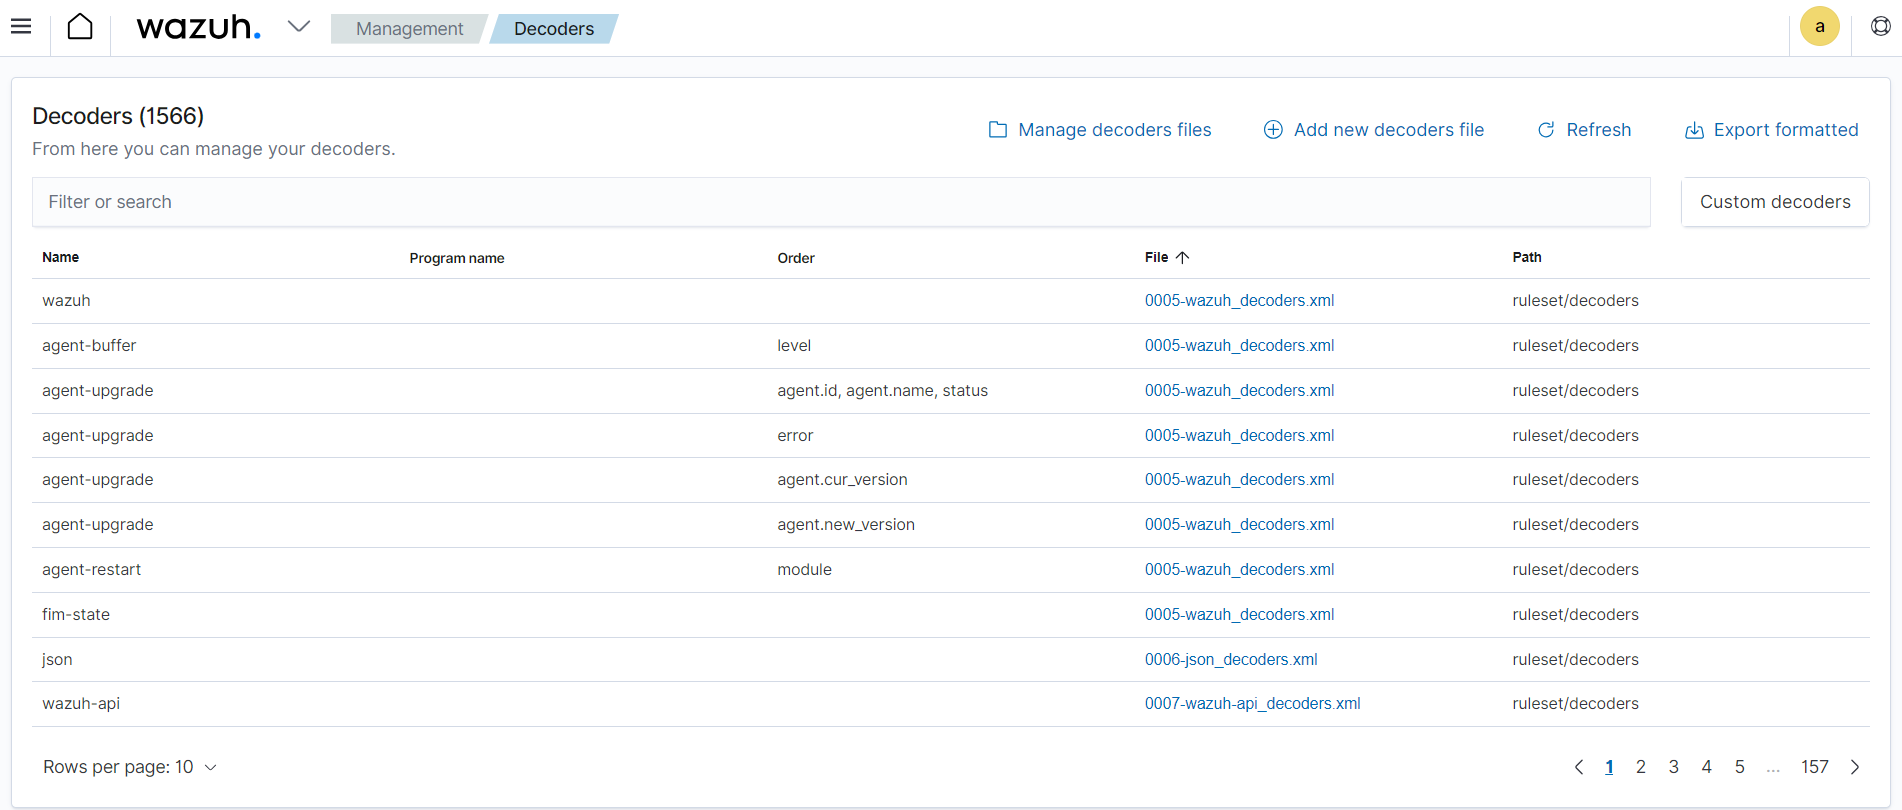
Wazuh decoders are responsible for parsing and normalizing log data collected from various sources. Decoders are essential for converting the raw log data in several formats into a unified and structured format that Wazuh can process effectively. Wazuh has pre-built decoders for common log formats such as syslog, Windows event channel, macOS ULS, and more. Additionally, Wazuh allows you to define custom decoders for parsing logs from specific applications or devices with unique log formats. By using decoders, Wazuh can efficiently interpret log data and extract relevant information, such as timestamps, log levels, source IP addresses, user names, and more. As shown below, you can view Wazuh out-of-the-box and custom decoders on the Server management > Decoders of the Wazuh dashboard.
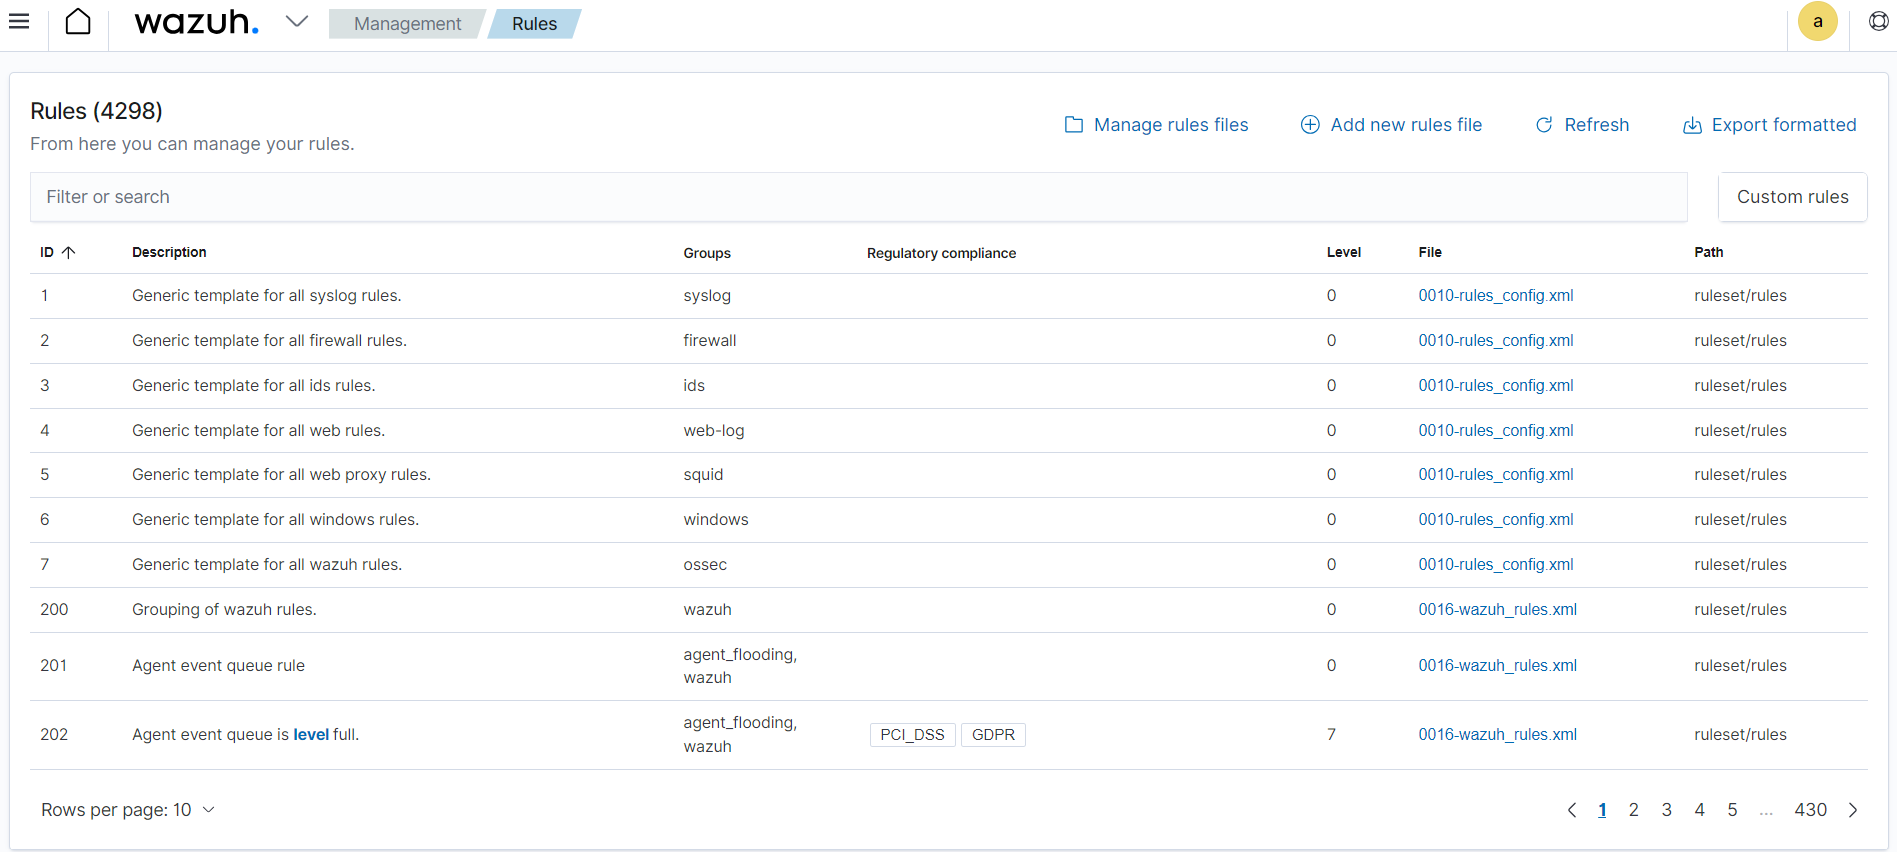
Wazuh ruleset detects security events and anomalies in log data. These rules are written in a specific format and they trigger alerts when certain conditions are met. The rules are defined based on certain criteria like log fields, values, or patterns to match specific log entries that may indicate security threats. Wazuh provides a wide range of pre-built rules covering common security use cases. Additionally, administrators can create custom rules tailored to their specific environment and security requirements. The Server management category of the Wazuh dashboard lets you view the default and custom Rules.
For example, the rule below includes a match field used to define the pattern that the rule looks for. The rule also has a level field that specifies the priority of the resulting alert. Additionally, rules enrich events with technique identifiers from the MITRE ATT&CK framework and map them to regulatory compliance controls.
<rule id="5715" level="3">
  <if_sid>5700</if_sid>
  <match>^Accepted|authenticated.$</match>
  <description>sshd: authentication success.</description>
  <mitre>
    <id>T1078</id>
    <id>T1021</id>
  </mitre>
  <group>authentication_success,gdpr_IV_32.2,gpg13_7.1,gpg13_7.2,hipaa_164.312.b,nist_800_53_AU.14,nist_800_53_AC.7,pci_dss_10.2.5,tsc_CC6.8,tsc_CC7.2,tsc_CC7.3,</group>
</rule>
Log data indexing and storage
The Wazuh indexer is a highly scalable, distributed real-time search and analytics engine. The Wazuh indexer is critical in log analysis as it stores and indexes alerts generated by the Wazuh server. These alerts are stored as JSON documents.
The Wazuh indexer guarantees redundancy by storing the JSON documents across several containers called shards and distributing the shards across multiple nodes. This implementation prevents downtime when hardware failures or cyber-attacks occur and increases query capacity as nodes are added to a cluster.
Wazuh uses four indices to store several event types:
wazuh-alerts stores alerts generated by the Wazuh server when an event triggers a rule with high enough priority. The image below shows alerts in the Discover module of the Wazuh dashboard. The index pattern is set to
wazuh-alerts-*by default.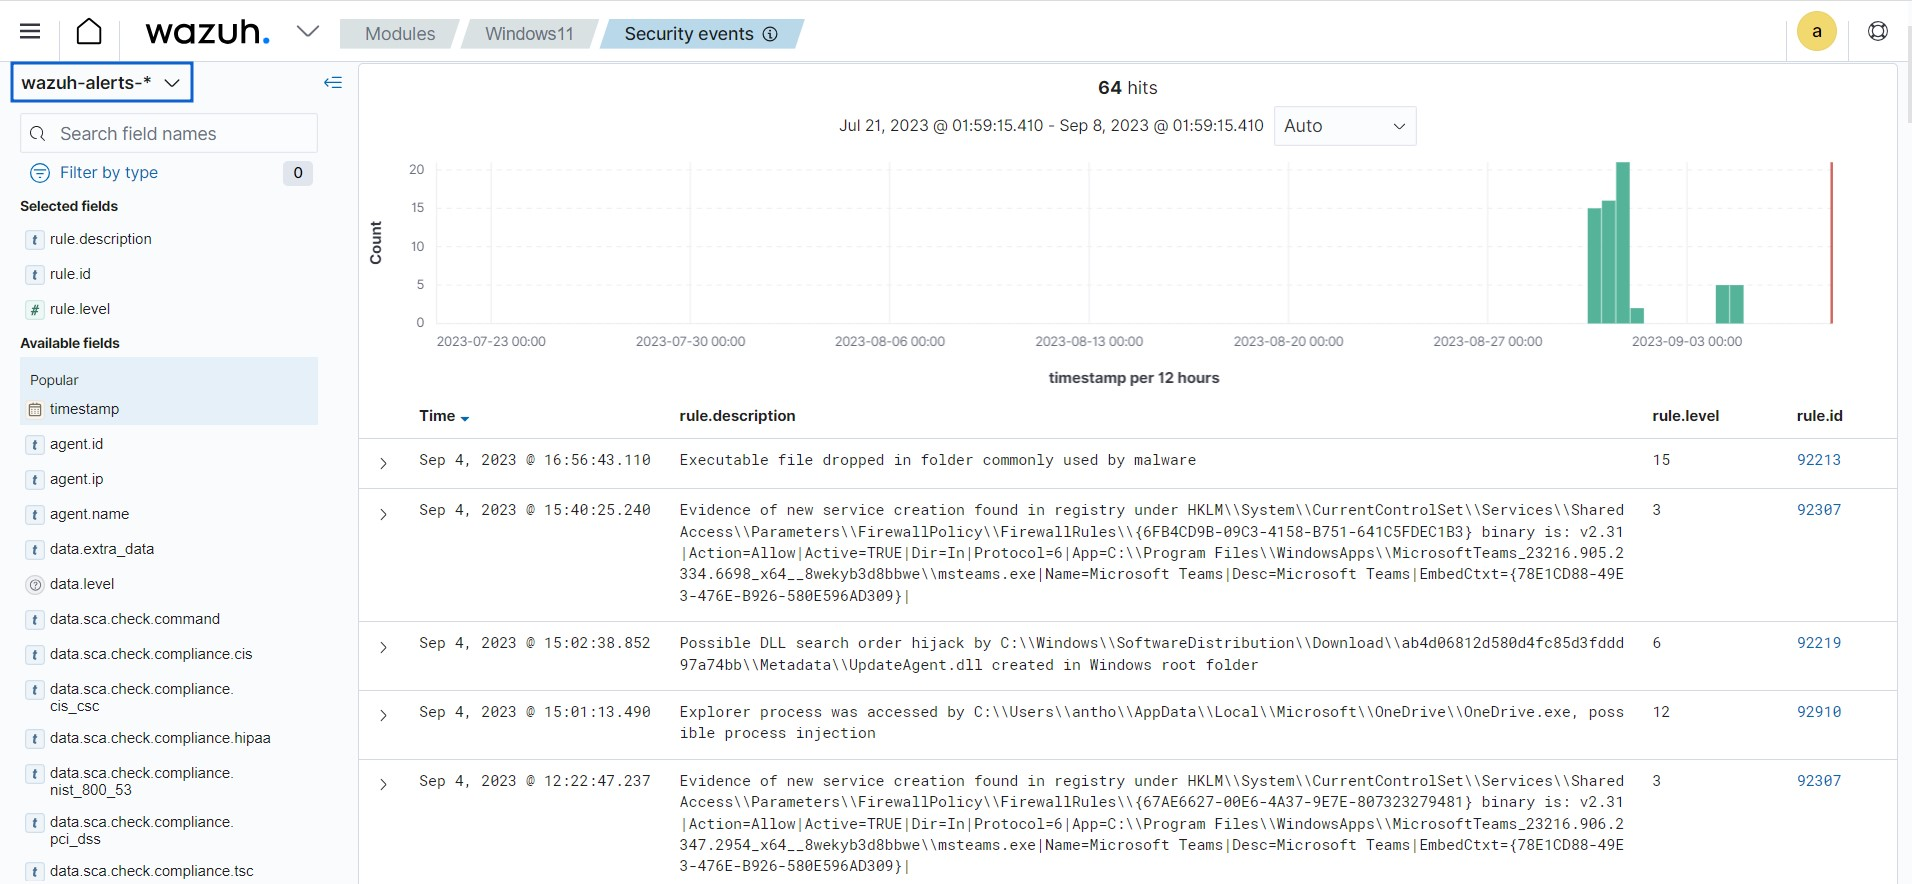
wazuh-archives index stores all events received from the Wazuh server regardless of whether they trigger an alert. The Wazuh archives use this index to enable log retention and querying capabilities that offer deeper insight into events happening within monitored endpoints. Wazuh archives are disabled by default because of the huge storage requirements needed to store all the logs. The image below shows archived events in the Discover section of Wazuh dashboard with the index pattern set to
wazuh-archives-*.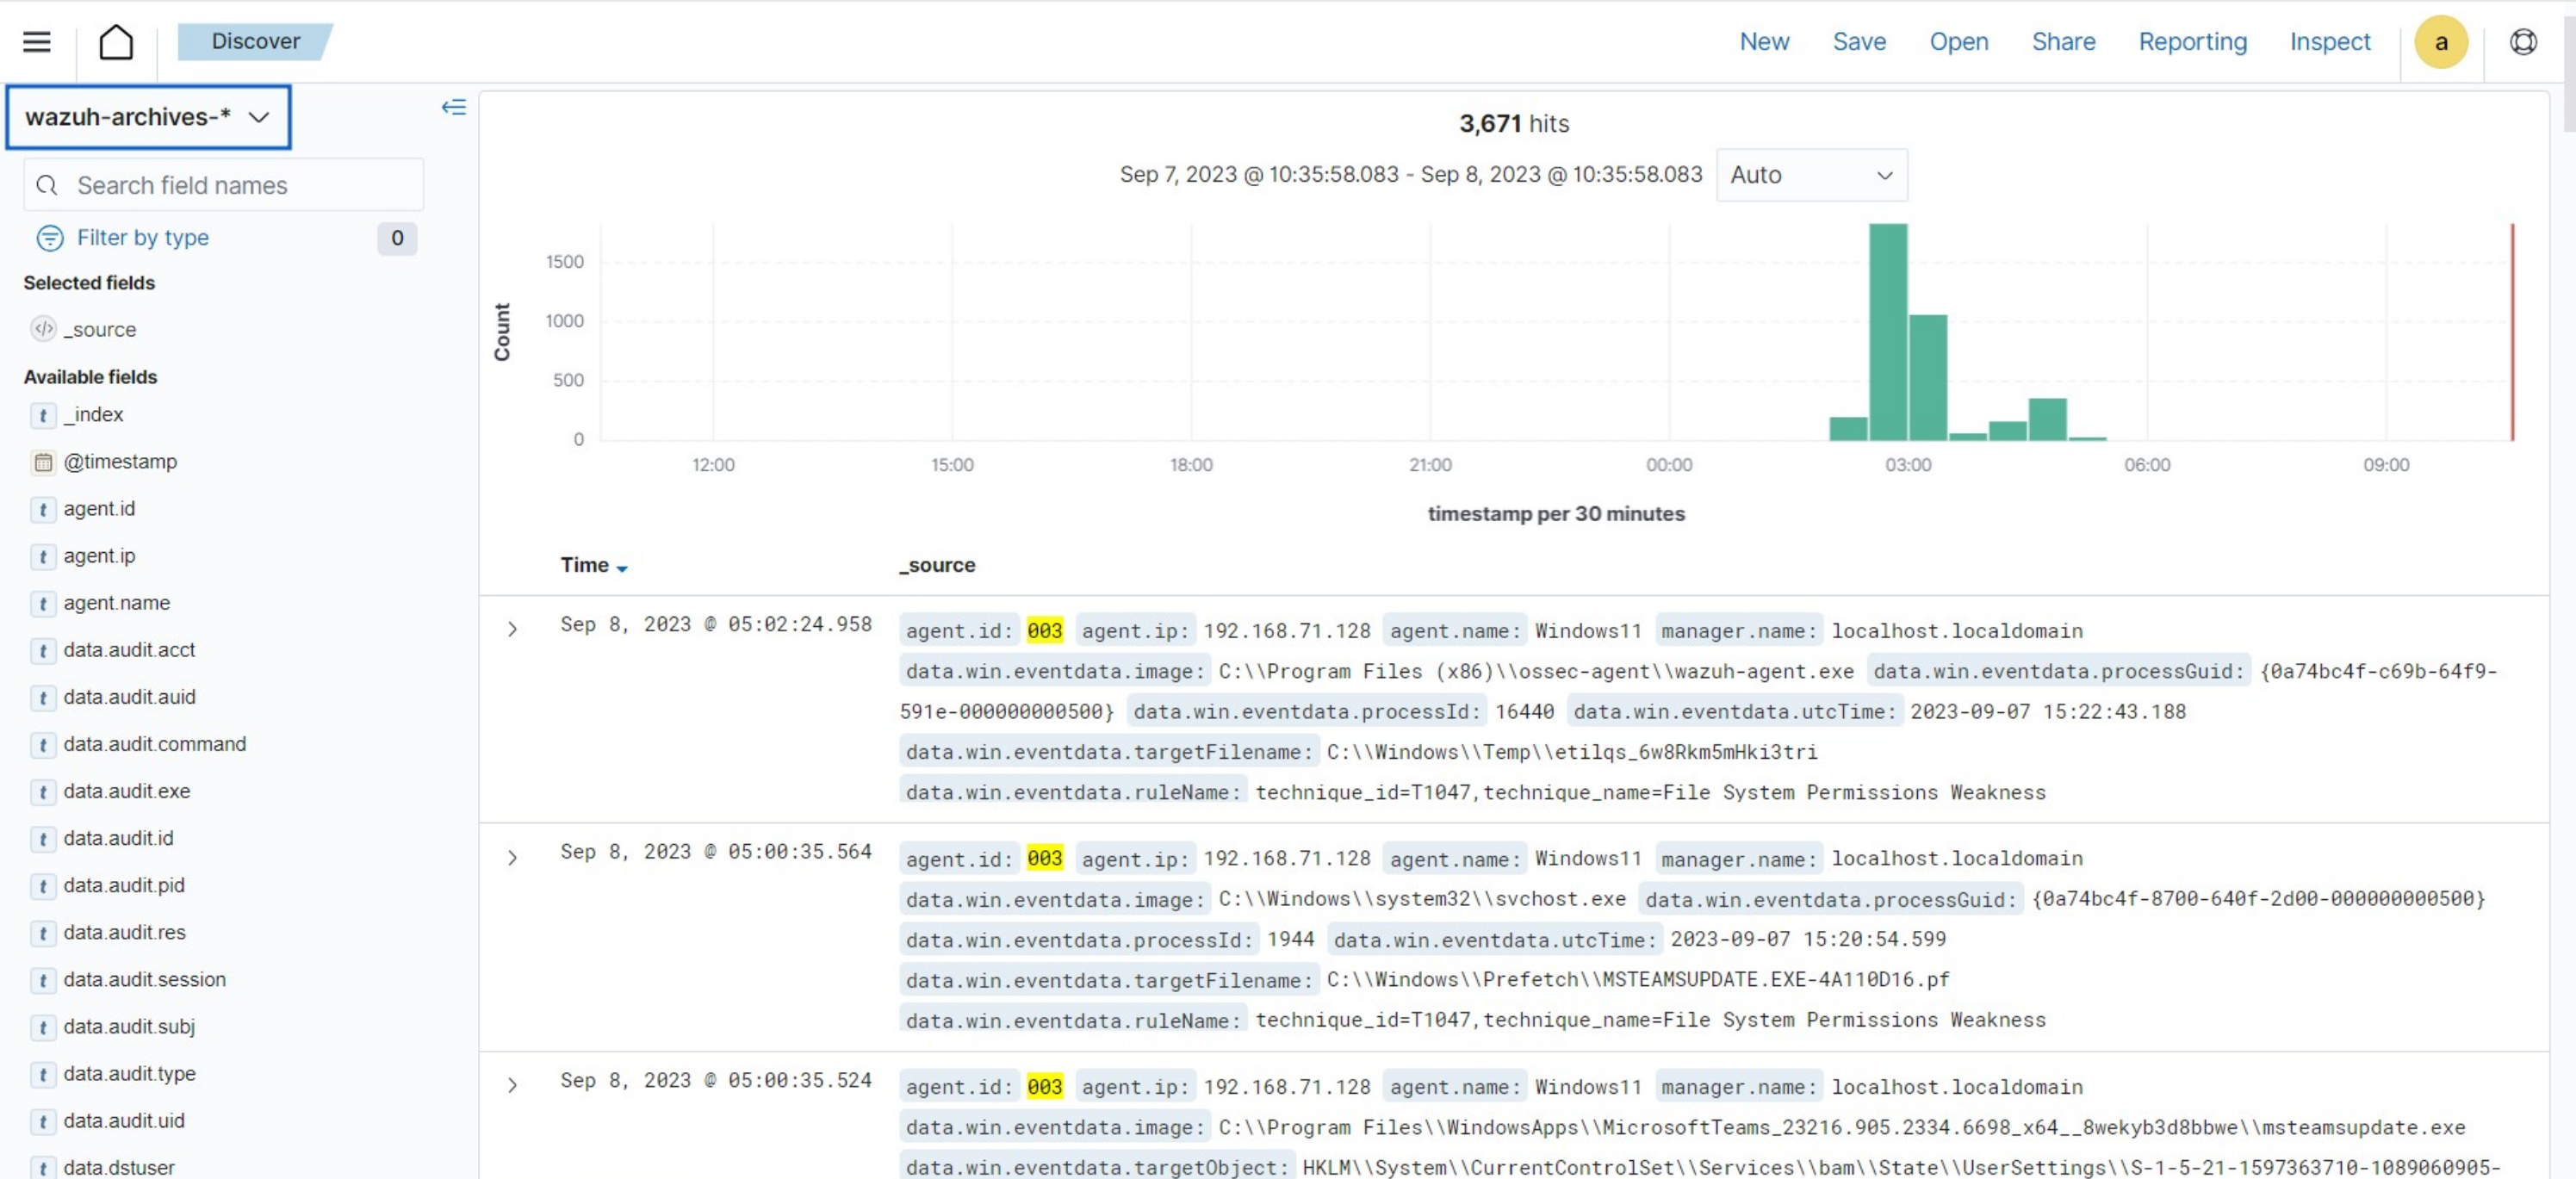
wazuh-monitoring index stores data about the state of Wazuh agents over a period of time. The state of the agent could be
Active,Disconnected, orNever connected. This information is very useful in tracking Wazuh agents that are not reporting to the dashboard for several reasons that need investigation. The image below shows the connection status of the agents on the Wazuh dashboard. The agent information as shown in the image is collected from thewazuh-monitoringindex.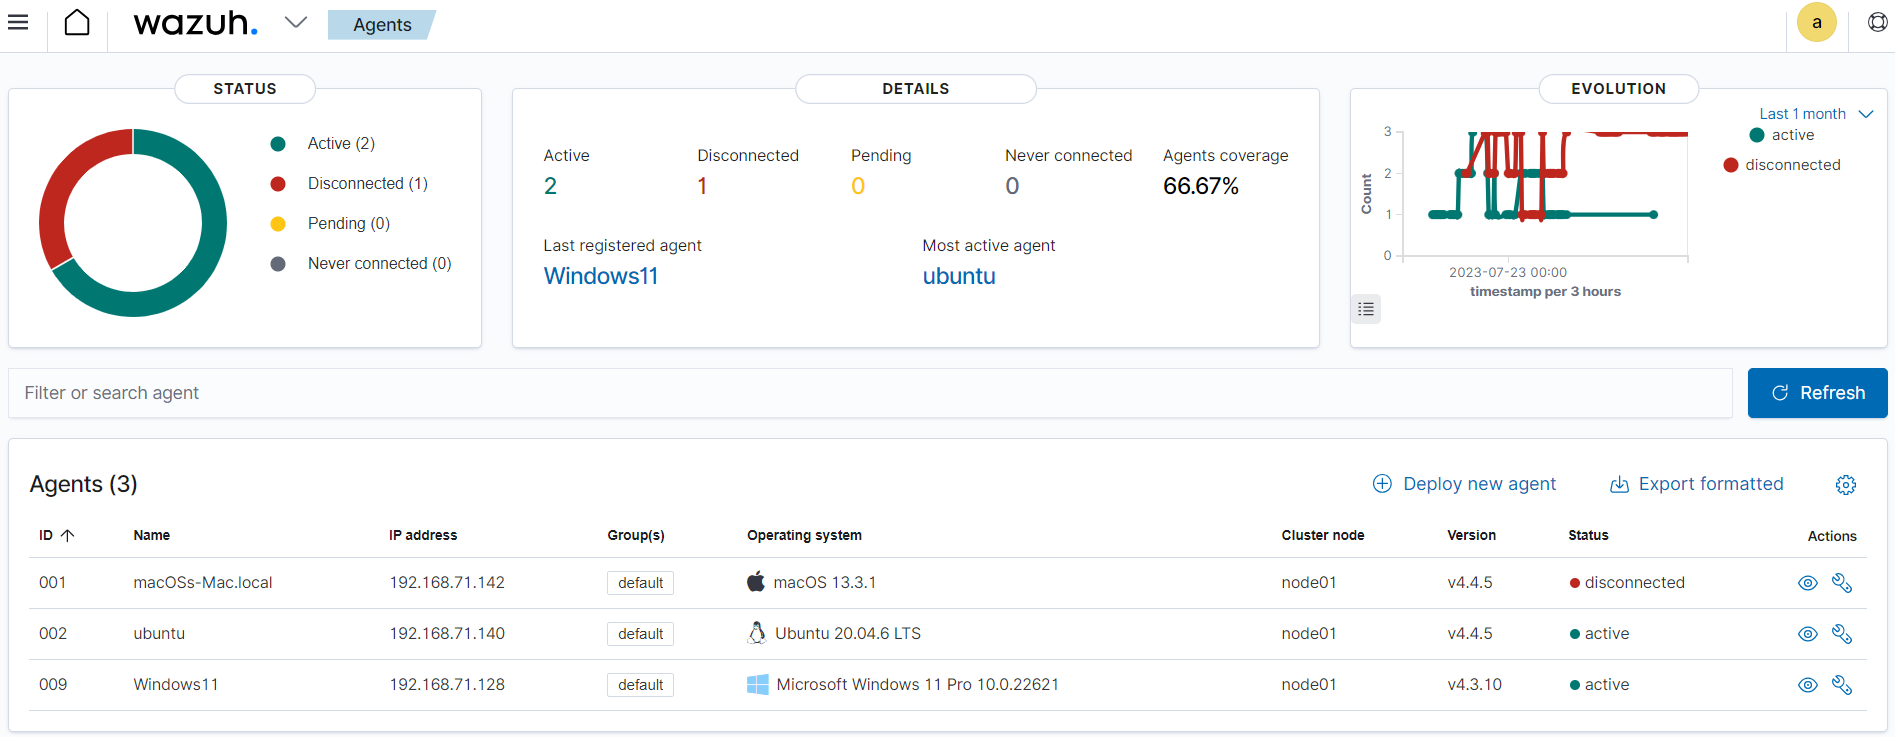
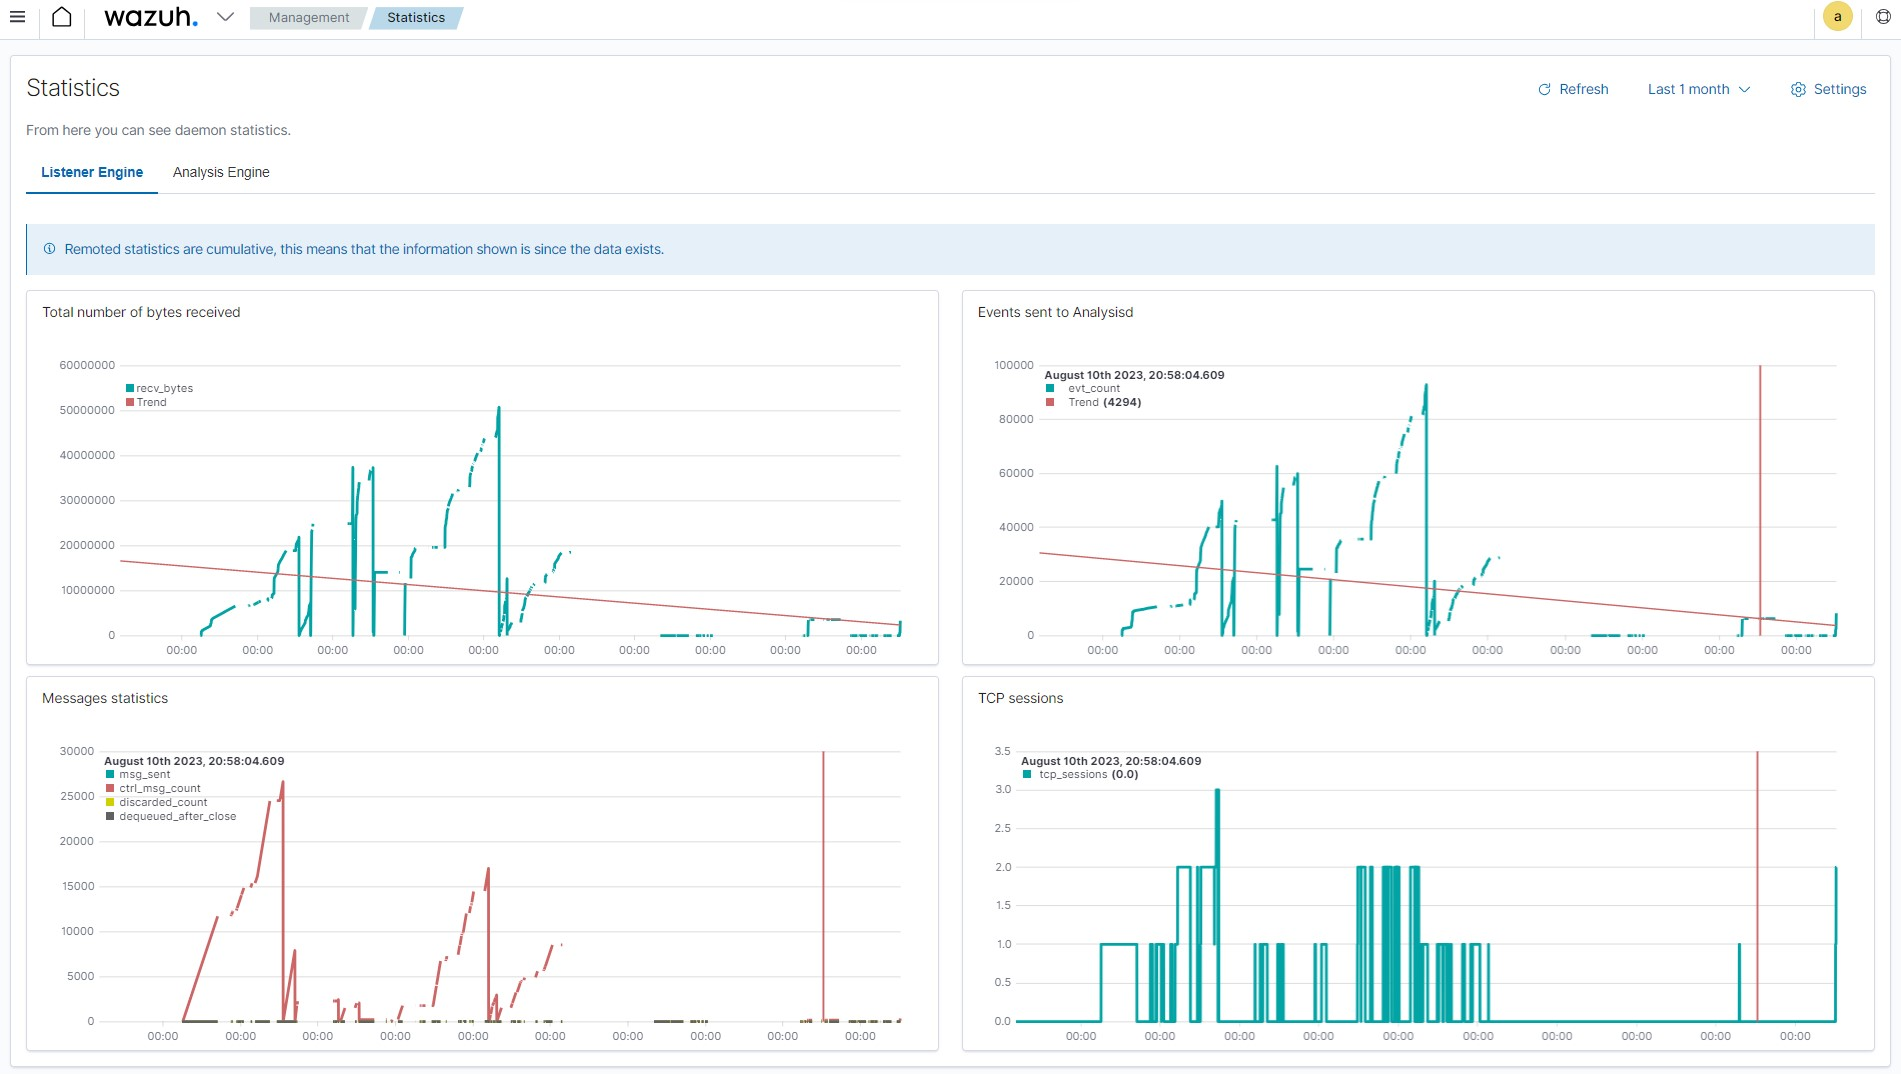
wazuh-statistics index stores performance data related to the Wazuh server. This information is critical to ensuring the Wazuh server performs optimally with the available computing resources. The image below shows performance-related events on the Wazuh dashboard.
Log data querying and visualization
The Wazuh dashboard offers log data querying and visualization capabilities. You can leverage the dashboard’s intuitive interface to conduct complex searches and queries to extract meaningful insights from the log data collected by Wazuh.
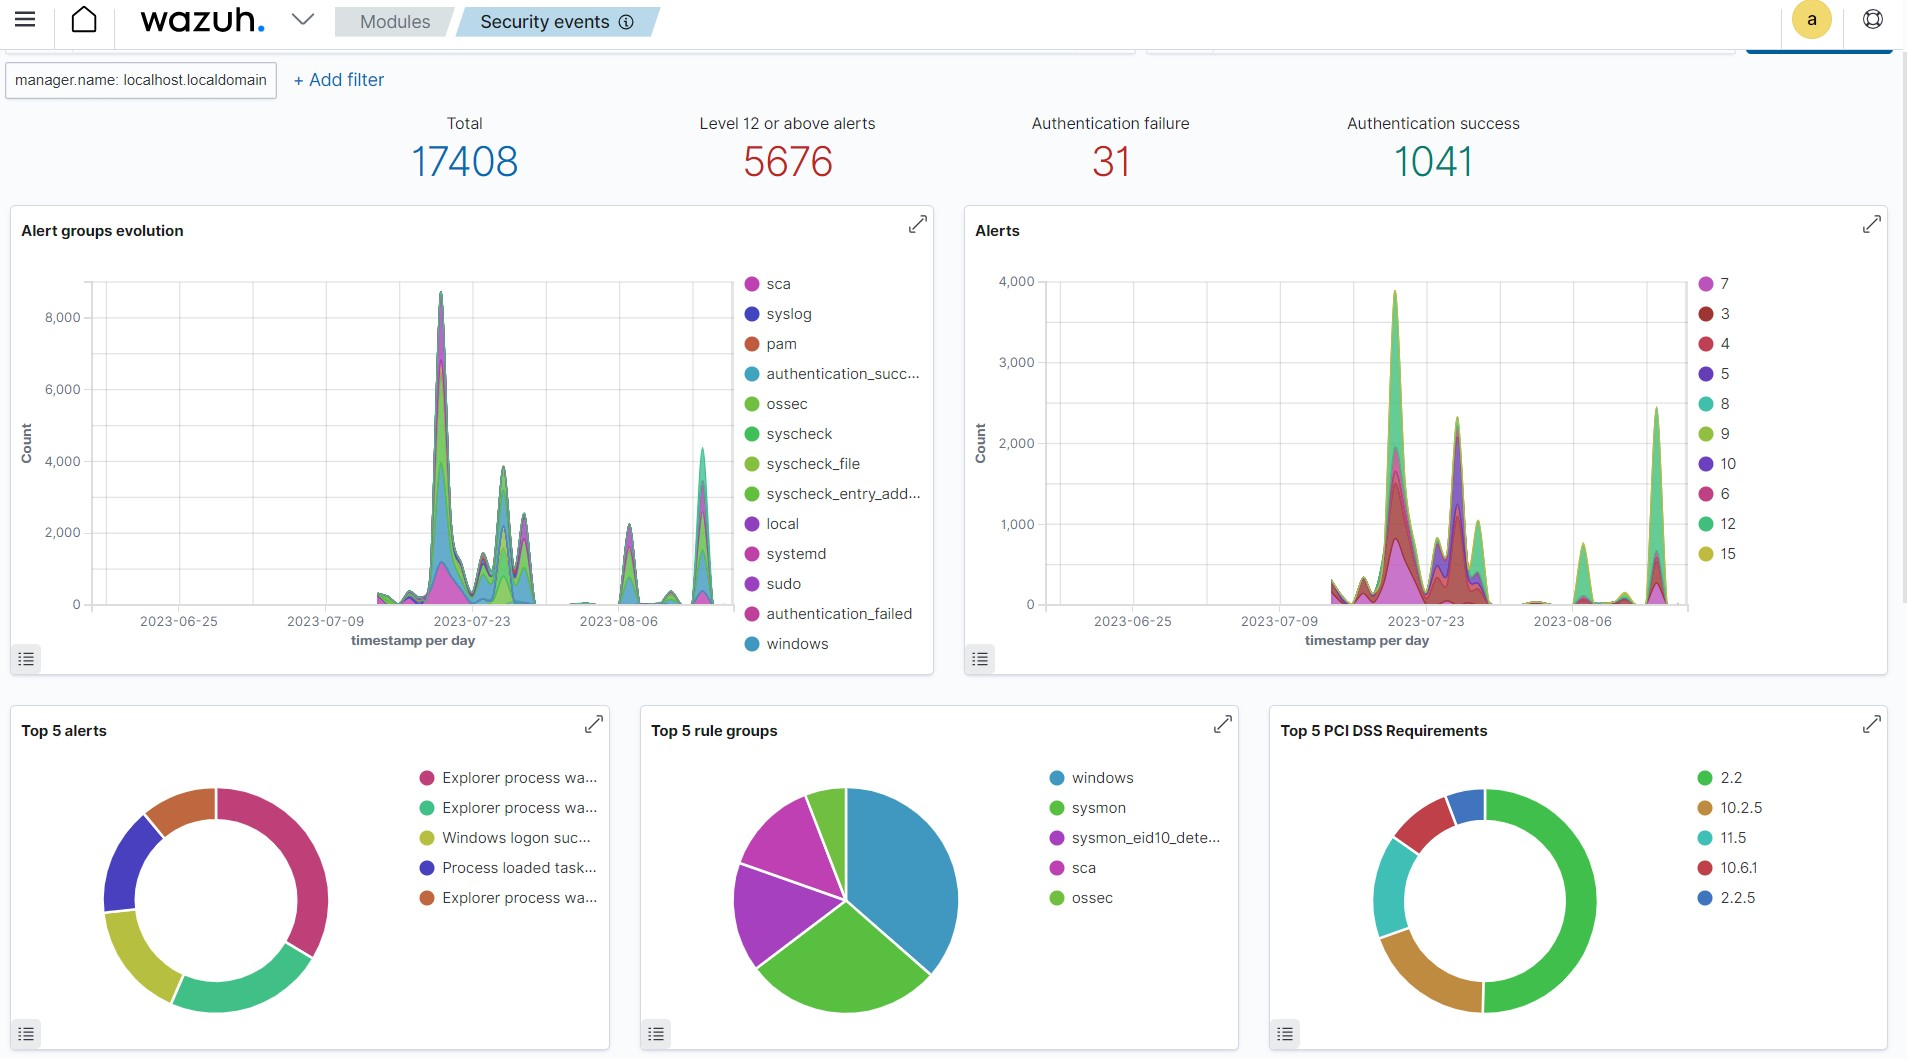
Wazuh provides a set of predefined dashboards and visualizations out of the box, specifically tailored to security monitoring and compliance use cases. These dashboards provide insight into common security events such as failed logins, malware detection, and system anomalies. You can further customize these dashboards to suit your specific needs and requirements. Below is a sample image of the Security event dashboard showing several interesting information like Top 5 PCI DSS Requirements, Top 5 alerts, and Alert groups evolution.
The Wazuh dashboard enables users to explore log entries in real time, apply various filters, and drill down into specific events or time ranges. This flexibility allows security analysts to identify trends, anomalies, and potential security incidents within their environment.
Wazuh allows users to create customized dashboards that display key performance indicators, security metrics, and real-time monitoring of critical systems and applications. Users can assemble multiple visualizations, such as pie charts, line graphs, and heat maps, onto a single dashboard, providing a holistic view of their infrastructure's security posture. The following blog posts detailed how to query and create custom dashboards: