Splunk integration
Splunk is a security platform that enables you to collect, search, analyze, visualize, and report real-time and historical data. Splunk indexes the data stream and parses it into a series of individual events that you can view and search.
Splunk users connect to Splunk through the command-line interface or through Splunk Web to administer their deployment. Splunk enables users to also manage, create knowledge objects, run searches, and create pivots and reports.
Wazuh integrates with Splunk in these ways:
Wazuh server integration
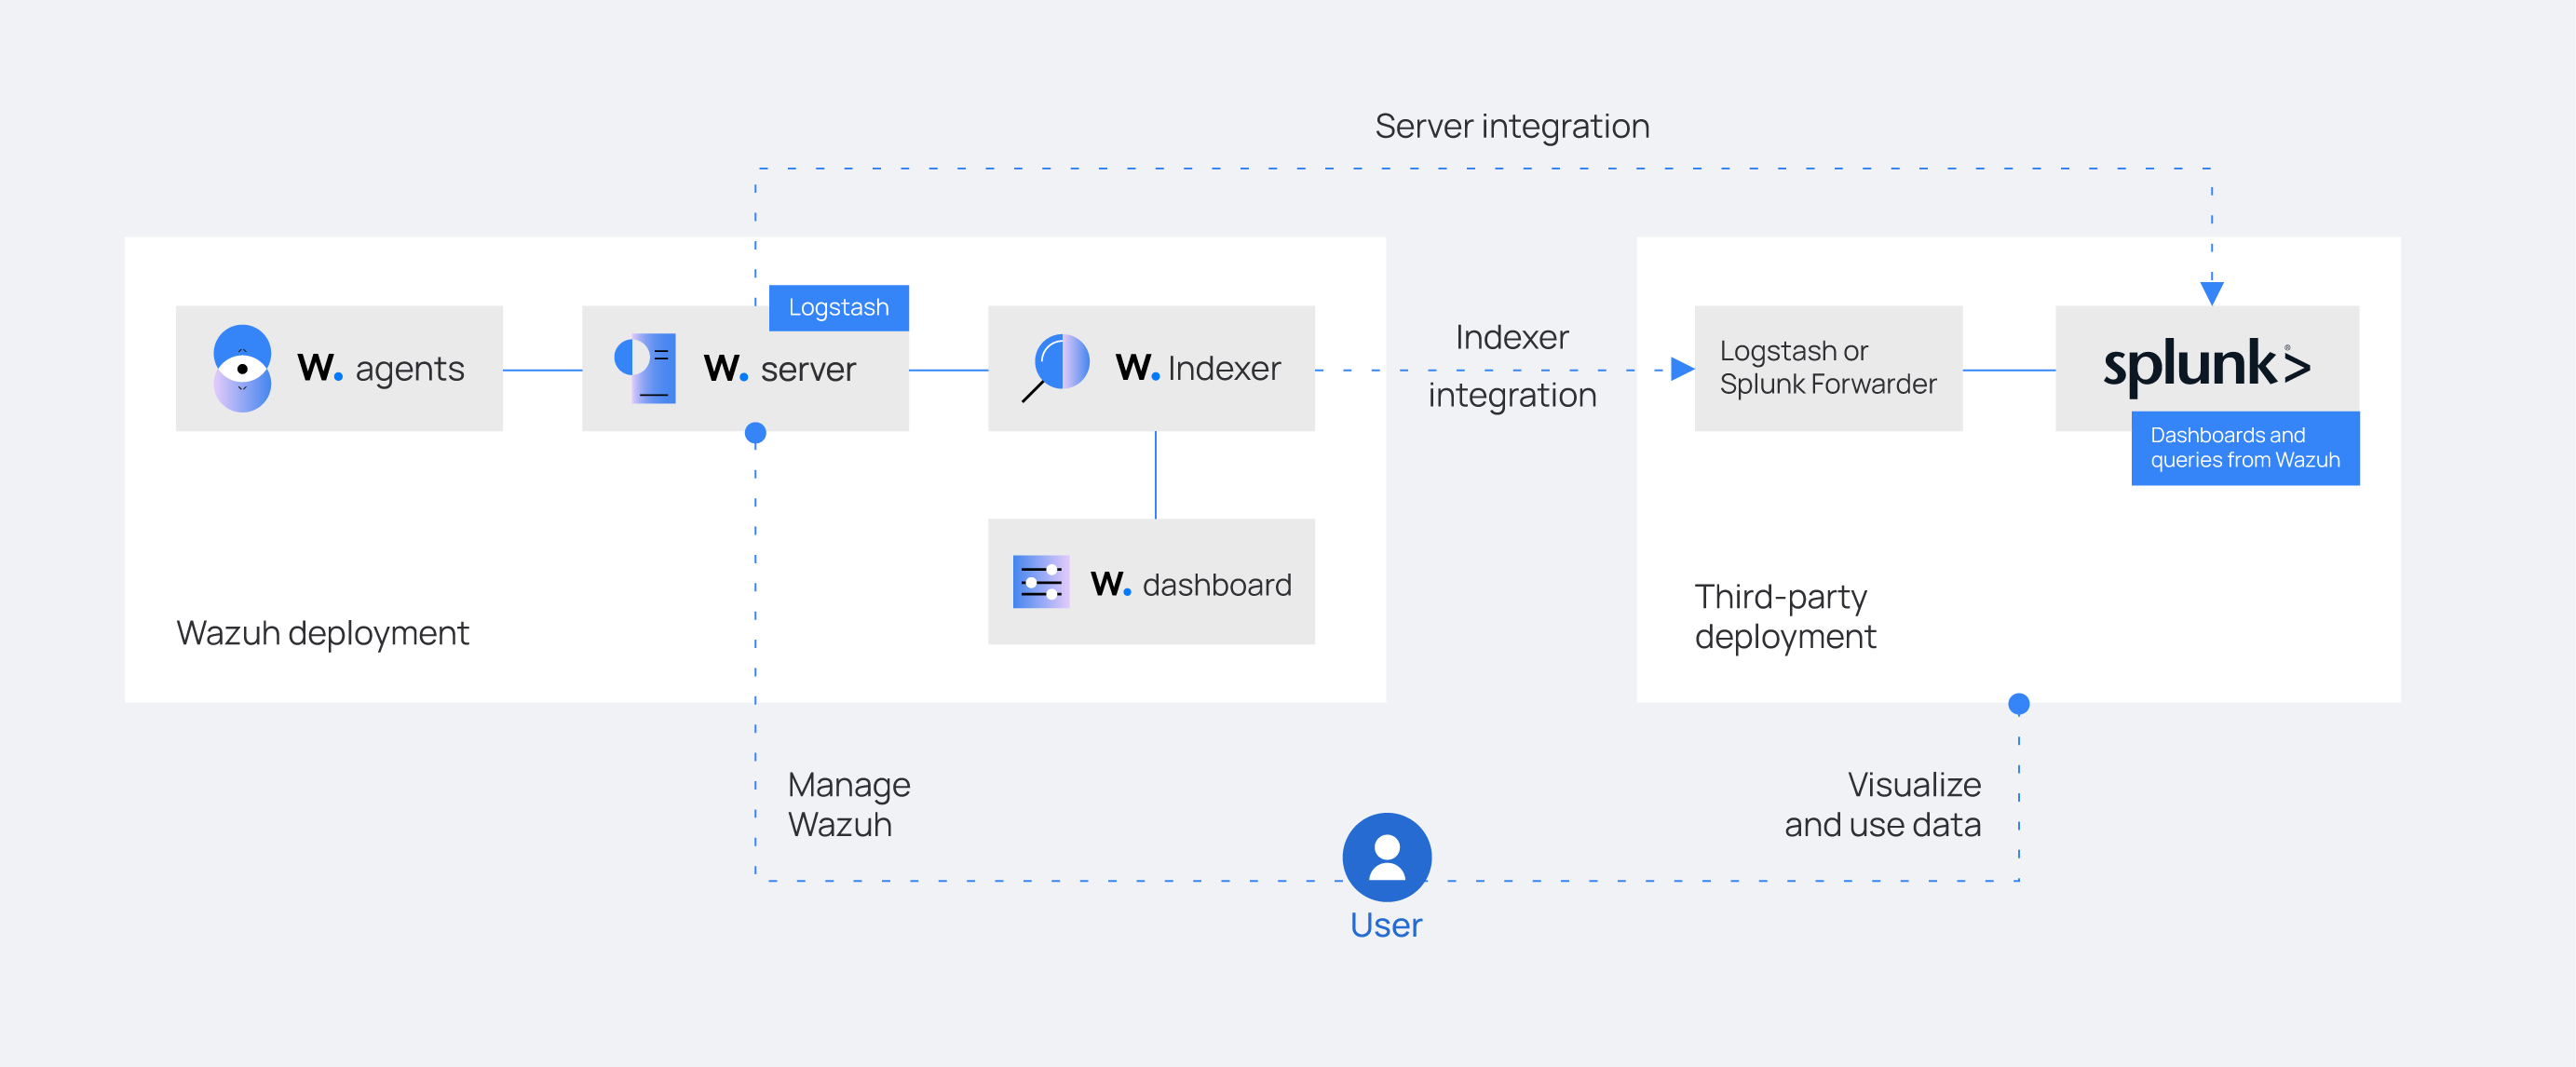
Wazuh indexer integration using Logstash
Before configuring Logstash, you need to set up the Splunk indexer to receive the forwarded events. Learn more about the Wazuh indexer integration and its necessary considerations.
Configuring the Splunk indexer
To complete the integration from the Wazuh indexer to Splunk, you must first configure Splunk to:
Enable the HTTP Event Collector.
Define the
wazuh-alertsSplunk index to store your logs.Create your Event Collector token.
Check the Splunk set up and use HTTP Event Collector documentation to set up the configuration, as seen below.

Installing Logstash
You must install Logstash on a dedicated server or on the server hosting the third-party indexer.
Perform the following steps on your Logstash server to set up your forwarder.
Follow the Elastic documentation to install Logstash. Ensure that you consider the requirements and performance tuning guidelines for running Logstash.
Run the following command to install the logstash-input-opensearch plugin. This plugin reads data from the Wazuh indexer into the Logstash pipeline.
$ sudo /usr/share/logstash/bin/logstash-plugin install logstash-input-opensearch
Copy the Wazuh indexer and Splunk root certificates to the Logstash server.
Note
You can add the certificates to any directory of your choice. For example, we added them in
/etc/logstash/wazuh-indexer-certsand/etc/logstash/splunk-certsrespectively.Give the
logstashuser the necessary permissions to read the copied certificates:$ sudo chmod -R 755 </PATH/TO/LOCAL/WAZUH_INDEXER/CERTIFICATE>/root-ca.pem $ sudo chmod -R 755 </PATH/TO/LOCAL/SPLUNK/CERTIFICATE>/ca.pem
Replace
</PATH/TO/LOCAL/WAZUH_INDEXER/CERTIFICATE>/root-ca.pemand</PATH/TO/LOCAL/SPLUNK/CERTIFICATE>/ca.pemwith your Wazuh indexer and Splunk certificate local paths on the Logstash endpoint respectively.
Configuring a pipeline
A Logstash pipeline allows Logstash to use plugins to read the data from the Wazuh indexes and send them to Splunk.
The Logstash pipeline requires access to the following secret values:
Wazuh indexer credentials
Splunk Event Collector token
To securely store these values, you can use the Logstash keystore.
Run the following commands on your Logstash server to set a keystore password:
$ set +o history
$ echo 'LOGSTASH_KEYSTORE_PASS="<MY_KEYSTORE_PASSWORD>"' | sudo tee /etc/sysconfig/logstash
$ export LOGSTASH_KEYSTORE_PASS=<MY_KEYSTORE_PASSWORD>
$ set -o history
$ sudo chown root /etc/sysconfig/logstash
$ sudo chmod 600 /etc/sysconfig/logstash
$ sudo systemctl start logstash
Where
<MY_KEYSTORE_PASSWORD>is your keystore password.Note
You need to create the
/etc/sysconfigfolder if it does not exist on your server.Run the following commands to securely store these values. When prompted, input your own values as follows:
$ sudo -E /usr/share/logstash/bin/logstash-keystore --path.settings /etc/logstash create
$ sudo -E /usr/share/logstash/bin/logstash-keystore --path.settings /etc/logstash add WAZUH_INDEXER_USERNAME
$ sudo -E /usr/share/logstash/bin/logstash-keystore --path.settings /etc/logstash add WAZUH_INDEXER_PASSWORD
$ sudo -E /usr/share/logstash/bin/logstash-keystore --path.settings /etc/logstash add SPLUNK_AUTH
Where:
WAZUH_INDEXER_USERNAMEandWAZUH_INDEXER_PASSWORDare keys representing your Wazuh indexer administrator username and password respectively.SPLUNK_AUTHis your Splunk Event Collector token.
Perform the following steps to configure the Logstash pipeline.
Create the configuration file
wazuh-splunk.confin/etc/logstash/conf.d/directory.$ sudo touch /etc/logstash/conf.d/wazuh-splunk.conf
Edit the file and add the following configuration. This sets the parameters required to run Logstash.
input {
  opensearch {
   hosts =>  ["<WAZUH_INDEXER_ADDRESS>:9200"]
   user  =>  "${WAZUH_INDEXER_USERNAME}"
   password  =>  "${WAZUH_INDEXER_PASSWORD}"
   index =>  "wazuh-alerts-4.x-*"
   ssl => true
   ca_file => "</PATH/TO/LOCAL/WAZUH_INDEXER/CERTIFICATE>/root-ca.pem"
   query =>  '{
       "query": {
          "range": {
             "@timestamp": {
                "gt": "now-1m"
             }
          }
       }
   }'
   schedule => "* * * * *"
  }
}
output {
   http {
      format => "json" # format of forwarded logs
      http_method => "post" # HTTP method used to forward logs
      url => "<SPLUNK_URL>:8088/services/collector/raw" # endpoint to forward logs to
      headers => ["Authorization", "Splunk ${SPLUNK_AUTH}"]
      cacert => "</PATH/TO/LOCAL/SPLUNK/CERTIFICATE>/ca.pem"
   }
}
Where:
<WAZUH_INDEXER_ADDRESS>is your Wazuh indexer address or addresses in case of cluster deployment.<SPLUNK_URL>is your Splunk URL.</PATH/TO/LOCAL/WAZUH_INDEXER/CERTIFICATE>/root-ca.pemis your Wazuh indexer certificate local path on the Logstash server. In our case we used/etc/logstash/wazuh-indexer-certs/root-ca.pem.</PATH/TO/LOCAL/SPLUNK/CERTIFICATE>/ca.pemis your Splunk certificate local path on the Logstash server. In our case, we used/etc/logstash/splunk-certs/ca.pem.
Note
For testing purposes, you can avoid SSL verification by replacing the line
cacert => "/PATH/TO/LOCAL/SPLUNK/ca.pem"withssl_verification_mode => "none".
Running Logstash
Once you have everything set, start Logstash from the command line with its configuration:
$ sudo systemctl stop logstash
$ sudo -E /usr/share/logstash/bin/logstash -f /etc/logstash/conf.d/wazuh-splunk.conf --path.settings /etc/logstash/
Make sure to use your own paths for the executable, the pipeline, and the settings files.
Ensure that Wazuh indexer RESTful API port (9200) is open on your Wazuh indexer. To verify that the necessary ports for Wazuh component communication are open, refer to the list of required ports.
After confirming that the configuration loads correctly without errors, cancel the command and run Logstash as a service. This way Logstash is not dependent on the lifecycle of the terminal it's running on. You can now enable and run Logstash as a service:
$ sudo systemctl enable logstash
$ sudo systemctl start logstash
Check Elastic documentation for more details on setting up and running Logstash.
Note
Any data indexed before the configuration is complete would not be forwarded to the Splunk indexes.
The /var/log/logstash/logstash-plain.log file in the Logstash instance has logs that you can check in case something fails.
After Logstash is successfully running, check how to verify the integration.
Wazuh server integration using Logstash
Before configuring Logstash, you need to set up the Splunk indexer to receive the forwarded events. Learn more about the Wazuh server integration and its necessary considerations.
Configuring Splunk indexer
First, set up Splunk as follows:
Enable HTTP Event Collector.
Define the
wazuh-alertsSplunk index to store your logs.Create your Event Collector token.
Check the Splunk set up and use HTTP Event Collector documentation to achieve this.
Installing Logstash
Logstash must forward the data from the Wazuh server to the Splunk indexes created previously.
Follow the Elastic documentation to install Logstash on the same system as the Wazuh server.
Copy the Splunk root certificates to the Wazuh server.
Note
You can add the certificates to any directory of your choice. For example, we added them in
/etc/logstash/splunk-certs.Give the
logstashuser the necessary permissions to read the copied certificates:$ sudo chmod -R 755 </PATH/TO/LOCAL/SPLUNK/CERTIFICATE>/ca.pem
Replace
</PATH/TO/LOCAL/SPLUNK/CERTIFICATE>/ca.pemwith your Splunk certificate local path on the Wazuh server.
Configuring a pipeline
A Logstash pipeline allows Logstash to use plugins to read the data in the Wazuh /var/ossec/logs/alerts/alerts.json alerts file and send them to Splunk.
The Logstash pipeline requires access to your Splunk Event Collector Token.
To securely store these values, you can use the Logstash keystore.
Run the following commands on your Logstash server to set a keystore password:
$ set +o history
$ echo 'LOGSTASH_KEYSTORE_PASS="<MY_KEYSTORE_PASSWORD>"'| sudo tee /etc/sysconfig/logstash
$ export LOGSTASH_KEYSTORE_PASS=<MY_KEYSTORE_PASSWORD>
$ set -o history
$ sudo chown root /etc/sysconfig/logstash
$ sudo chmod 600 /etc/sysconfig/logstash
$ sudo systemctl start logstash
Where
<MY_KEYSTORE_PASSWORD>is your keystore password.Note
You need to create the
/etc/sysconfigfolder if it does not exist on your server.Run the following commands to securely store these values. When prompted, input your own values. Where
SPLUNK_AUTHis your Splunk Event Collector token.$ sudo -E /usr/share/logstash/bin/logstash-keystore --path.settings /etc/logstash create $ sudo -E /usr/share/logstash/bin/logstash-keystore --path.settings /etc/logstash add SPLUNK_AUTH
Configuring the pipeline with the Tail mode and the JSON codec for the file input plugin allows Logstash to read the Wazuh alerts file.
To configure the Logstash pipeline do the following.
Copy the Splunk root certificates to the Wazuh server. You can add the certificate to any directory of your choice. In our case, we add it in the
/etc/logstash/splunk-certsdirectory.Create the configuration file
wazuh-splunk.confin/etc/logstash/conf.d/directory:$ sudo touch /etc/logstash/conf.d/wazuh-splunk.conf
Edit the
wazuh-splunk.conffile and add the following configuration. This sets the parameters required to run logstash.input { file { id => "wazuh_alerts" codec => "json" start_position => "beginning" stat_interval => "1 second" path => "/var/ossec/logs/alerts/alerts.json" mode => "tail" ecs_compatibility => "disabled" } } output { http { format => "json" # format of forwarded logs http_method => "post" # HTTP method used to <SPLUNK_URL>forward logs url => "<SPLUNK_URL>:8088/services/collector/raw" # endpoint to forward logs to headers => ["Authorization", "Splunk ${SPLUNK_AUTH}"] cacert => "</PATH/TO/LOCAL/SPLUNK/CERTIFICATE>/ca.pem" } }Where:
<SPLUNK_URL>is your Splunk URL.</PATH/TO/LOCAL/SPLUNK/CERTIFICATE>/ca.pemis your Splunk certificate local path on the Logstash server. In our case we used/etc/logstash/splunk-certs/ca.pem.
Note
For testing purposes, you can avoid SSL verification by replacing the line
cacert => "</PATH/TO/LOCAL/SPLUNK/CERTIFICATE>/ca.pem"withssl_verification_mode => "none".By default, the
/var/ossec/logs/alerts/alerts.jsonfile is owned by thewazuhuser with restrictive permissions. You must add thelogstashuser to thewazuhgroup so it can read the file when running Logstash as a service:$ sudo usermod -a -G wazuh logstash
Running Logstash
Once you have everything set, start Logstash with its configuration:
$ sudo systemctl stop logstash
$ sudo -E /usr/share/logstash/bin/logstash -f /etc/logstash/conf.d/wazuh-splunk.conf --path.settings /etc/logstash/
Make sure to use your own paths for the executable, the pipeline, and the settings files.
Ensure that Wazuh server RESTful API port (55000) is open on your Wazuh server. To verify that the necessary ports for Wazuh component communication are open, refer to the list of required ports.
After confirming that the configuration loads correctly without errors, cancel the command and run Logstash as a service. This way Logstash is not dependent on the lifecycle of the terminal it's running on. You can now enable and run Logstash as a service:
$ sudo systemctl enable logstash
$ sudo systemctl start logstash
Check Elastic documentation for more details on setting up and running Logstash.
Note
Any data indexed before the configuration is complete would not be forwarded to the Splunk indexes.
The /var/log/logstash/logstash-plain.log file in the Logstash instance has logs that you can check in case something fails.
After Logstash is successfully running, check how to verify the integration.
Wazuh server integration using the Splunk forwarder
Before configuring the Splunk forwarder, you need to configure the Splunk indexer to receive the forwarded events. For this, you need to perform the following tasks on your Splunk server instance:
Set a receiving port.
Create the
wazuh-alertsSplunk indexes.
Configuring Splunk indexer
Configuring the receiving port
Perform the following actions in Splunk Web:
Go to Settings > Forwarding and receiving.
Under Receive data, click Add new.
Enter
9997in the Listen on this port input box and click Save.
Alternatively, you can configure the receiving port in the following way.
Edit /opt/splunk/etc/system/local/inputs.conf on the Splunk server to add the following configuration:
[splunktcp://9997]
connection_host = none
For more details, visit enable a receiver section in the Splunk documentation.
Configuring indexes
Perform the following actions to configure the wazuh-alerts indexes in Splunk Web.
Go to Settings > Indexes > New Index.
Enter
wazuh-alertsin Index name and click Save.
Alternatively, you can add the following configuration to the /opt/splunk/etc/system/local/indexes.conf file on the Splunk server to create the indexes:
[wazuh-alerts]
coldPath = $SPLUNK_DB/wazuh/colddb
enableDataIntegrityControl = 1
enableTsidxReduction = 1
homePath = $SPLUNK_DB/wazuh/db
maxTotalDataSizeMB = 512000
thawedPath = $SPLUNK_DB/wazuh/thaweddb
timePeriodInSecBeforeTsidxReduction = 15552000
tsidxReductionCheckPeriodInSec =
Installing Splunk forwarder on the Wazuh server
The Splunk forwarder must stream the data from the Wazuh server to the Splunk indexes created previously.
Follow the Splunk documentation to install the Splunk universal forwarder on the Wazuh Server.
Note
In Cloud instances, you need to configure the credentials for the Splunk forwarder. Check the configure the Splunk Cloud Platform universal forwarder credentials package documentation to learn how to do this.
Configuring the Splunk forwarder
Set the following configuration in
/opt/splunkforwarder/etc/system/local/inputs.conffile. This configures the Splunk forwarder to monitor the Wazuh/var/ossec/logs/alerts/alerts.jsonalerts file. Where<WAZUH_SERVER_HOST>is a name of your choice.[monitor:///var/ossec/logs/alerts/alerts.json] disabled = 0 host = <WAZUH_SERVER_HOST> index = wazuh-alerts sourcetype = wazuh-alertsSet the following configuration in the
/opt/splunkforwarder/etc/system/local/props.conffile to parse the data forwarded to Splunk:[wazuh-alerts] DATETIME_CONFIG = INDEXED_EXTRACTIONS = json KV_MODE = none NO_BINARY_CHECK = true category = Application disabled = false pulldown_type = true
Set the following configuration in the
/opt/splunkforwarder/etc/system/local/outputs.conffile to define how the alerts are forwarded to Splunk. Where<SPLUNK_INDEXER_ADDRESS>is your Splunk server IP address. For Cloud instances, the Splunk indexer address is the cloud instance address.defaultGroup = default-autolb-group [tcpout:default-autolb-group] server = <SPLUNK_INDEXER_ADDRESS>:9997 [tcpout-server://<SPLUNK_INDEXER_ADDRESS>:9997]
Running the forwarder
Start the Splunk Forwarder following Splunk documentation.
Run the following command to verify the connection is established:
$ sudo /opt/splunkforwarder/bin/splunk list forward-server
Active forwards:
     <SPLUNK_INDEXER_ADDRESS>:9997
Configured but inactive forwards:
     None
Note
The /opt/splunkforwarder/var/log/splunk/splunkd.log file in the forwarder instance has logs that you can check in case something fails.
Verifying the integration
To check the integration with Splunk, access Splunk Web and search for the wazuh-alerts Splunk index as follows.
Go to Search & Reporting.
Enter
index="wazuh-alerts"and run the search.
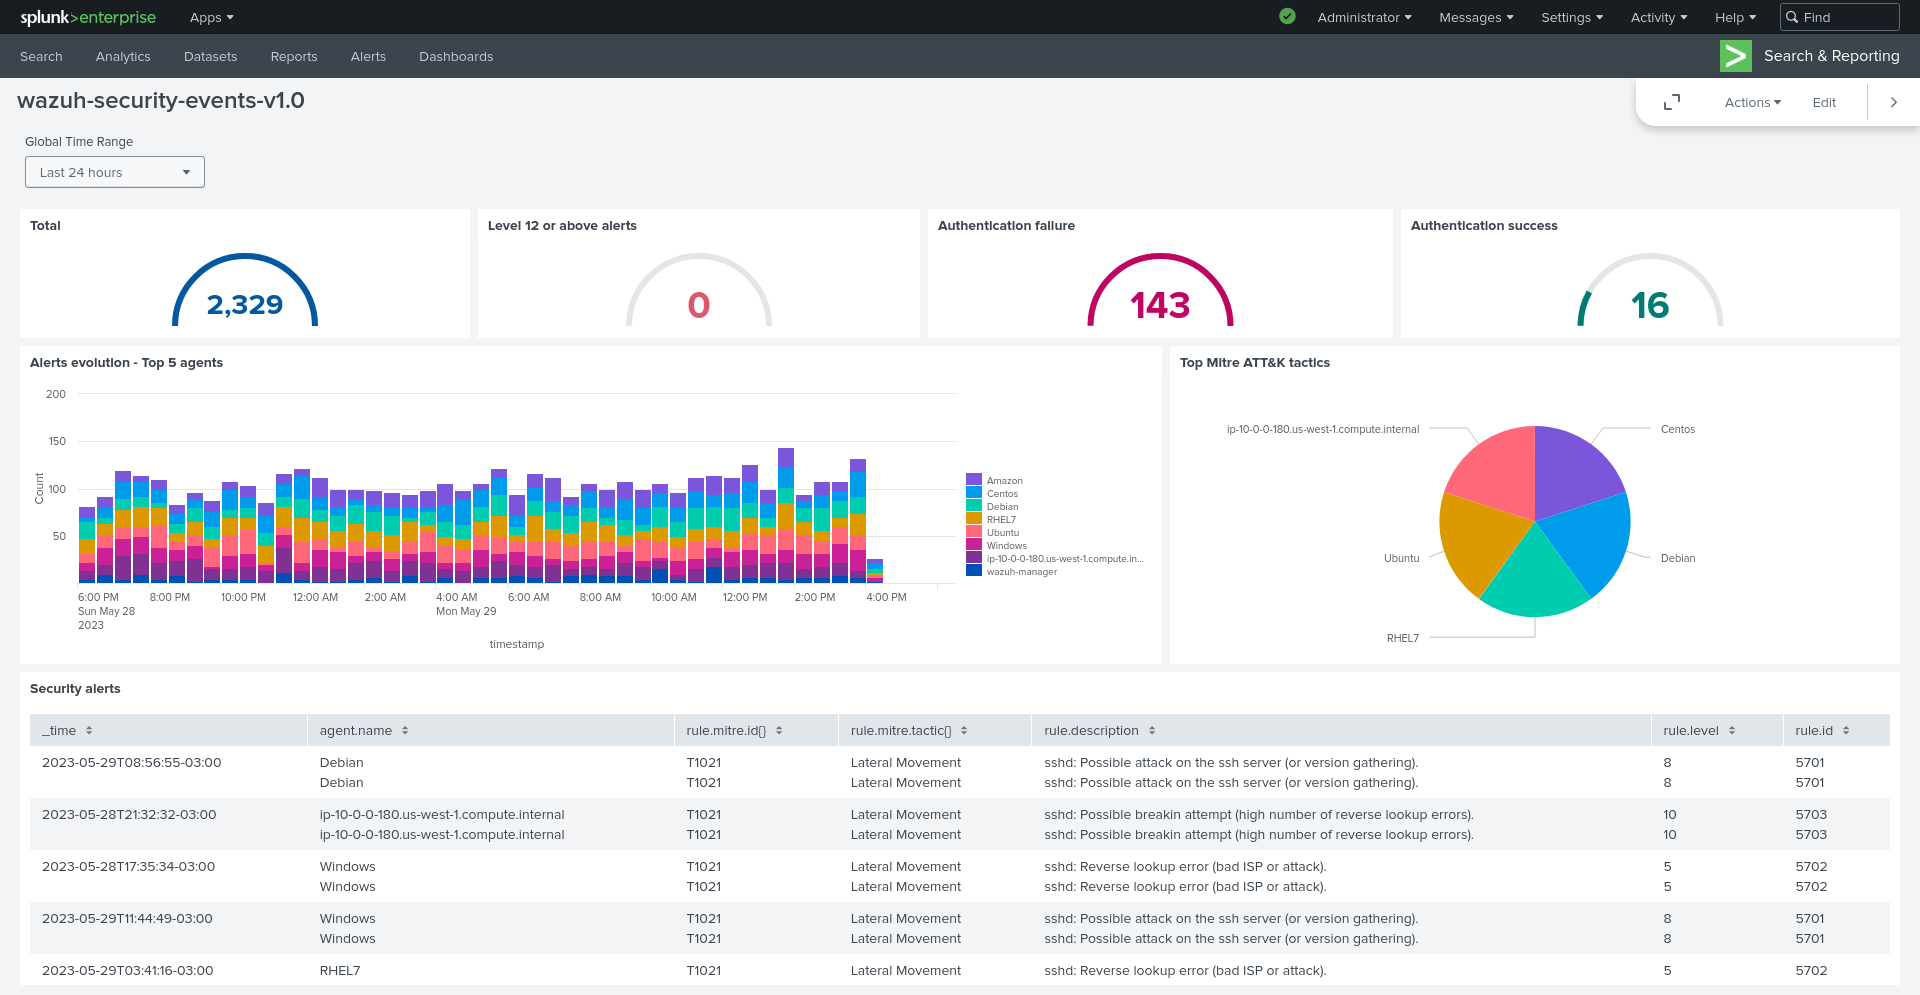
Splunk dashboards
Wazuh provides several dashboards for Splunk.
After you complete the Splunk integration, you can use these dashboards to display your Wazuh alerts in Splunk.
To import the Wazuh dashboards for Splunk, repeat the following steps for each dashboard file you want to use.
Download the dashboard file that you need from the list of Splunk dashboards provided above.
Navigate to Search & Reporting in Splunk Web.
Click Dashboards and click Create New Dashboard.
Enter a dashboard title and select Dashboard Studio.
Note
The dashboard title you enter here will be overwritten with the original title set in the dashboard template.
Select Grid and click on Create.
Click on the </> Source icon.
Paste your dashboard file content, replacing everything in the source.
Click Back and click Save.