Components
The Wazuh platform provides XDR and SIEM features to protect your cloud, container, and server workloads. These include log data analysis, intrusion and malware detection, file integrity monitoring, configuration assessment, vulnerability detection, and support for regulatory compliance.
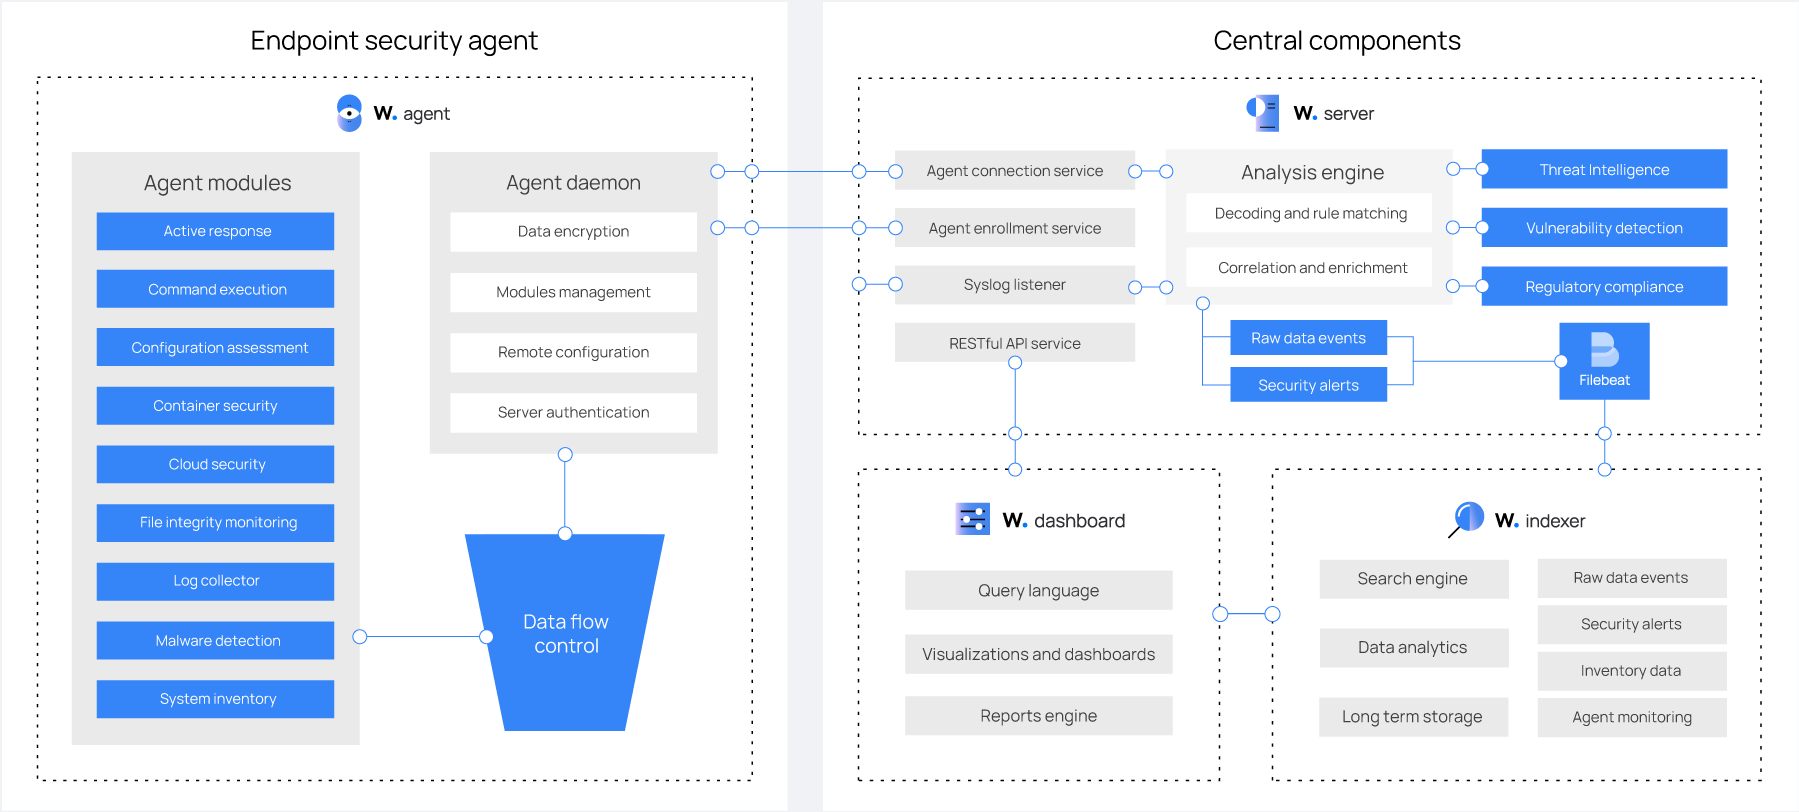
The Wazuh solution is based on the Wazuh agent, which is deployed on the monitored endpoints, and on three central components: the Wazuh server, the Wazuh indexer, and the Wazuh dashboard.
The Wazuh indexer is a highly scalable, full-text search and analytics engine. This central component indexes and stores alerts generated by the Wazuh server.
The Wazuh server analyzes data received from the agents. It processes it through decoders and rules, using threat intelligence to look for well-known indicators of compromise (IOCs). A single server can analyze data from hundreds or thousands of agents, and scale horizontally when set up as a cluster. This central component is also used to manage the agents, configuring and upgrading them remotely when necessary.
The Wazuh dashboard is the web user interface for data visualization and analysis. It includes out-of-the-box dashboards for threat hunting, regulatory compliance (e.g., PCI DSS, GDPR, CIS, HIPAA, NIST 800-53), detected vulnerable applications, file integrity monitoring data, configuration assessment results, cloud infrastructure monitoring events, and others. It is also used to manage Wazuh configuration and to monitor its status.
Wazuh agents are installed on endpoints such as laptops, desktops, servers, cloud instances, or virtual machines. They provide threat prevention, detection, and response capabilities. They run on operating systems such as Linux, Windows, macOS, Solaris, AIX, and HP-UX.
In addition to agent-based monitoring capabilities, the Wazuh platform can monitor agent-less devices such as firewalls, switches, routers, or network IDS, among others. For example, a system log data can be collected via Syslog, and its configuration can be monitored through periodic probing of its data, via SSH or through an API.
The diagram below represents the Wazuh components and data flow.