Wazuh server
The Wazuh server is the central component responsible for analyzing data collected from Wazuh agents and agentless devices. It detects threats, anomalies, and regulatory compliance violations in real time, generating alerts when suspicious activity is identified. Beyond detection, the Wazuh server enables centralized management by remotely configuring Wazuh agents and continuously monitoring their operational status.
The Wazuh server leverages multiple threat intelligence sources and enriches alerts with contextual data to enhance detection accuracy. This includes mapping events to the MITRE ATT&CK framework, detecting vulnerabilities with the Wazuh CTI service, and aligning findings with regulatory standards such as PCI DSS, GDPR, HIPAA, CIS benchmarks, and NIST 800-53. These capabilities provide security teams with actionable insights for threat hunting, vulnerability detection, and regulatory compliance monitoring.
The Wazuh server integrates with external platforms to support streamlined workflows. Examples include ticketing systems such as ServiceNow, Jira, and PagerDuty, as well as communication tools like Slack. These integrations help automate incident tracking, accelerate response times, and improve collaboration within security operations teams.
Server architecture
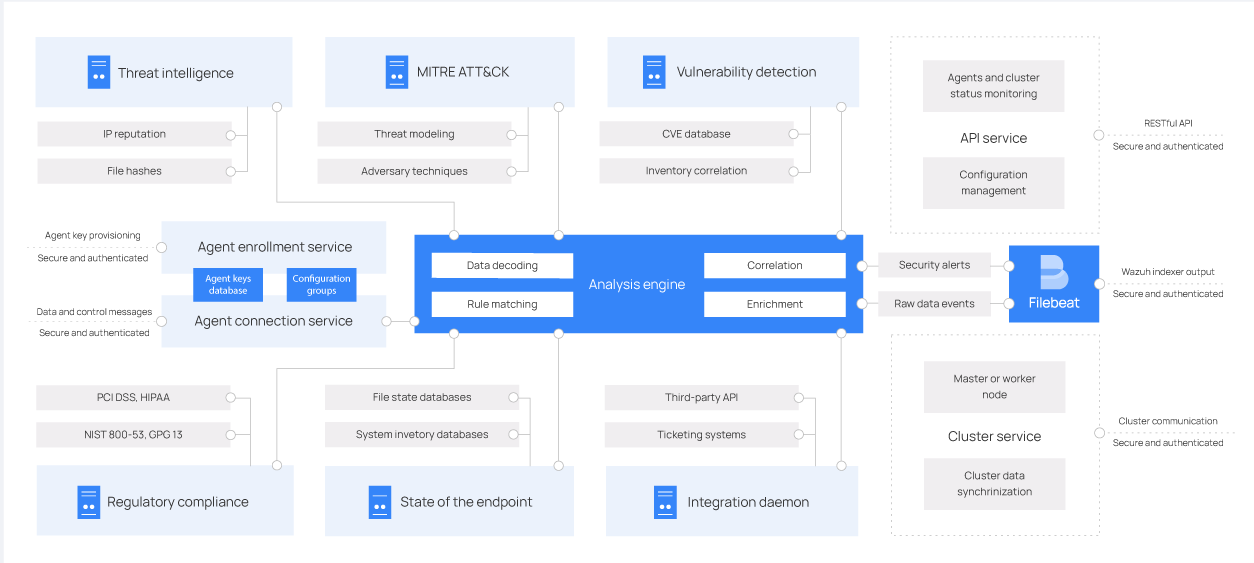
The Wazuh server includes the Analysis engine, Wazuh server API, agent enrollment service, agent connection service, cluster daemon, and Filebeat. It runs on Linux across physical endpoints, virtual machines, containers, or cloud instances. On Windows endpoints, deploy using Wazuh Docker.
The diagram below shows the Wazuh server architecture and components.

Server components
The Wazuh server comprises several components listed below that have different functions, such as enrolling new agents, validating each agent's identity, and encrypting the communications between the Wazuh agent and the Wazuh server.
Agent enrollment service: Registers new Wazuh agents and generates and distributes unique authentication keys to each agent. It runs as a network service and supports TLS and SSL certificate–based authentication, or enrollment using a fixed password.
Agent connection service: Manages communication between Wazuh agents and the Wazuh server. It validates Wazuh agent identities using enrollment keys, enforces encryption for secure data transfer, and enables centralized configuration management to push updated agent settings remotely.
Analysis engine: At the core of Wazuh threat detection capabilities, the Analysis engine processes received security data using decoders and rules:
Decoders classify log types (for example, Windows events, SSH logs, web server logs) and extract relevant fields such as IP addresses, usernames, and event IDs.
Rules match decoded events against known patterns to detect threats and anomalies. When triggered, rules generate alerts and invoke incident response actions such as blocking IP addresses, terminating malicious processes, or removing malware artifacts.
Wazuh server API: Provides a programmatic interface for interacting with the Wazuh server. It allows administrators using the Wazuh dashboard or command line to perform the following, but not limited to:
Configure and manage agents or servers
Monitor system health and infrastructure status
Query alerts and endpoint data
Create or update decoders and rules
To learn more, visit the Wazuh server API documentation.
Wazuh cluster daemon: Enables horizontal scaling by linking multiple Wazuh servers into a cluster. Using a load balancer provides high availability, fault tolerance, and load distribution.
Filebeat: Forwards events and alerts from the Wazuh analysis engine to the Wazuh indexer.
Visit the installation guide and user manual for more information about the Wazuh server.