Querying the Wazuh agent configuration
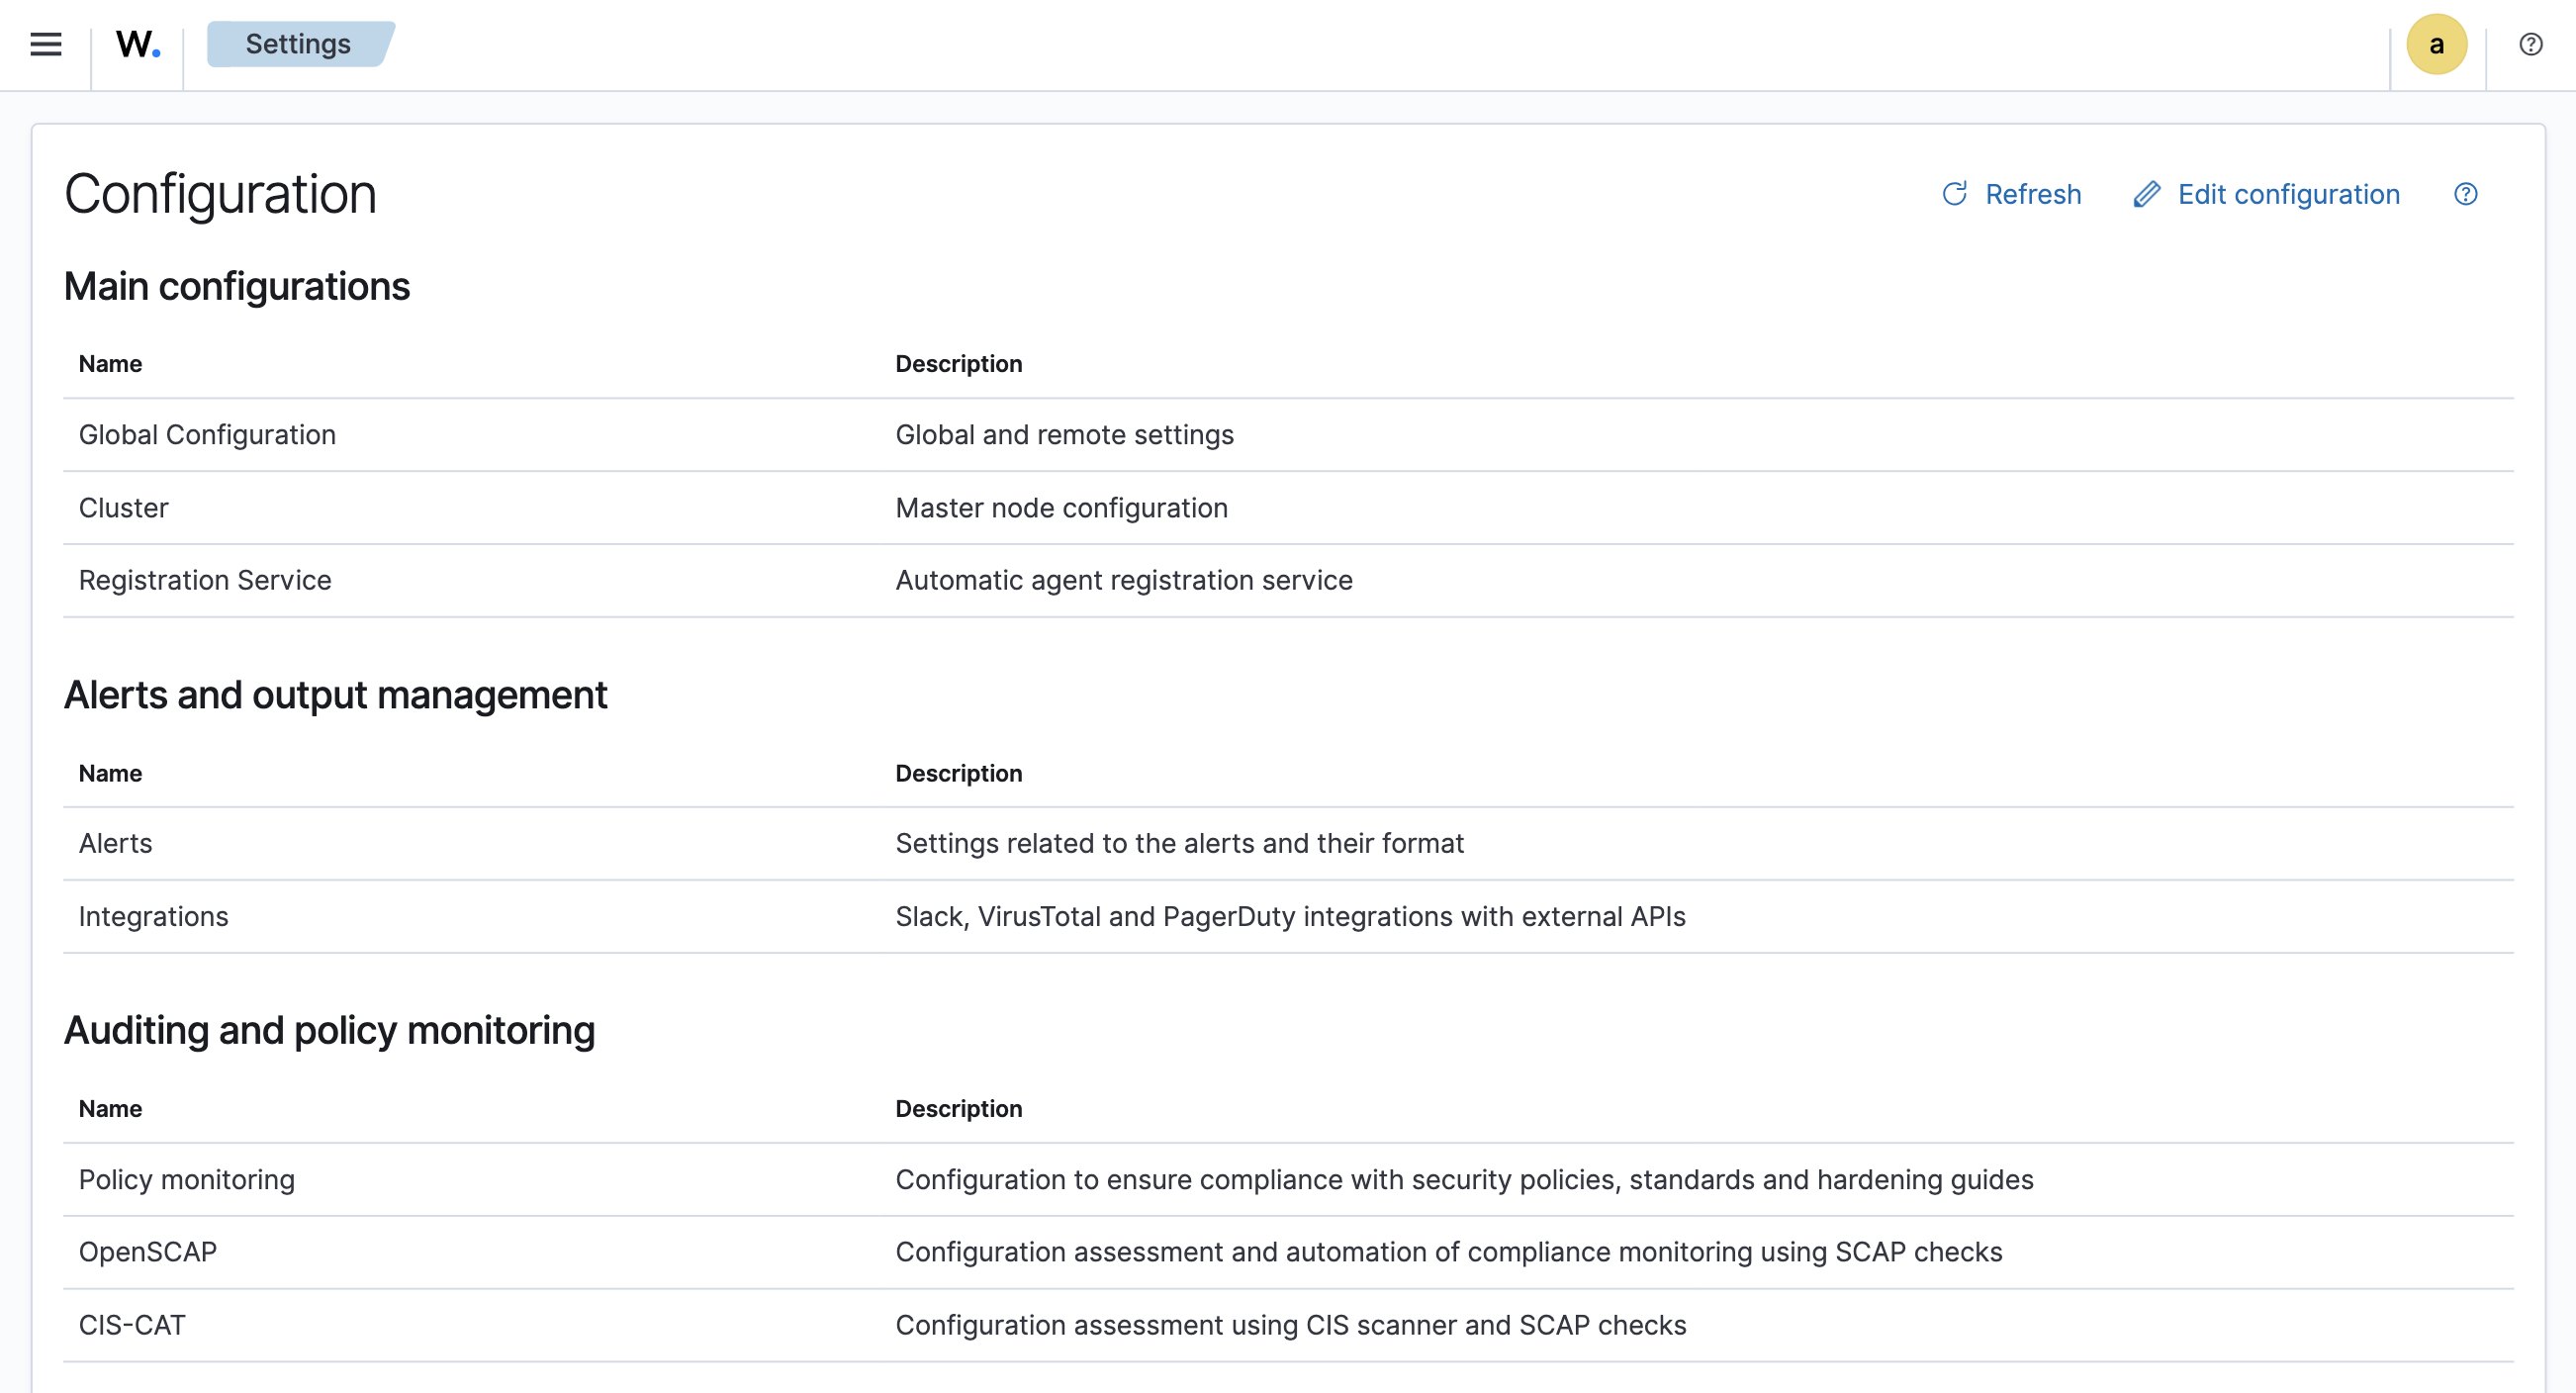
You can query the actual configuration of a Wazuh agent or the Wazuh manager on demand. Navigate to the Server management > Settings in the Wazuh dashboard. From here, you will be able to fetch the active configuration for the Wazuh manager in real-time. The image below shows details about the Wazuh manager configuration.

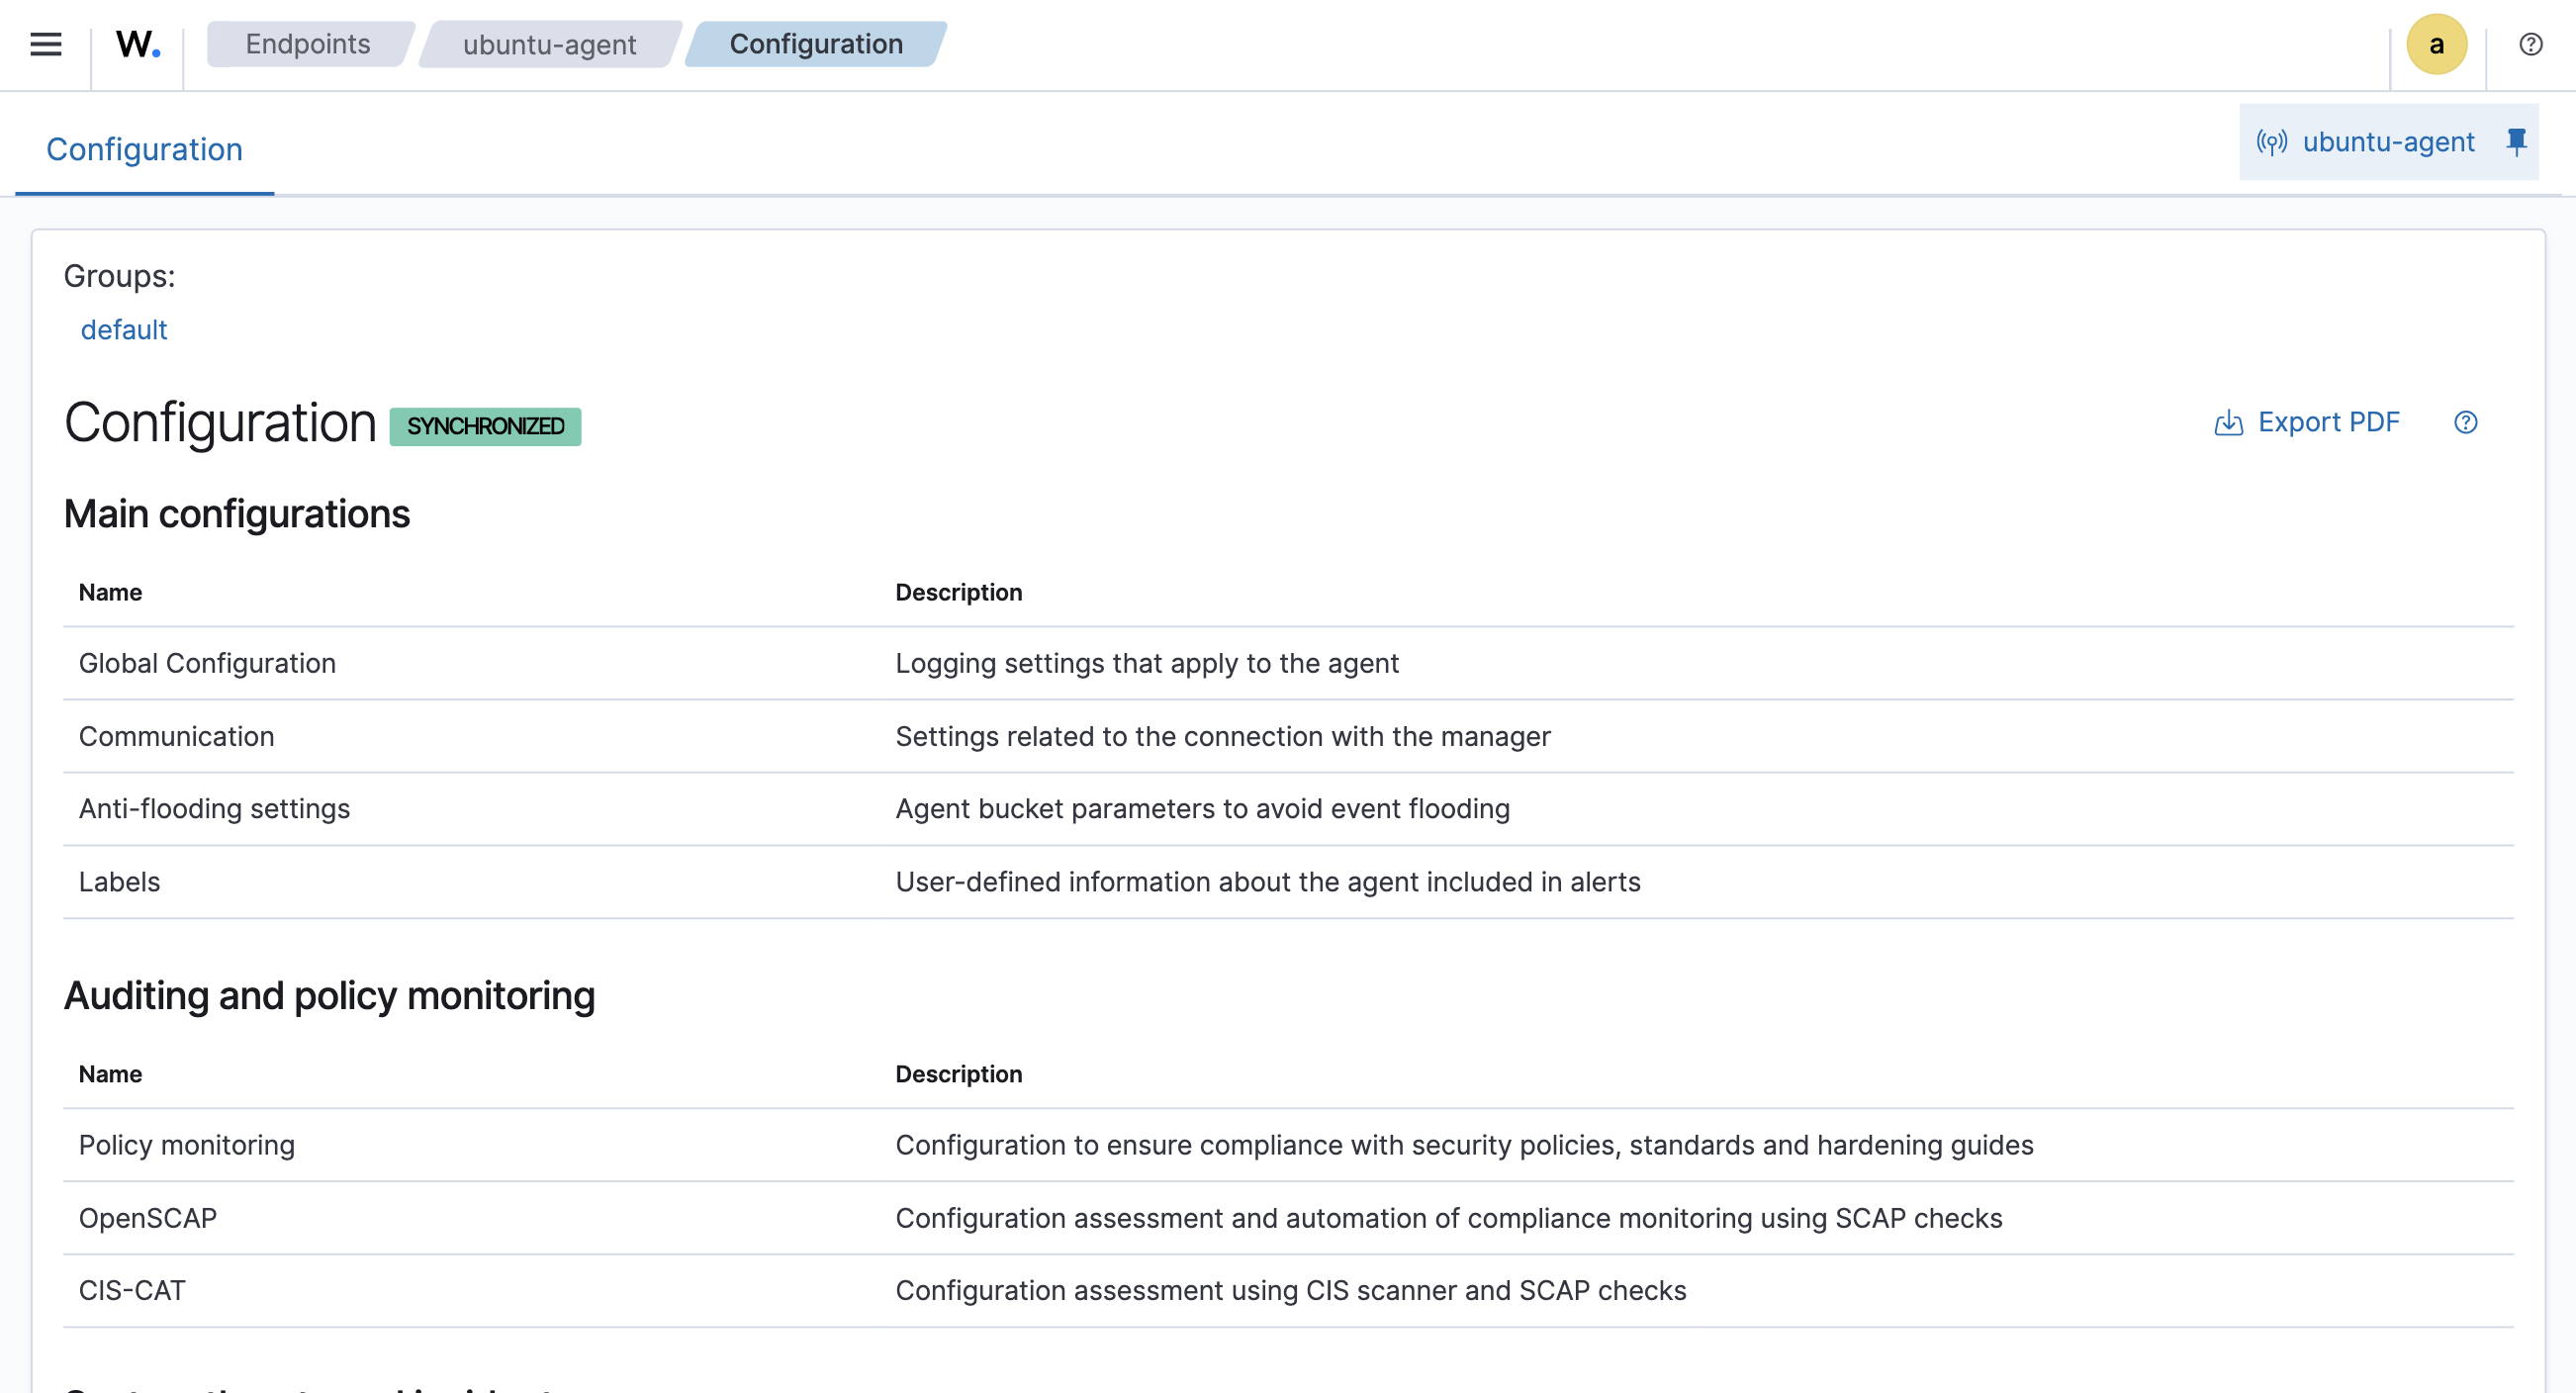
Navigate to the Agents management > Summary tab in the Wazuh dashboard. Select an agent and click on Configuration. The image below shows details about the Wazuh agent configuration. It also shows that the Wazuh agent configuration is synchronized. This means that the Wazuh agent's local configuration reflects the latest settings defined on the Wazuh manager.

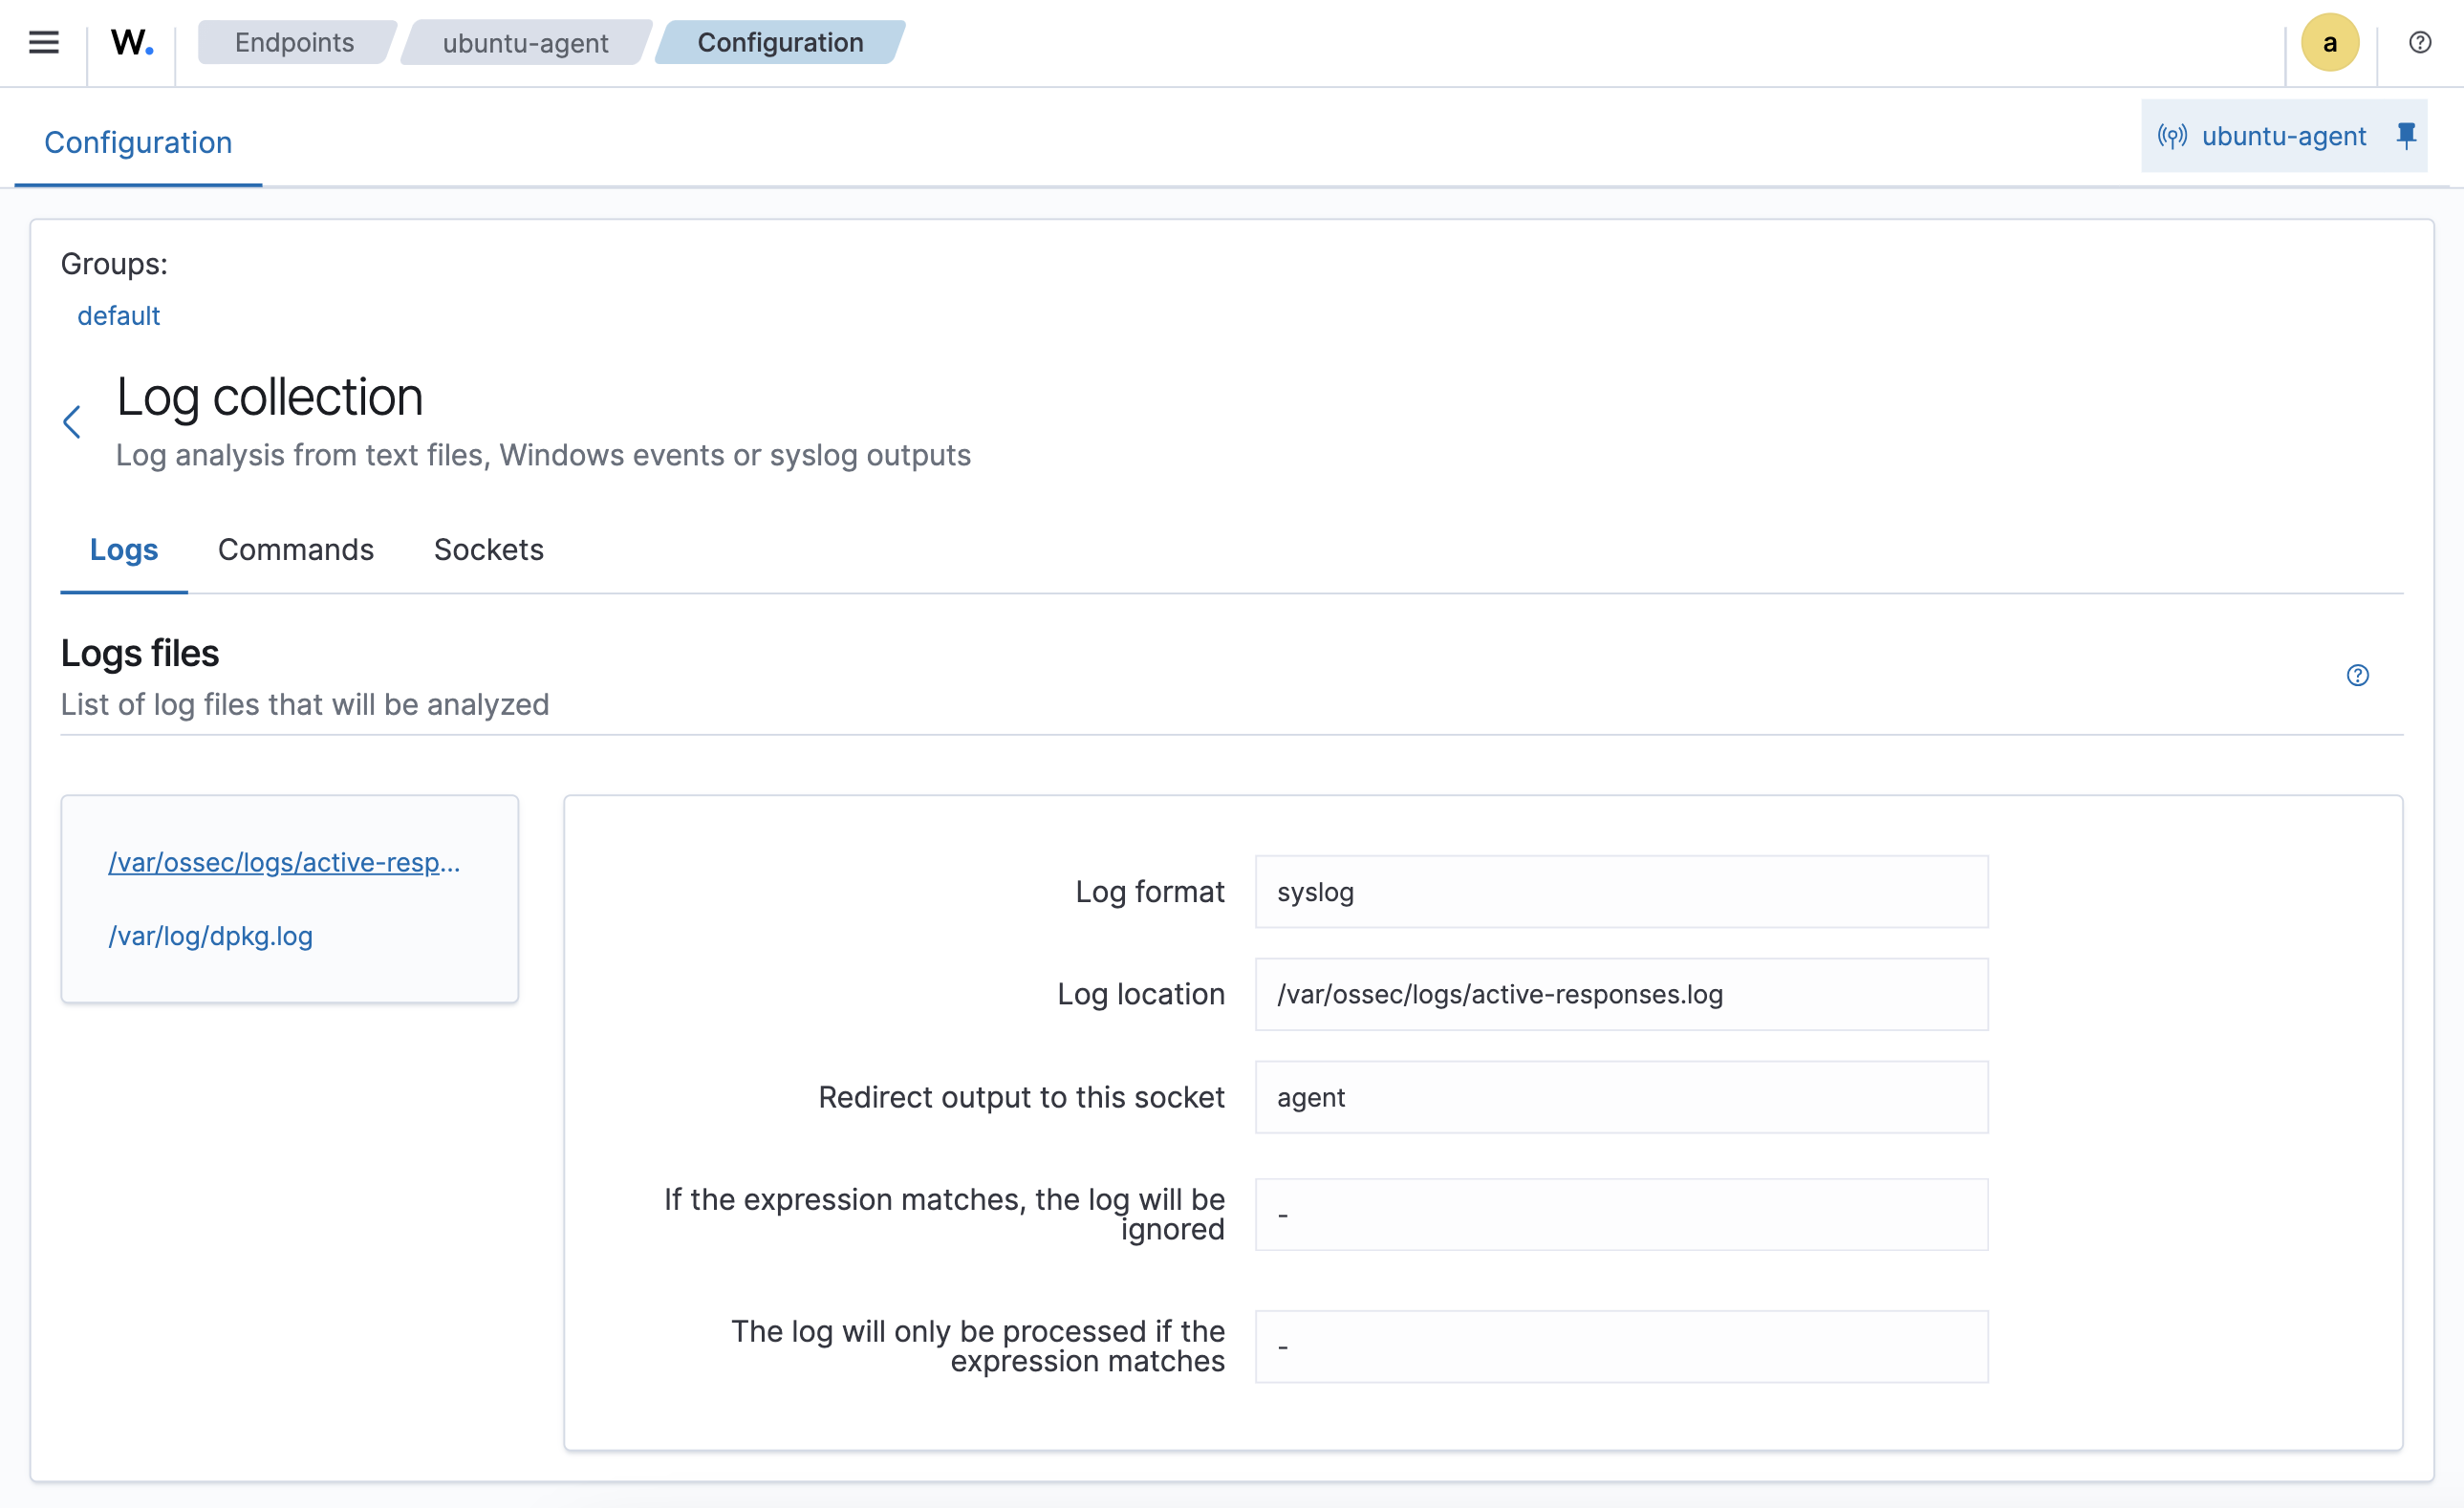
Navigate to the Agents management > Summary tab in the Wazuh dashboard. Select an agent and click on Configuration. Scroll down to the Log data analysis section and click on the Log collection configuration. The active configuration is shown. The image below shows the log files that will be analyzed.
