Queuing mechanisms
The Wazuh server includes a queue mechanism that streamlines the collection of events from monitored endpoints. It ensures continuous data flow from the Wazuh agents, syslog endpoints, and agentless devices to the Wazuh server, thereby preventing event flooding.
The Wazuh server queue utilizes the First In, First Out (FIFO) methodology; therefore, the first queued event is the first to be removed from the queue and processed. It is based on distributed processing, allowing for the parallelization of log analysis tasks. This improves the scalability and performance of the log processing pipeline, enabling Wazuh to handle large volumes of log data effectively.
The Wazuh server has two native queues for managing event flows:
The Wazuh agent uses the Wazuh agent queue (queue_ad) to prevent event congestion. This queue ensures the Wazuh agent does not send events faster than the Wazuh server can process.
Wazuh agent communication queue (queue_rd)
The queue_rd queue resides in the server-side agent communication service. It receives events from Wazuh agents and sends them to the Wazuh analysis engine for event decoding and rule matching.
How to configure the Wazuh agent communication queue
This section explains how to configure the queue_rd to control the capacity and processing of incoming agent events on the Wazuh server:
Configure the Wazuh agent communication queue by editing the
<queue_size>in the<remote>block of the/var/ossec/etc/ossec.conffile on the Wazuh server:<remote> <connection>secure</connection> <port>1514</port> <protocol>tcp,udp</protocol> <queue_size>131072</queue_size> <rids_closing_time>5m</rids_closing_time> <connection_overtake_time>600</connection_overtake_time> <agents> <allow_higher_versions>no</allow_higher_versions> </agents> </remote>
The
<queue_size>variable sets the queue capacity of the Wazuh agent communication queue. The table below shows the configuration for the<queue_size>variable:Default value
Allowed values
131072
Any number between 1 and 262144.
Note
The Wazuh agent communication queue (
queue_rd) is only available for Wazuh agent events, not remote syslog events. This option only works when the connection is set tosecure.Restart the Wazuh manager service to apply the changes:
# systemctl restart wazuh-manager
If event drops occur, increase the queue_size value in the <remote> block of the /var/ossec/etc/ossec.conf file, and adjust the worker_pool size in the /var/ossec/etc/internal_options.conf file.
The table below shows the configuration of the worker_pool size on the Wazuh server:
remoted.worker_pool |
Description |
Number of threads that process the payload reception |
Default value |
4 |
|
Allowed value |
Any integer between 1 and 16 |
You can monitor for event drops in the wazuh-remoted by querying the Wazuh server API or reading the daemon statistical state file.
Querying the Wazuh server API
You can query the statistical information of the wazuh-remoted by following the steps below:
On the Wazuh dashboard, navigate to Server management > Dev Tools.
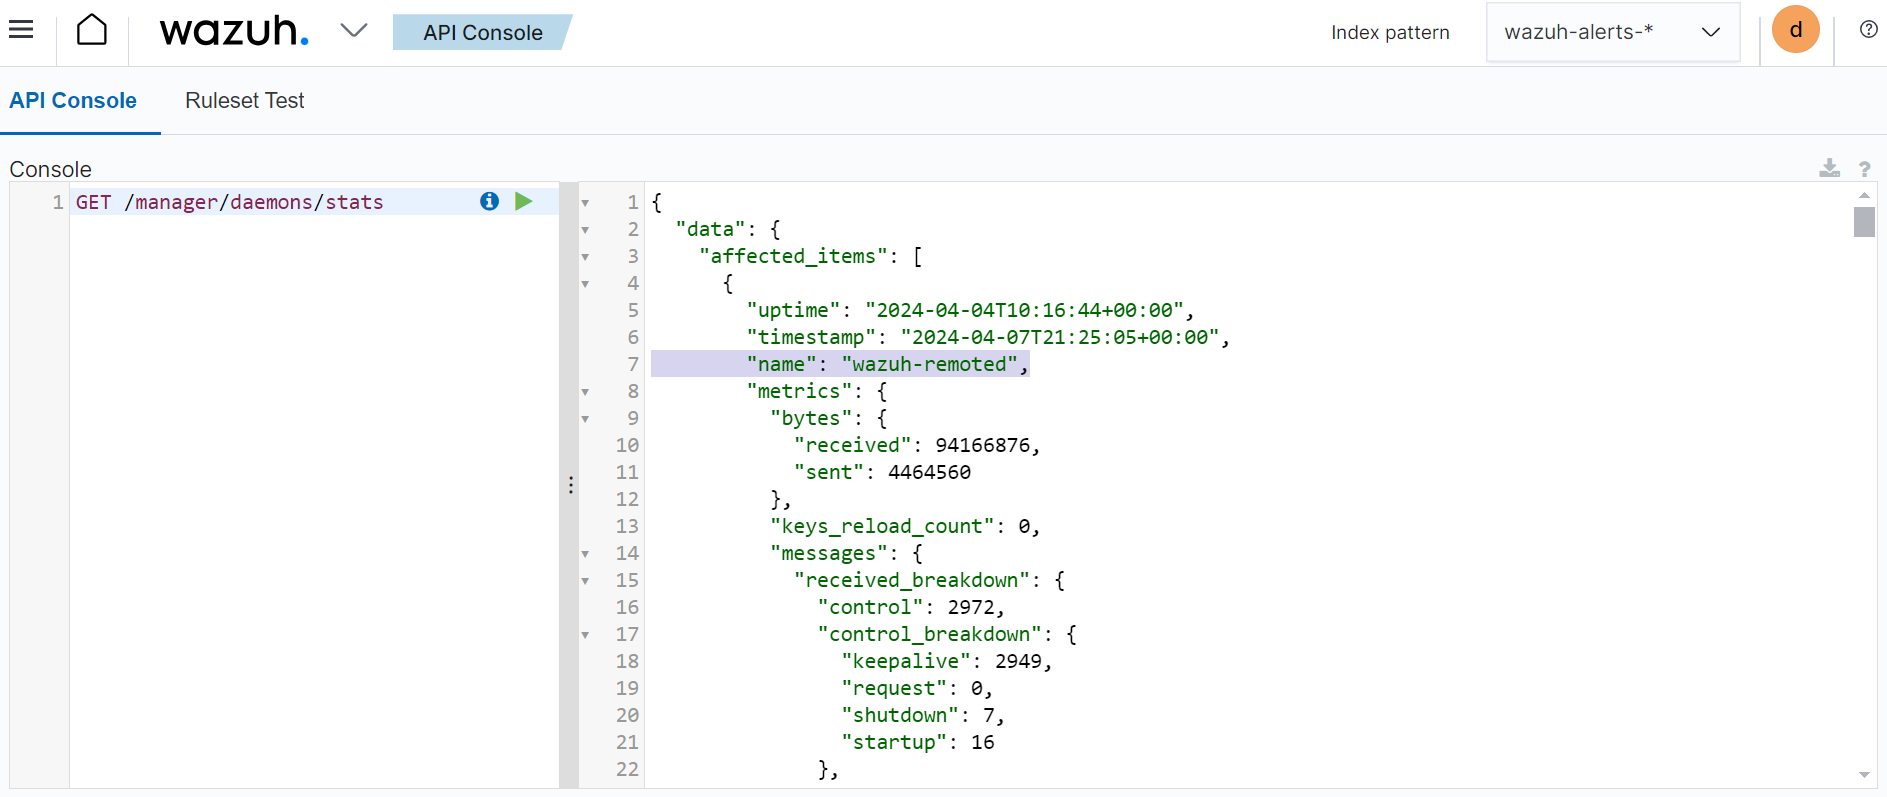
Add the following to the console and click the green arrow to send the request to query the Wazuh server API:
GET /manager/daemons/stats
The query result is shown on the left hand side in the screenshot below.

The query returns the queue size value, the number of events processed by the wazuh-remoted, and the number of events discarded.
Agent communication statistical state file
This statistical file for wazuh-remoted offers data regarding the remote daemon, such as queue size, discarded messages, the count of remote connections, and other important information.
Run the command below on the Wazuh server to read the file:
# cat /var/ossec/var/run/wazuh-remoted.state
Below is an example of the content of the wazuh-remoted.state file:
# State file for wazuh-remoted
# THIS FILE WILL BE DEPRECATED IN FUTURE VERSIONS
# Updated every 5 seconds.

# Queue size
queue_size='0'

# Total queue size
total_queue_size='131072'

# TCP sessions
tcp_sessions='1'

# Events sent to Analysisd
evt_count='14048'

# Control messages received
ctrl_msg_count='68'

# Discarded messages
discarded_count='0'

# Total number of bytes sent
sent_bytes='763604'

# Total number of bytes received
recv_bytes='7520088'

# Messages dequeued after the agent closes the connection
dequeued_after_close='0'

# Control messages queue usage
ctrl_msg_queue_usage='0'

# Control messages queue breakdown
ctrl_msg_queue_inserted='68'
ctrl_msg_queue_replaced='0'
ctrl_msg_queue_processed='68'
Wazuh analysis engine queue (queue_and)
The queue_and queue resides in the Wazuh analysis engine and streamlines the reception of events. The Wazuh analysis engine then matches the received logs against the rules on the Wazuh server.
How to configure the Wazuh analysis engine queue
The Wazuh analysis engine queue receives logs from Wazuh agents for analysis using the queue_and queue. All incoming log messages are categorized and queued in the following categories:
File integrity monitoring event decoder queue.
Syscollector event decoder queue.
Root check event decoder queue.
Host info event decoder queue.
Event decoder queue.
Windows event decoder queue.
Each queue category has a set of threads responsible for its First In, First Out (FIFO) event management. The number of threads is individually configurable per event type through the /var/ossec/etc/internal_options.conf file on the Wazuh server.
Note
To ensure that upgrades do not overwrite queue configurations, use the /var/ossec/etc/local_internal_options.conf file instead of the /var/ossec/etc/internal_options.conf file.
The table below shows the configuration options available for the Wazuh analysis engine queue (queue_and):
Queues (wazuh-analysisd.state) |
Setting (local_internal_options.conf) |
Default |
Min |
Max |
|---|---|---|---|---|
syscheck_queue_usage |
analysisd.decode_syscheck_queue_size |
16384 |
128 |
2000000 |
syscollector_queue_usage |
analysisd.decode_syscollector_queue_size |
16384 |
128 |
2000000 |
rootcheck_queue_usage |
analysisd.decode_rootcheck_queue_size |
16384 |
128 |
2000000 |
sca_queue_usage |
analysisd.decode_sca_queue_size |
16384 |
128 |
2000000 |
hostinfo_queue_usage |
analysisd.decode_hostinfo_queue_size |
16384 |
128 |
2000000 |
winevt_queue_usage |
analysisd.decode_winevt_queue_size |
16384 |
128 |
2000000 |
dbsync_queue_usage |
analysisd.dbsync_queue_size |
16384 |
128 |
2000000 |
upgrade_queue_usage |
analysisd.upgrade_queue_size |
16384 |
128 |
2000000 |
event_queue_usage |
analysisd.decode_event_queue_size |
16384 |
128 |
2000000 |
rule_matching_queue_usage |
analysisd.decode_output_queue_size |
16384 |
128 |
2000000 |
alerts_queue_usage |
analysisd.alerts_queue_size |
16384 |
128 |
2000000 |
firewall_queue_usage |
analysisd.firewall_queue_size |
16384 |
128 |
2000000 |
statistical_queue_usage |
analysisd.statistical_queue_size |
16384 |
128 |
2000000 |
archives_queue_usage |
analysisd.archives_queue_size |
16384 |
128 |
2000000 |
analysisd.fts_queue_size |
16384 |
128 |
2000000 |
|
analysisd.fts_list_size |
32 |
12 |
512 |
|
analysisd.fts_min_size_for_str |
14 |
6 |
128 |
|
analysisd.decoder_order_size |
256 |
32 |
1024 |
Adjust the queue settings when event drops are observed in the Wazuh analysis engine. You can monitor for event drops in the Wazuh analysis engine by querying the Wazuh server API or reading the daemon statistical state file.
Querying the Wazuh server API
The log category state can be queried using the Wazuh server API to check the statistical information from the Wazuh analysis engine. The new statistics show a breakdown of received or dropped events by event type. This is vital to adjust only the queue sizes that show dropping.
You can query the statistical information of the Wazuh analysis engine by following the steps below:
On the Wazuh dashboard, navigate to Server management > Dev Tools.
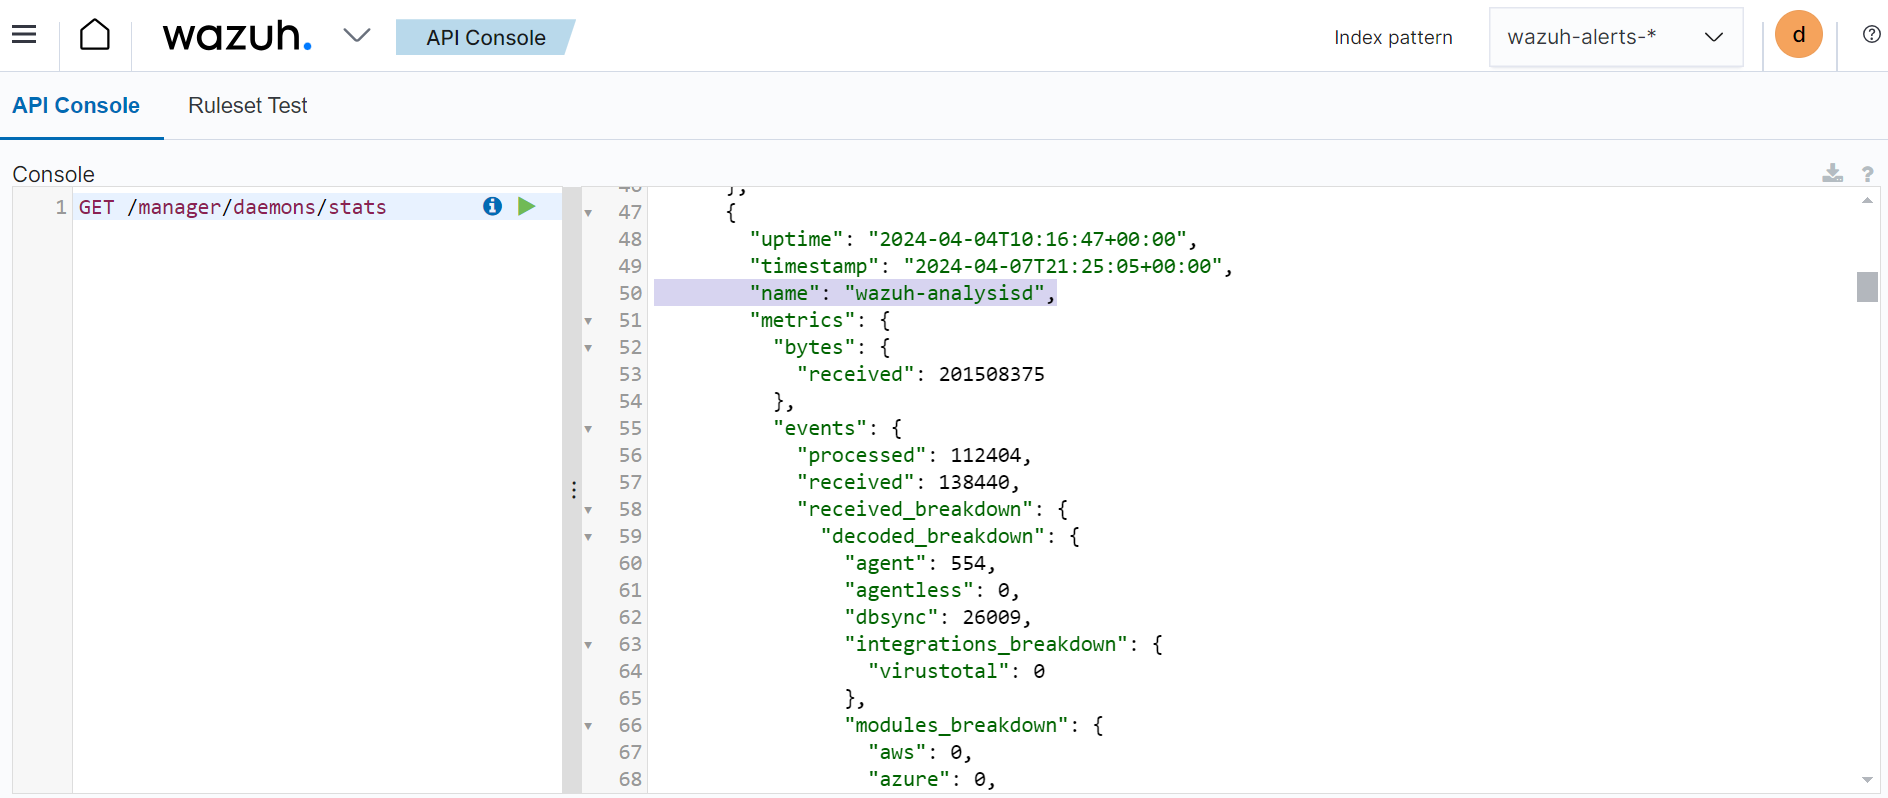
Add the following to the Console and click the green arrow to send the request to query the Wazuh server API:
GET /manager/daemons/stats
Scroll down to the
wazuh-analysisdsection of the query result shown on the right-hand side in the screenshot below.
The query returns the queue size value, the number of events processed by the Wazuh analysis engine, and the number of events discarded.
The Wazuh analysis engine queue can be configured per the event type through the /var/ossec/etc/internal_options.conf file on the Wazuh server.
Note
To ensure that upgrades do not overwrite queue configurations, use the /var/ossec/etc/local_internal_options.conf file instead of the /var/ossec/etc/internal_options.conf file.
The Wazuh analysis engine statistical state file
The statistical file for the Wazuh analysis engine is located at /var/ossec/var/run/wazuh-analysisd.state. The file can be useful when investigating event processing problems on the Wazuh server.
Run the command below on the Wazuh server to read the file:
# cat /var/ossec/var/run/wazuh-analysisd.state
Below is an example of the content of the wazuh-analysisd.state file:
# State file for wazuh-analysisd
# THIS FILE WILL BE DEPRECATED IN FUTURE VERSIONS

# Total events decoded
total_events_decoded='18889'

# Syscheck events decoded
syscheck_events_decoded='2'

# Syscollector events decoded
syscollector_events_decoded='1462'

# Rootcheck events decoded
rootcheck_events_decoded='24'

# Security configuration assessment events decoded
sca_events_decoded='1936'

# Winevt events decoded
winevt_events_decoded='4614'

# Database synchronization messages dispatched
dbsync_messages_dispatched='9824'

# Other events decoded
other_events_decoded='1027'

# Events processed (Rule matching)
events_processed='9064'

# Events received
events_received='18890'

# Events dropped
events_dropped='0'

# Alerts written to disk
alerts_written='218'

# Firewall alerts written to disk
firewall_written='0'

# FTS alerts written to disk
fts_written='0'

# Syscheck queue
syscheck_queue_usage='0.00'

# Syscheck queue size
syscheck_queue_size='16384'

# Syscollector queue
syscollector_queue_usage='0.00'

# Syscollector queue size
syscollector_queue_size='16384'

# Rootcheck queue
rootcheck_queue_usage='0.00'

# Rootcheck queue size
rootcheck_queue_size='16384'

# Security configuration assessment queue
sca_queue_usage='0.00'

# Security configuration assessment queue size
sca_queue_size='16384'

# Hostinfo queue
hostinfo_queue_usage='0.00'

# Hostinfo queue size
hostinfo_queue_size='16384'

# Winevt queue
winevt_queue_usage='0.00'

# Winevt queue size
winevt_queue_size='16384'

# Database synchronization message queue
dbsync_queue_usage='0.00'

# Database synchronization message queue size
dbsync_queue_size='16384'

# Upgrade module message queue
upgrade_queue_usage='0.00'

# Upgrade module message queue size
upgrade_queue_size='16384'

# Event queue
event_queue_usage='0.00'

# Event queue size
event_queue_size='16384'

# Rule matching queue
rule_matching_queue_usage='0.00'

# Rule matching queue size
rule_matching_queue_size='16384'

# Alerts log queue
alerts_queue_usage='0.00'

# Alerts log queue size
alerts_queue_size='16384'

# Firewall log queue
firewall_queue_usage='0.00'

# Firewall log queue size
firewall_queue_size='16384'

# Statistical log queue
statistical_queue_usage='0.00'

# Statistical log queue size
statistical_queue_size='16384'

# Archives log queue
archives_queue_usage='0.00'

# Archives log queue size
archives_queue_size='16384'
Wazuh agent queue (queue_ad)
The queue_ad queue resides in the agent-side agent connection service and manages event forwarding from the Wazuh agent to the Wazuh server. The queue collects logs like system events and security configuration assessment outputs before forwarding them to the Wazuh server. It also includes an anti-flooding mechanism that throttles event forwarding based on configurable parameters, mitigating the risk of overwhelming the processing capacity of the Wazuh server.
Wazuh queue decoder and rules
Wazuh provides an out-of-the-box decoder and rules to analyze the event flooding output and generate alerts on the Wazuh dashboard. These components work together by first decoding queue-related messages and then applying rules to assess impact and trigger alerts when thresholds are exceeded.
Decoder
The decoder is available in the /var/ossec/ruleset/decoders/0005-wazuh_decoders.xml file on the Wazuh server. The decoder is responsible for analyzing flooding events on the Wazuh server.
<decoder name="agent-buffer">
  <parent>wazuh</parent>
  <prematch offset="after_parent">^Agent buffer:</prematch>
  <regex offset="after_prematch">^ '(\S+)'.</regex>
  <order>level</order>
</decoder>
Rules
As shown below, the rules are defined with IDs from 201 to 205 and are available in the /var/ossec/ruleset/rules/0016-wazuh_rules.xml file on the Wazuh server.
<!-- Agent buffer rules -->
<rule id="201" level="0">
  <if_sid>200</if_sid>
  <match>^wazuh: Agent buffer: </match>
  <description>Agent event queue rule</description>
  <group>agent_flooding,</group>
</rule>

<rule id="202" level="7">
  <if_sid>201</if_sid>
  <field name="level">%</field>
  <description>Agent event queue is $(level) full.</description>
  <group>agent_flooding,pci_dss_10.6.1,gdpr_IV_35.7.d,</group>
</rule>

<rule id="203" level="9">
  <if_sid>201</if_sid>
  <field name="level">full</field>
  <description>Agent event queue is full. Events may be lost.</description>
  <group>agent_flooding,pci_dss_10.6.1,gdpr_IV_35.7.d,</group>
</rule>

<rule id="204" level="12">
  <if_sid>201</if_sid>
  <field name="level">flooded</field>
  <description>Agent event queue is flooded. Check the agent configuration.</description>
  <group>agent_flooding,pci_dss_10.6.1,gdpr_IV_35.7.d,</group>
</rule>

<rule id="205" level="3">
  <if_sid>201</if_sid>
  <field name="level">normal</field>
  <description>Agent event queue is back to normal load.</description>
  <group>agent_flooding,</group>
</rule>
Where:
Rule ID
201is the base rule for the event queue.Rule ID
202is triggered when the event queue level reaches 90%.Rule ID
203is triggered when the event queue is full.Rule ID
204is triggered when the event queue is flooded.Rule ID
205is triggered when the event queue becomes normal after a flooding event.