Event logging
Logs are raw events received from the Wazuh agents, external APIs, and network devices. The Wazuh server stores all logs indefinitely. To maximize space optimization, the Wazuh manager automatically compresses log files.
Wazuh manages two types of logs, internal logs from the Wazuh server and external logs from monitored endpoints. These logs are stored indefinitely in the /var/ossec/logs/ directory of the Wazuh server.
The table below describes the log files and their storage location on the Wazuh server.
Log storage file |
Log source |
Description |
|---|---|---|
|
Internal |
Stores all informational level logs generated by the Wazuh server. |
|
Internal |
Stores logs generated by the Wazuh application when interacting with the Wazuh server APIs. |
|
Internal |
Stores logs generated by the activities of the Wazuh cluster. |
|
Internal |
Stores logs generated by the Wazuh integration module when interfacing with third-party applications and systems. |
|
Internal |
Stores logs generated by the Wazuh active response module. |
|
Internal |
Stores logs generated by the firewall. |
|
External |
Stores logs received from third-party applications and systems in plaintext. |
|
External |
Stores logs received from third-party applications and systems in JSON. |
Log compression and rotation
Log files can quickly accumulate and consume significant disk space in a system. To prevent this, the Wazuh manager compresses logs during its rotation process, helping to manage disk usage efficiently and maintain system performance. The Wazuh manager compresses log files daily or when they reach a certain threshold (file size, age, time, and more) and archives them. In the log rotation process, Wazuh creates a new log file with the original name to continuously write new events.
Log files are compressed daily and digitally signed using MD5, SHA1, and SHA256 hashing algorithms. The compressed log files are stored in the /var/ossec/logs/ directory within nested directories bearing names with the following format accordingly:
The
log file name, indicating the name of the original log file.The
year, indicating the name of the current year.The
month, indicating the name of the current month of the year.
For example, a /var/ossec/logs/archives/archives.log file compressed on the 13th APR, 2024 is stored in the …/archives/2024/Apr/ directory. You can see the contents of directory by executing the following command:
# ls -la /var/ossec/logs/archives/2024/Apr/
total 0
drwxr-x--- 2 wazuh wazuh 62 Apr 17 08:15 .
drwxr-x--- 4 wazuh wazuh 28 Apr 12 07:30 ..
-rw-r----- 1 wazuh wazuh  0 Apr 13 00:00 ossec-archive-13.log.gz
-rw-r----- 1 wazuh wazuh  0 Apr 13 00:00 ossec-archive-13.log.sum
As seen in the output above, the string ossec and suffix day of the current month are prepended and appended respectively to the name of the compressed file and its checksum.
Based on your needs, you might configure the compressed files for removal after a specified period. Additionally, you can move them to log management systems, backup servers, or cloud-based storage devices for long-term retention.
Archiving event logs
Events are logs generated by applications, endpoints, and network devices. The Wazuh server stores all events it receives, whether or not they trigger a rule. These events are stored in the Wazuh archives located at /var/ossec/logs/archives/archives.log and /var/ossec/logs/archives/archives.json. Security teams use archived logs to review historical data of security incidents, analyze trends, and generate reports to hunt threats.
By default, the Wazuh archives are disabled because it stores logs indefinitely on the Wazuh server. When enabled, the Wazuh manager creates archived files to store and retain security data for compliance and forensic purposes.
Note
The Wazuh archives retain logs collected from all monitored endpoints, therefore consuming significant storage resources on the Wazuh server over time. It is important to consider the impact on disk space and performance before enabling them.
Enabling archiving
Perform the steps below to enable the archiving on your Wazuh server.
Edit the Wazuh manager configuration file
/var/ossec/etc/ossec.confand set the value of the highlighted fields below toyes:<ossec_config> <global> <jsonout_output>yes</jsonout_output> <alerts_log>yes</alerts_log> <logall>yes</logall> <logall_json>yes</logall_json> ... </ossec_config>
Where:
<logall>enables or disables archiving of all log messages. When enabled, the Wazuh server stores the logs in a syslog format. The allowed values areyesandno.<logall_json>enables or disables logging of events. When enabled, the Wazuh server stores the events in a JSON format. The allowed values areyesandno.
Depending on the format you desire, you can set one or both values of the highlighted fields to
yes. However, only the<logall_json>yes</logall_json>option allows you to create an index that can be used to visualize the events on the Wazuh dashboard.Restart the Wazuh manager to apply the configuration changes:
# systemctl restart wazuh-manager
Depending on your chosen format, the file archives.log, archives.json, or both will be created in the /var/ossec/logs/archives/ directory on the Wazuh server.
Note
Wazuh uses a default log rotation policy. It ensures that available disk space is conserved by rotating and compressing logs on a daily, monthly, and yearly basis.
Visualizing the events on the dashboard
To view archived Wazuh events in the Wazuh dashboard, you must first enable event archiving in Filebeat and then configure the appropriate index pattern in the dashboard. This allows archived events to be indexed and explored visually.
Configuring event archiving
Follow the steps below to view archived Wazuh events in the Wazuh dashboard:
Edit the Filebeat configuration file
/etc/filebeat/filebeat.ymland change the value ofarchives: enabledfromfalsetotrue:archives: enabled: true
Restart Filebeat to apply the configuration changes:
# systemctl restart filebeat
Configuring the Wazuh dashboard
Once event archiving is enabled, configure the dashboard to recognize the archived event indices.
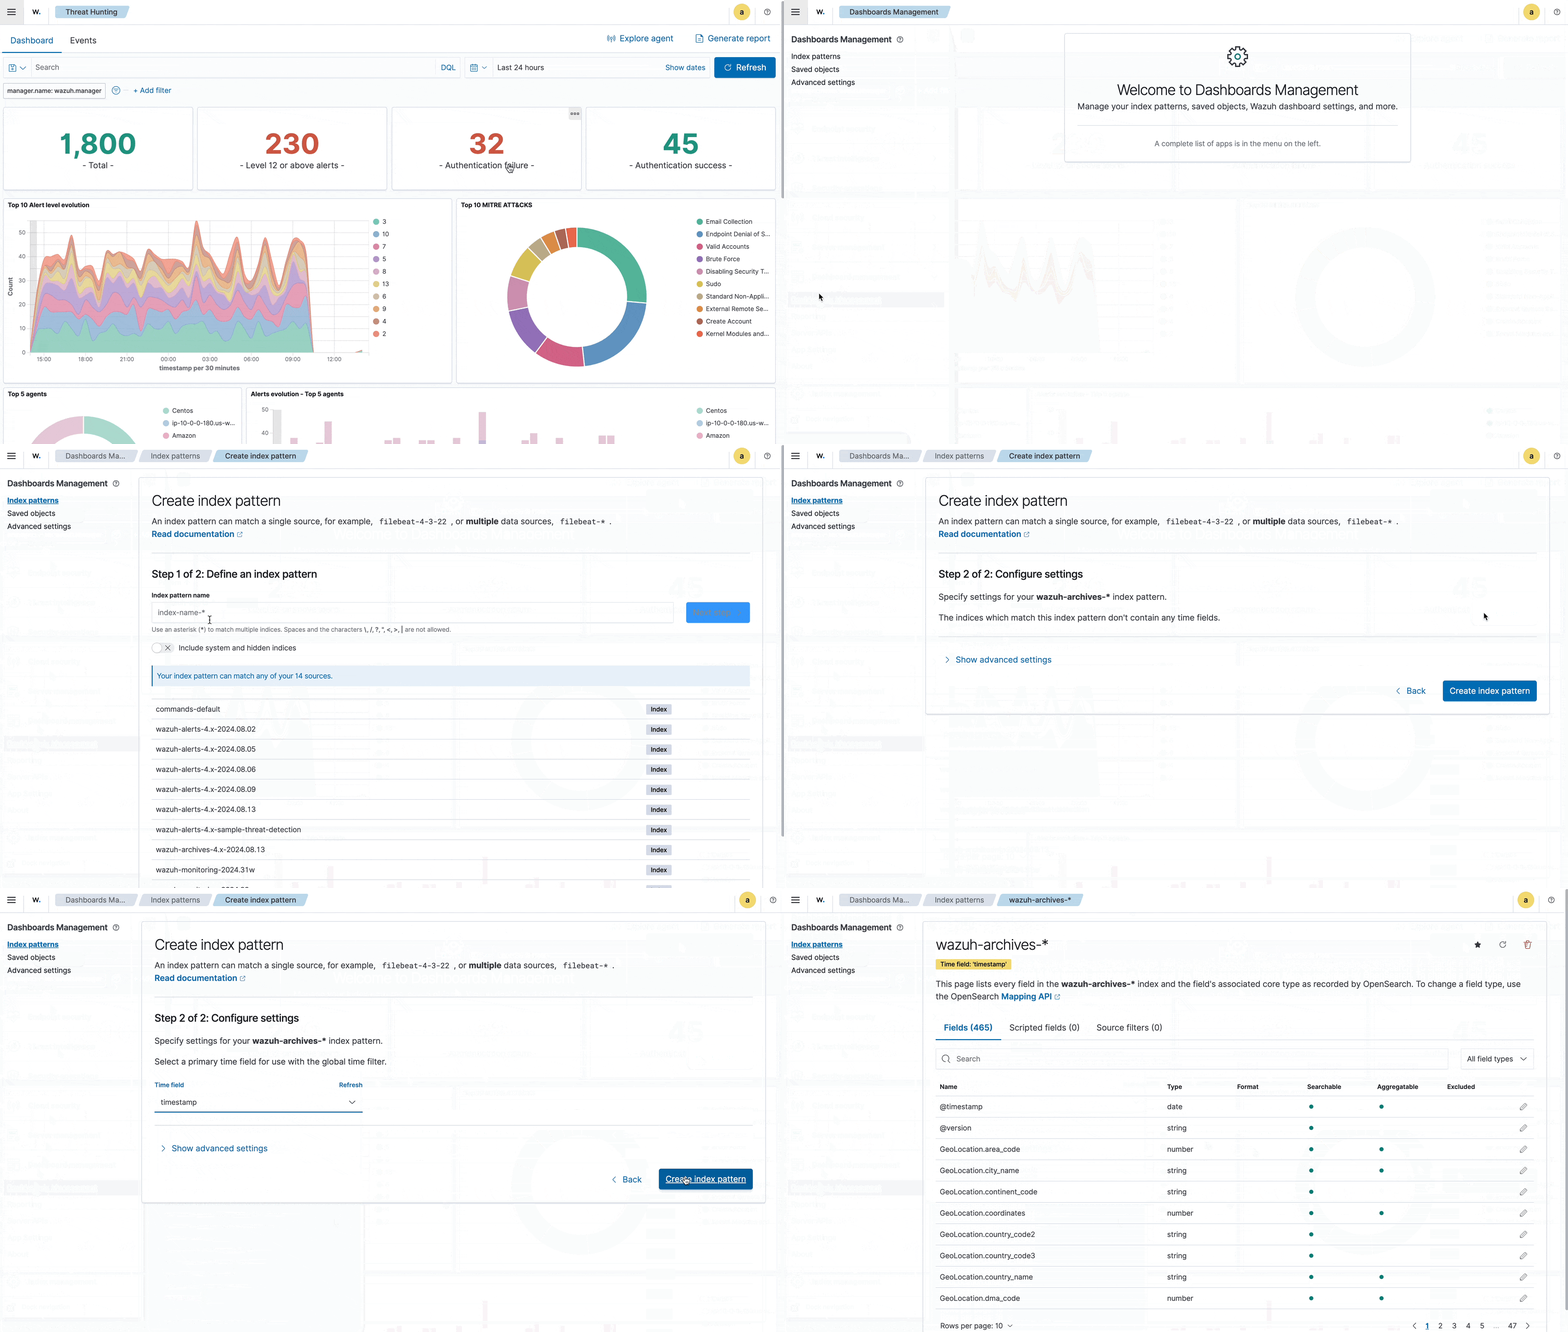
Click the upper-left menu icon and navigate to Dashboard Management > Index patterns > Create index pattern. Use
wazuh-archives-*as the index pattern name, and settimestampin the Time field drop-down list.The GIF below shows how to create the index pattern.
To view the events on the dashboard, click the upper-left menu icon and navigate to Explore > Discover. Change the index pattern to
wazuh-archives-*.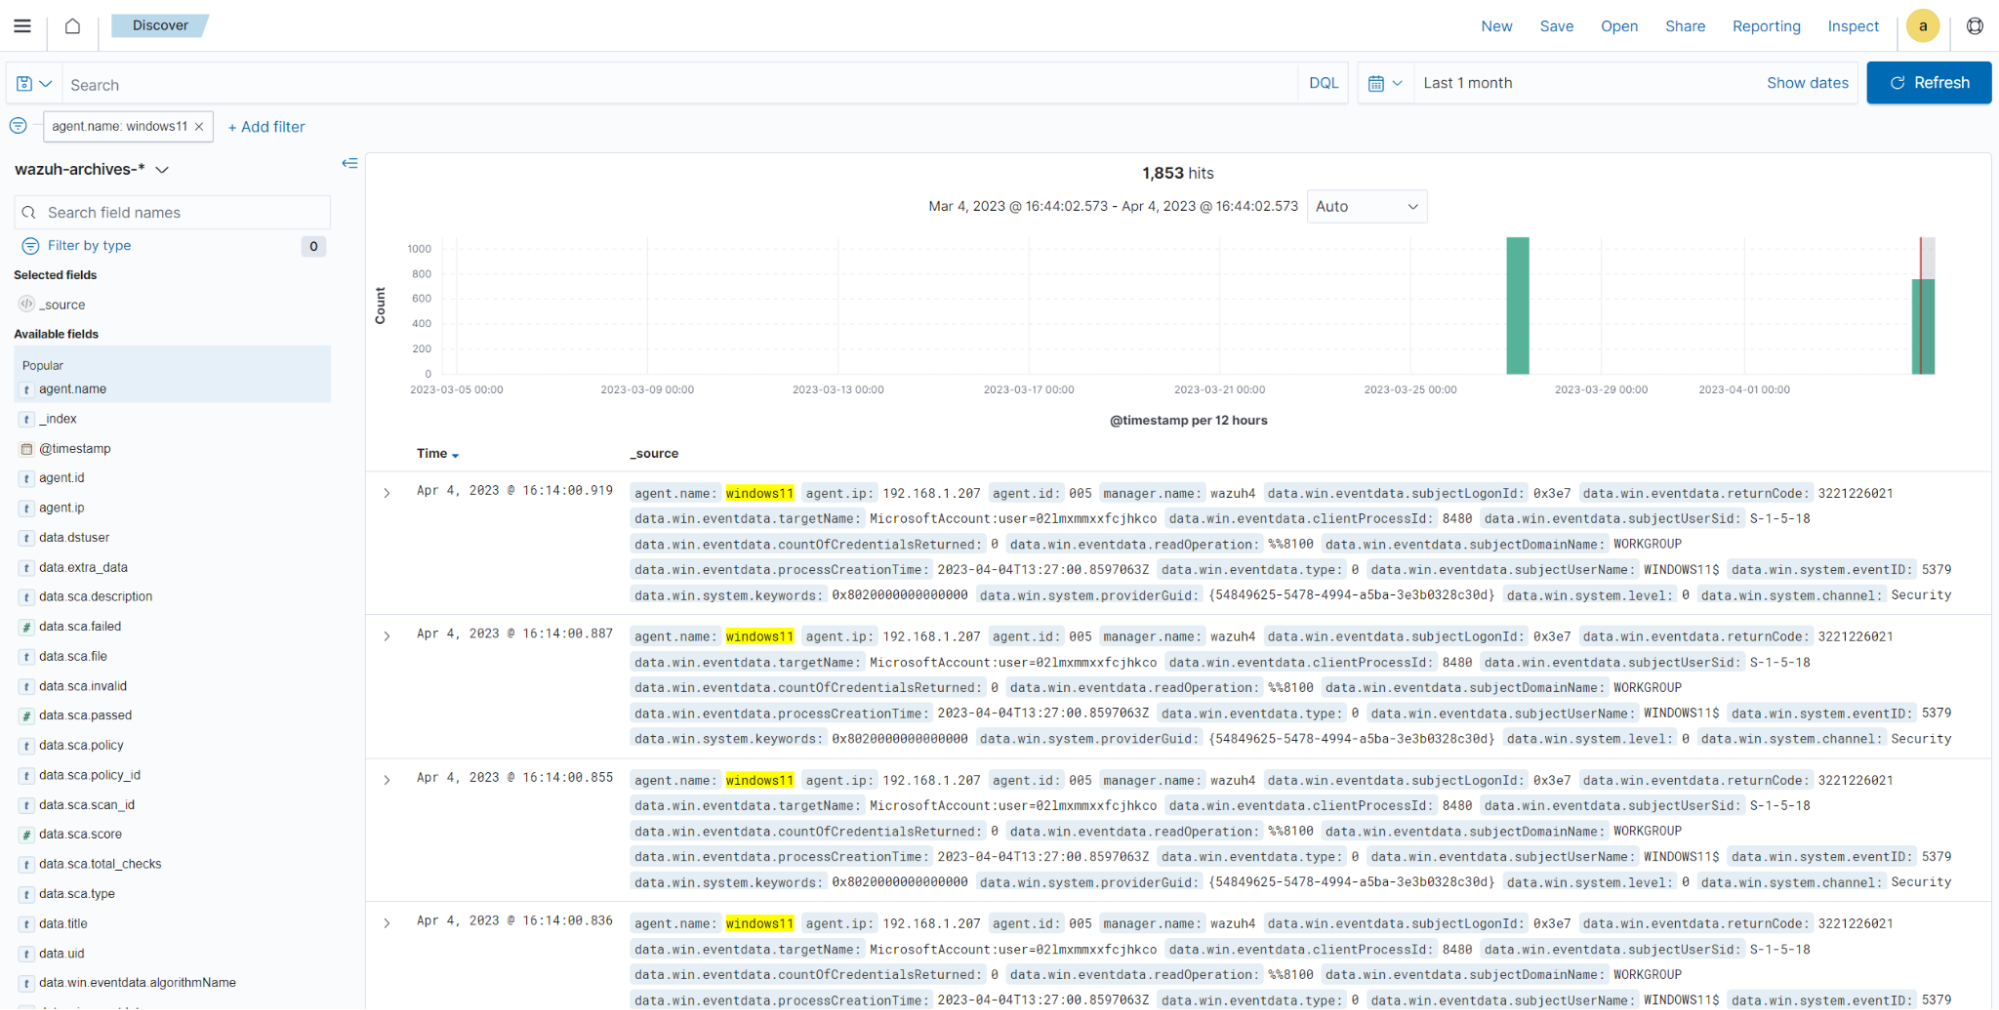
Use case: Detecting signed binary proxy execution
Signed binary proxy execution is a technique threat actors use to bypass application whitelisting by using trusted binaries to run malicious code. This technique is identified as T1218.010 based on the MITRE ATT&CK framework.
In this use case, we show how to abuse the Windows utility, regsvr32.exe, to bypass application controls. We then analyze events in the Wazuh archives to detect suspicious activity related to this technique.
Windows 11 configuration
Perform the steps below to install Sysmon and Atomic Red Team (ART) on a Windows 11 endpoint and emulate the signed binary proxy execution technique.
Sysmon integration
Perform the steps below to install and configure Sysmon on the Windows 11 endpoint.
Download Sysmon from the Microsoft Sysinternals page.
Download the Sysmon configuration file: sysmonconfig.xml.
Install Sysmon with the downloaded configuration file using PowerShell as an administrator:
> .\sysmon64.exe -accepteula -i .\sysmonconfig.xml
Add the following configuration within the
<ossec_config>block to the Wazuh agentC:\Program Files (x86)\ossec-agent\ossec.conffile to specify the location to collect Sysmon logs:<localfile> <location>Microsoft-Windows-Sysmon/Operational</location> <log_format>eventchannel</log_format> </localfile>
Restart the Wazuh agent to apply the changes by running the following PowerShell command as an administrator:
> Restart-Service -Name Wazuh
Atomic Red Team installation
Perform the following steps to install the Atomic Red Team PowerShell module on a Windows 11 endpoint using PowerShell as an administrator:
By default, PowerShell restricts the execution of running scripts. Run the command below to change the default execution policy to
RemoteSignedand follow the instruction:> Set-ExecutionPolicy RemoteSigned
Install the ART execution framework:
> IEX (IWR 'https://raw.githubusercontent.com/redcanaryco/invoke-atomicredteam/master/install-atomicredteam.ps1' -UseBasicParsing);
> Install-AtomicRedTeam -getAtomics
Import the ART module to use
Invoke-AtomicTestfunction:> Import-Module "C:\AtomicRedTeam\invoke-atomicredteam\Invoke-AtomicRedTeam.psd1" -Force
Use
Invoke-AtomicTestfunction to show details of the techniqueT1218.010:> Invoke-AtomicTest T1218.010 -ShowDetailsBrief
PathToAtomicsFolder = C:\AtomicRedTeam\atomics

T1218.010-1 Regsvr32 local COM scriptlet execution
T1218.010-2 Regsvr32 remote COM scriptlet execution
T1218.010-3 Regsvr32 local DLL execution
T1218.010-4 Regsvr32 Registering Non DLL
T1218.010-5 Regsvr32 Silent DLL Install Call DllRegisterServer
Attack emulation
Emulate the signed binary proxy execution technique on the Windows 11 endpoint.
Run the command below with PowerShell as an administrator to perform the
T1218.010test:> Invoke-AtomicTest T1218.010
PathToAtomicsFolder = C:\AtomicRedTeam\atomics

Executing test: T1218.010-1 Regsvr32 local COM scriptlet execution
Done executing test: T1218.010-1 Regsvr32 local COM scriptlet execution
Executing test: T1218.010-2 Regsvr32 remote COM scriptlet execution
Done executing test: T1218.010-2 Regsvr32 remote COM scriptlet execution
Executing test: T1218.010-3 Regsvr32 local DLL execution
Done executing test: T1218.010-3 Regsvr32 local DLL execution
Executing test: T1218.010-4 Regsvr32 Registering Non DLL
Done executing test: T1218.010-4 Regsvr32 Registering Non DLL
Executing test: T1218.010-5 Regsvr32 Silent DLL Install Call DllRegisterServer
Done executing test: T1218.010-5 Regsvr32 Silent DLL Install Call DllRegisterServer
Several calculator instances will pop up after a successful execution of the exploit.
Wazuh dashboard
Use the Wazuh archives to query and display events related to the technique being investigated. To access these events, click the upper-left menu icon and navigate to Explore > Discover, then select wazuh-archives-* as the index pattern.
While reviewing the archives, some events may already be captured as alerts in the Wazuh dashboard. The archived data also includes events that did not trigger alerts, which you can use to create custom detection rules based on your specific requirements.
Apply a time range filter to view events that occurred within the last five minutes of when the test was performed. Filter to view logs from the specific Windows endpoint using
agent.id,agent.iporagent.name.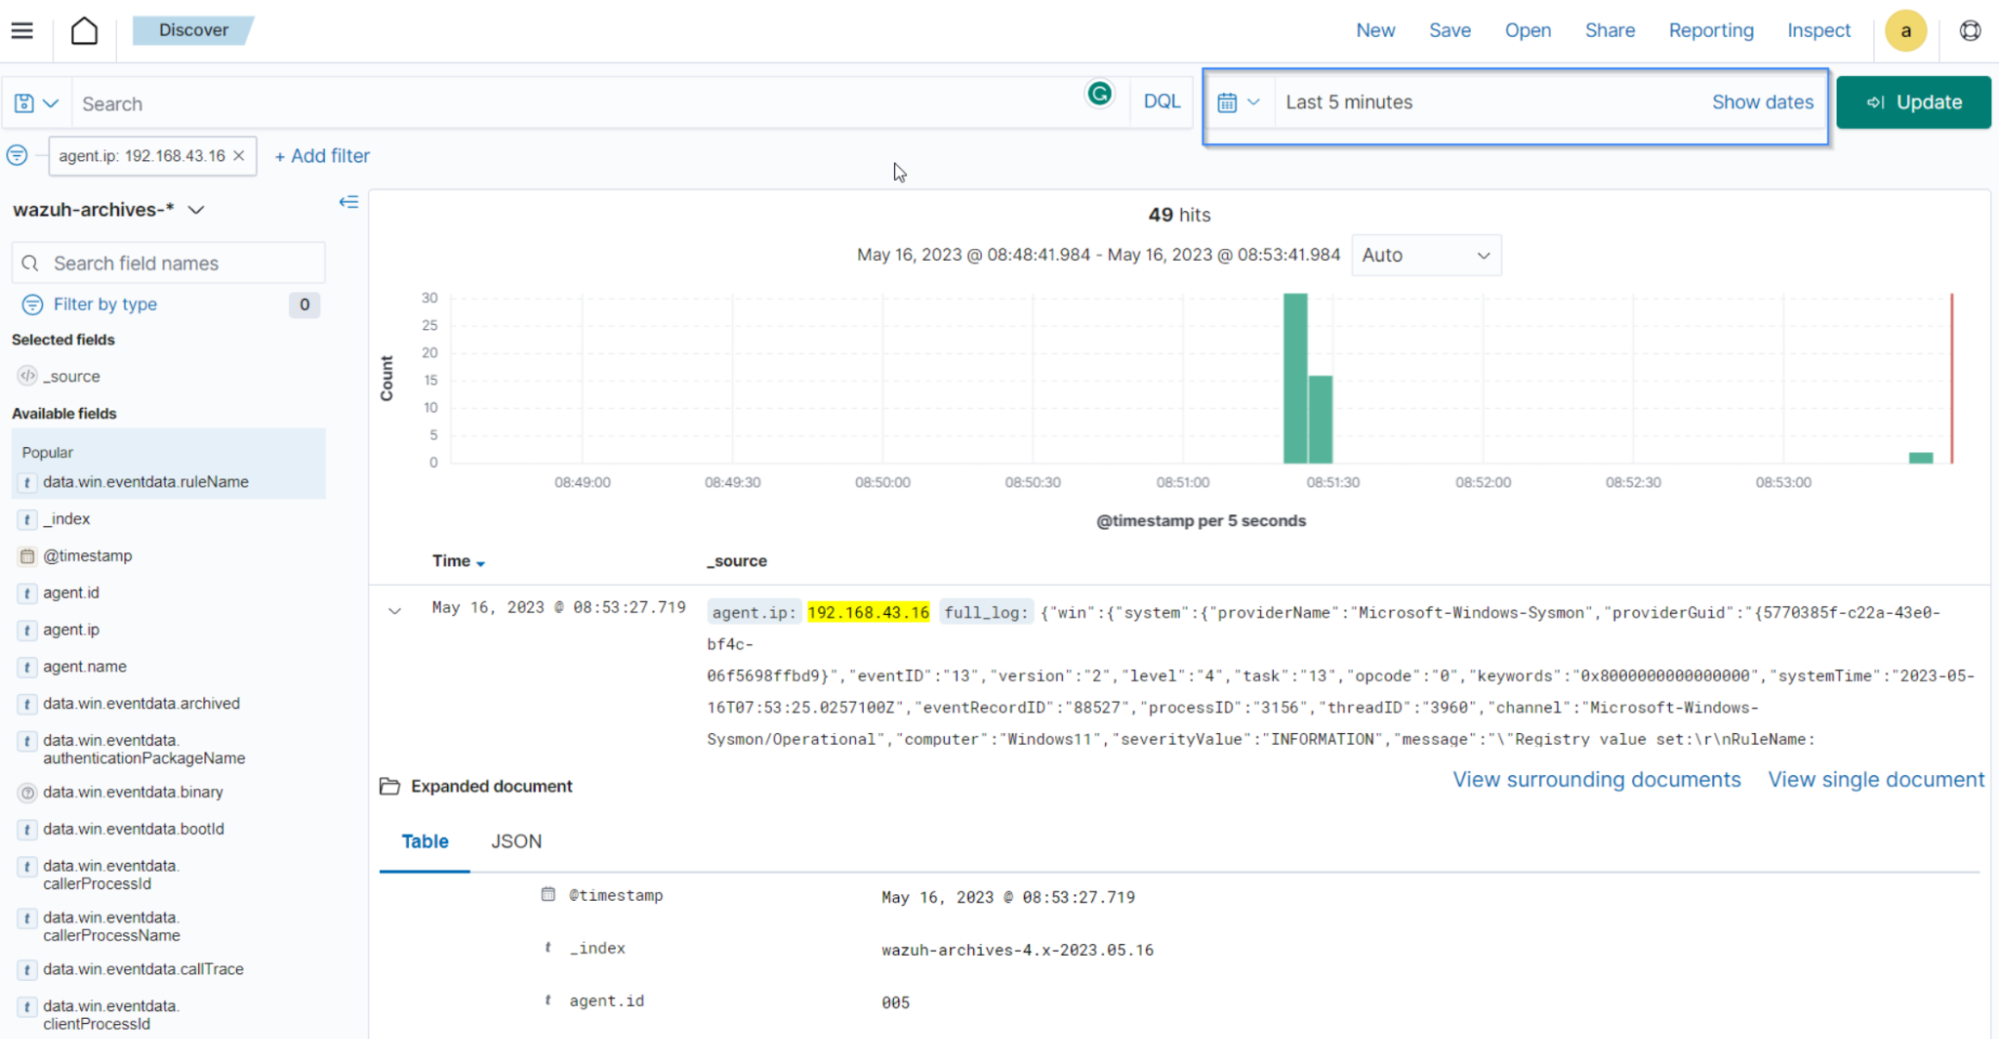
There are multiple hits you can investigate to determine a correlation with the earlier attack emulation. For instance, you may notice a calculator spawning event similar to the one observed on the Windows endpoint during the test.
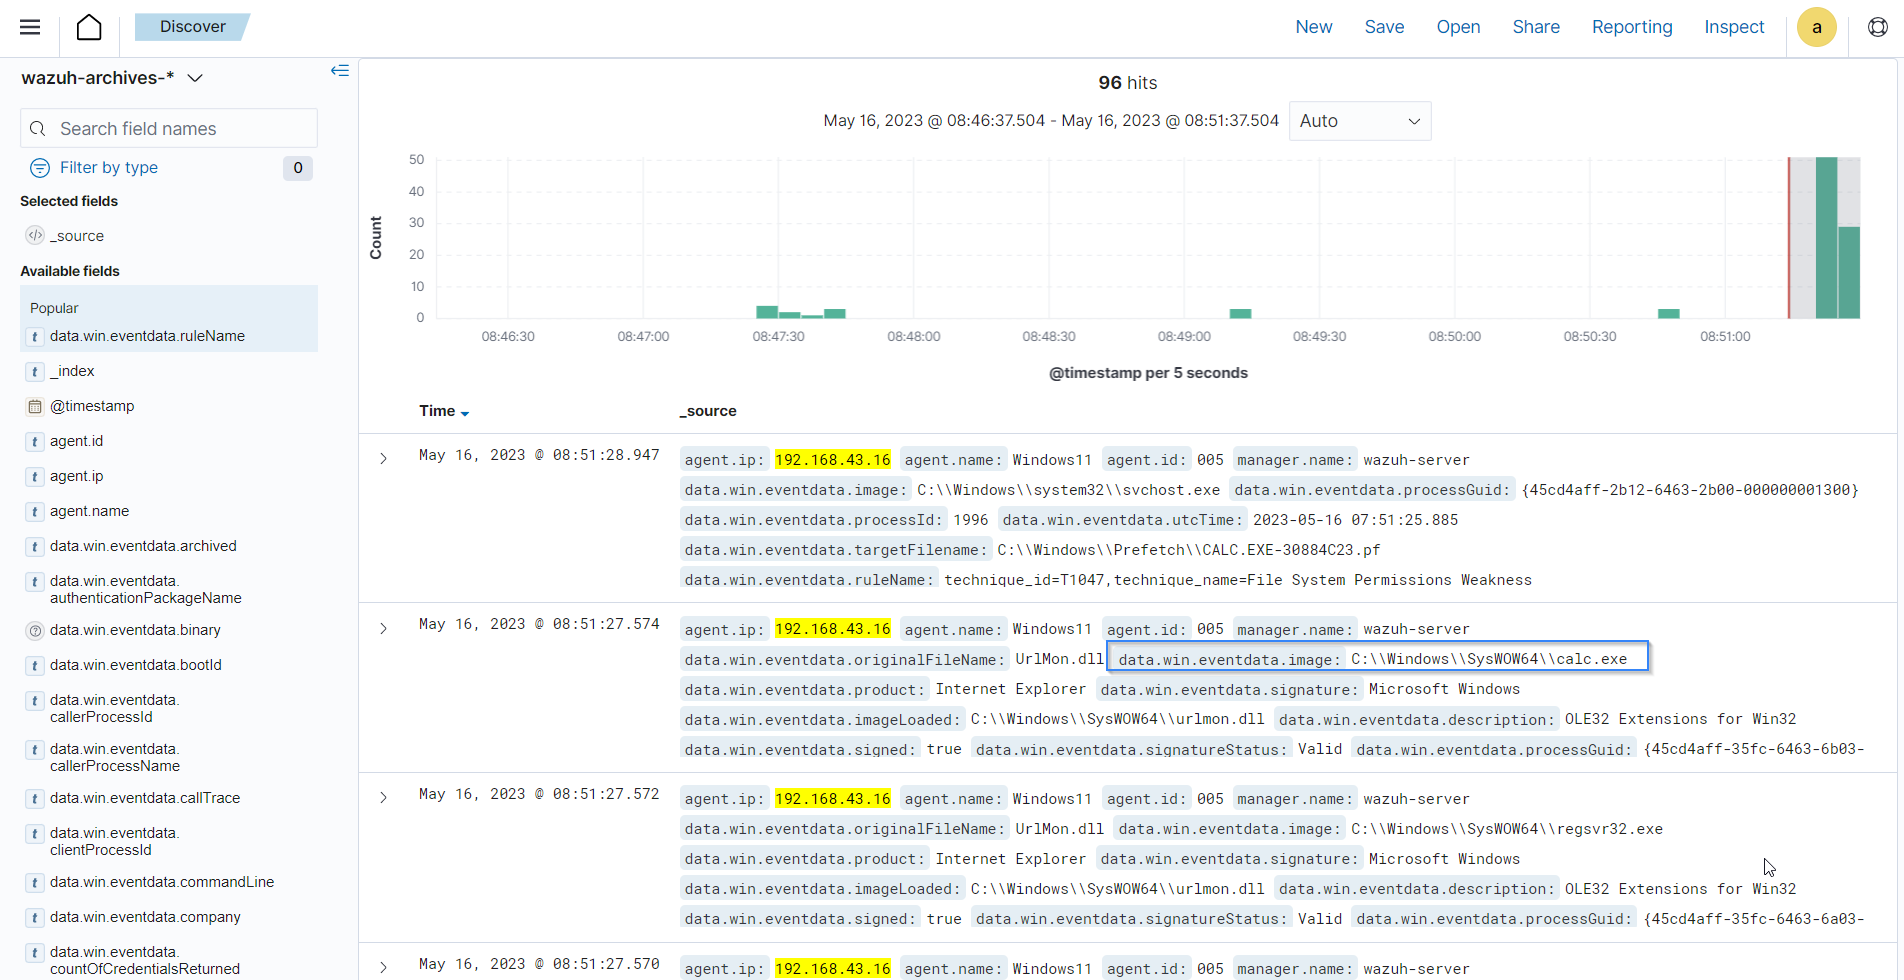
Type
regsvr32in the search bar to streamline and investigate events related to theregsvr32utility.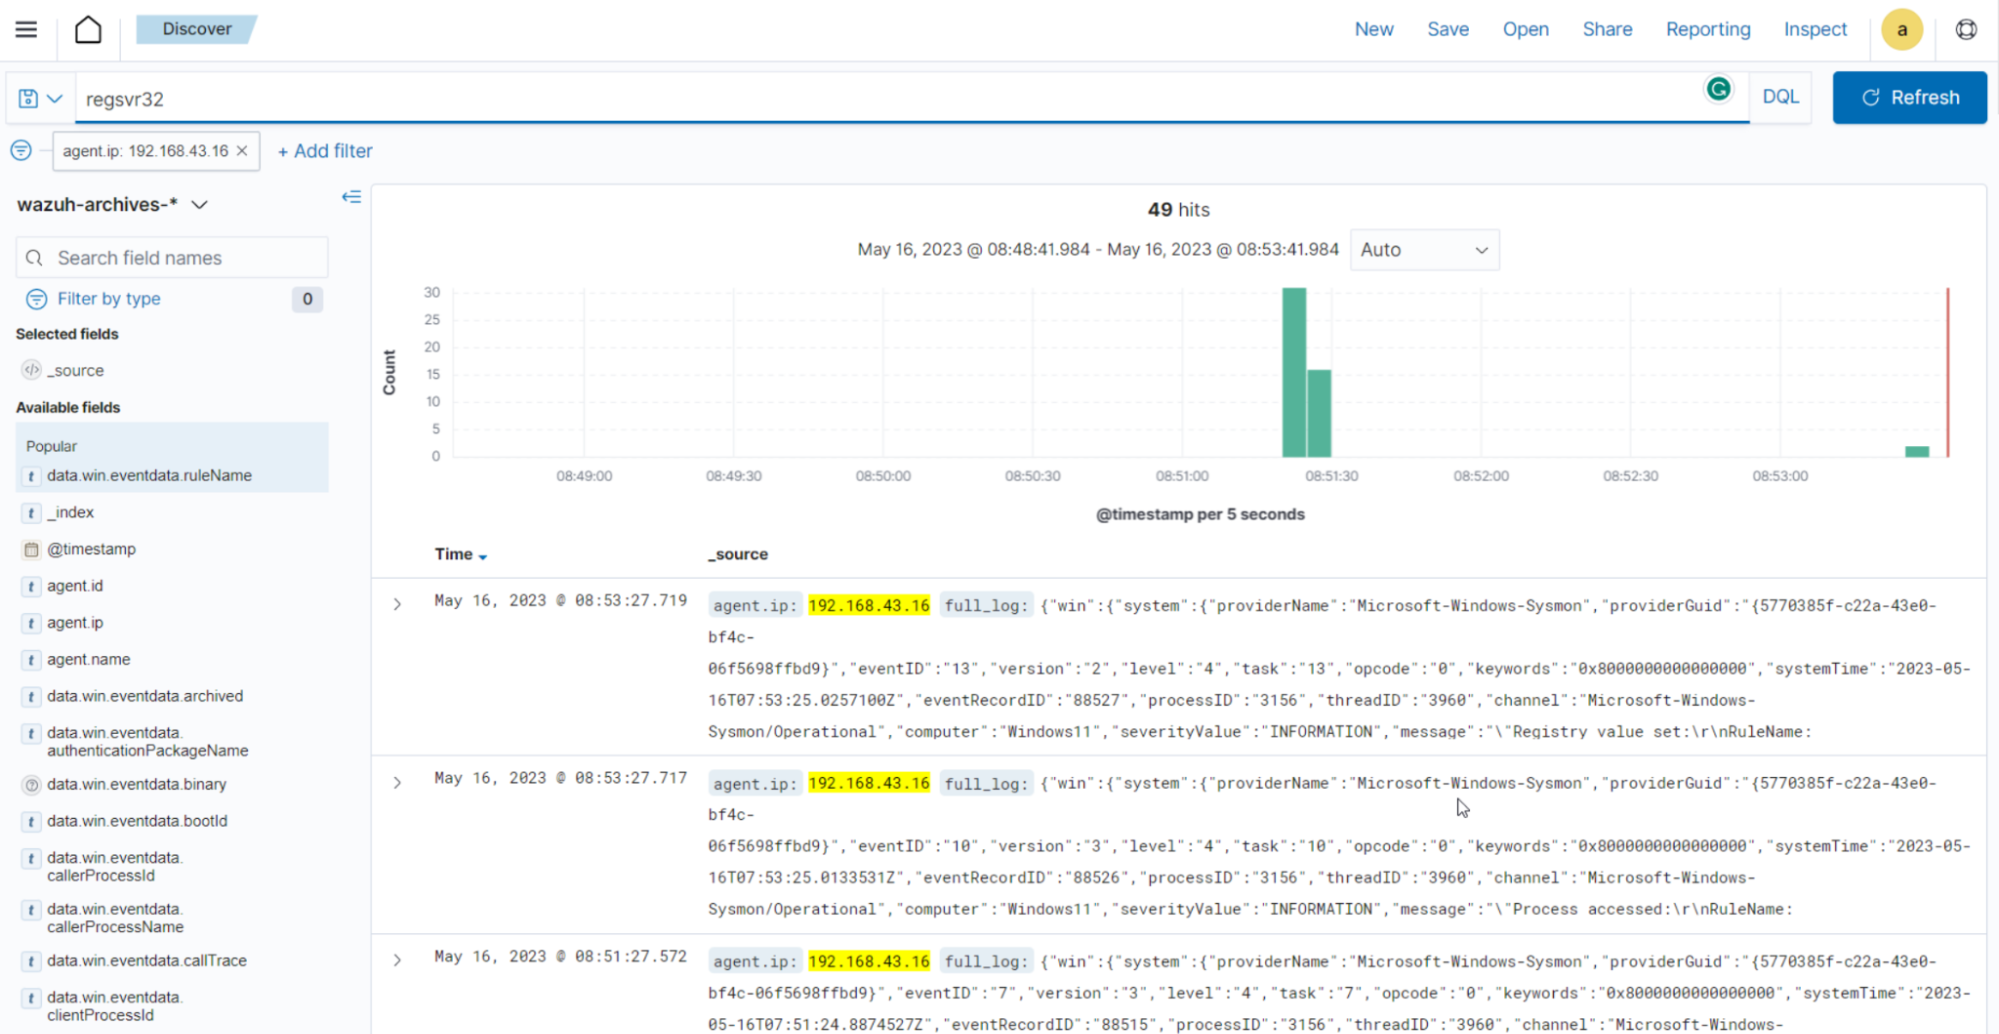
Expand any of the events to view their associated fields.
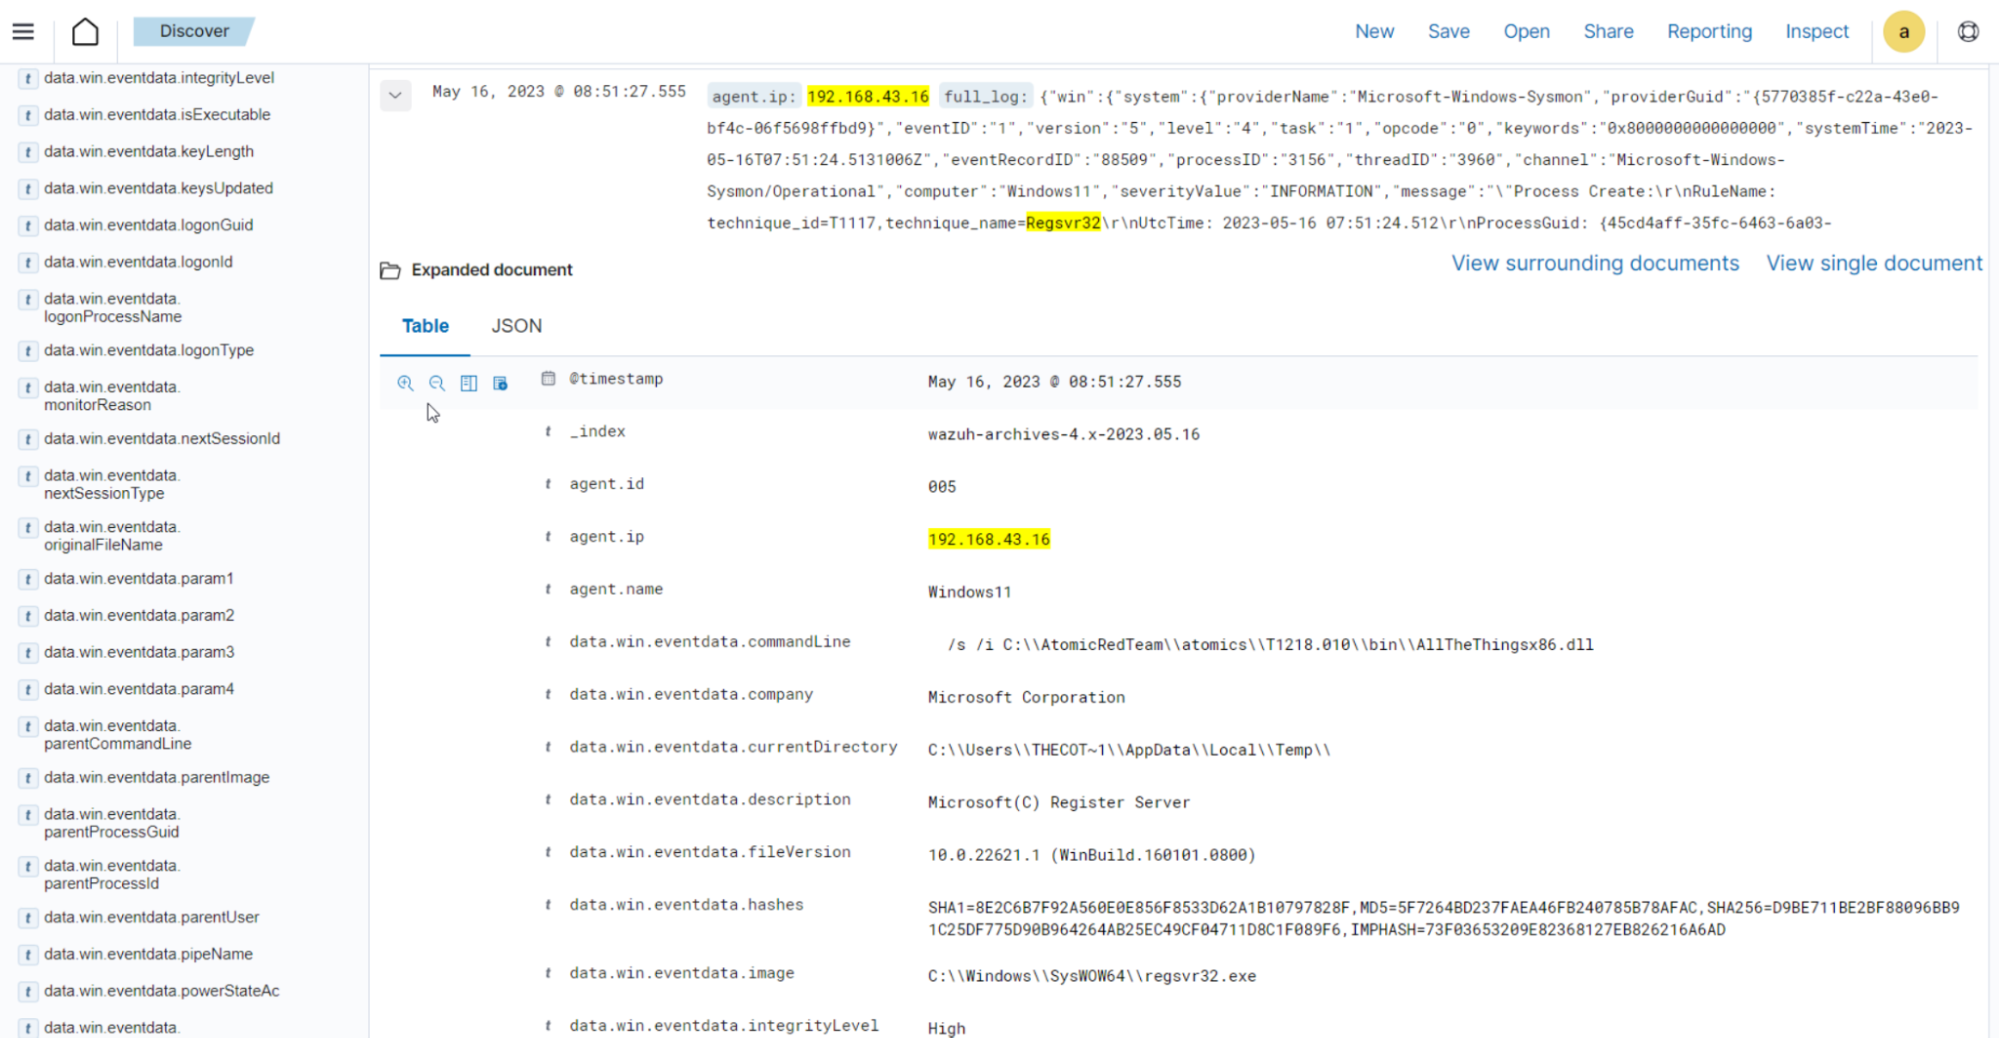
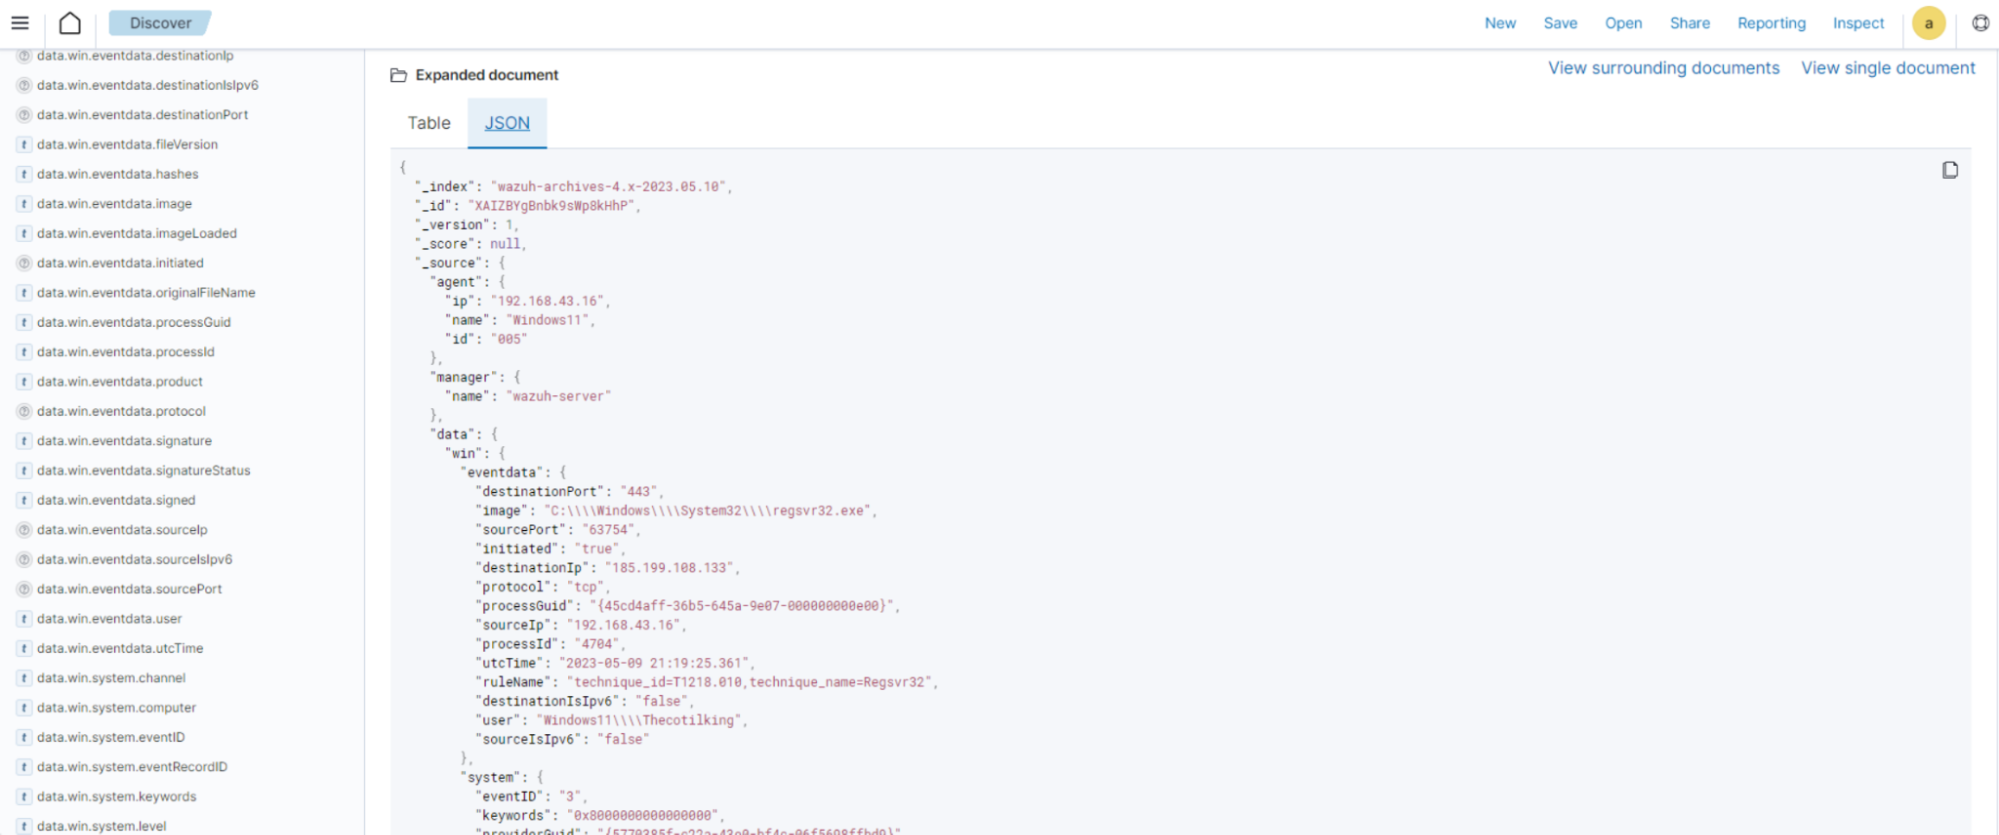
Click on the JSON tab to view the JSON format of the archived logs.
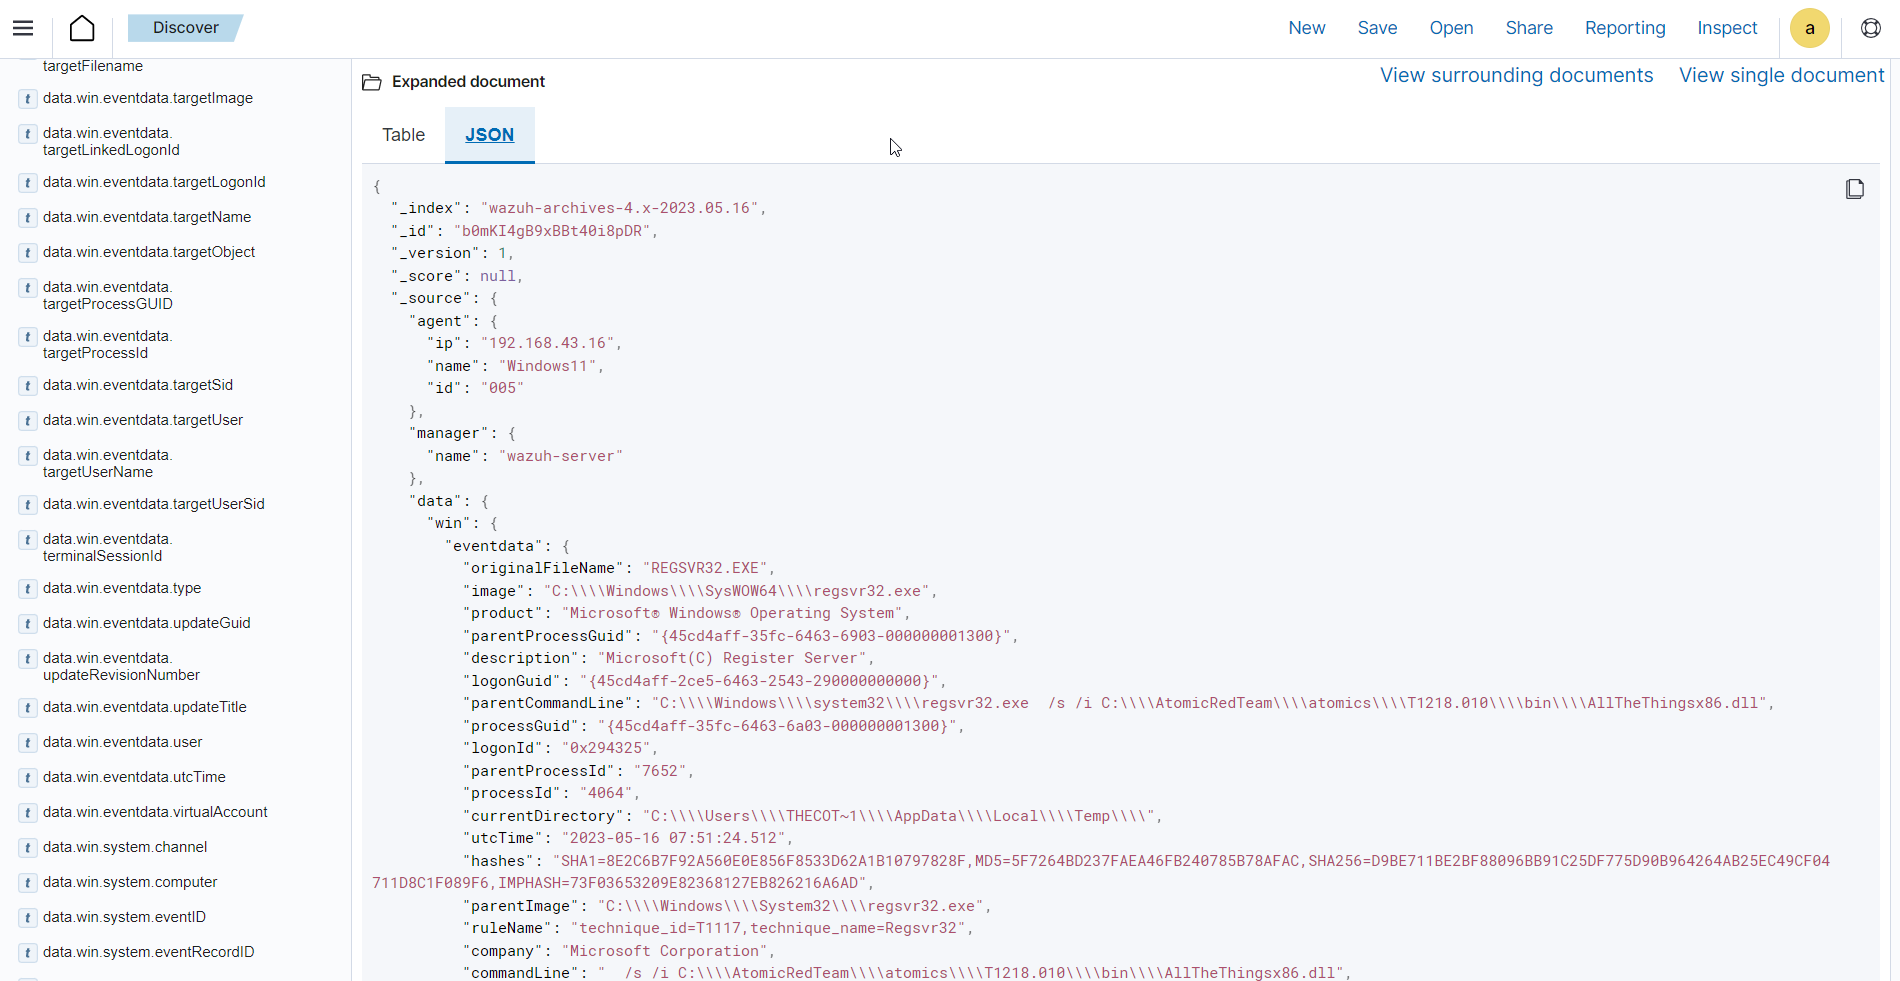
You can extract and verify specific details on the activities, such as commands, services, paths, and more, from the JSON log. Below, you can identify the initial process creation and the attributes related to the executed command:
"data": {
      "win": {
        "eventdata": {
          "originalFileName": "REGSVR32.EXE",
          "image": "C:\\\\Windows\\\\SysWOW64\\\\regsvr32.exe",
          "product": "Microsoft® Windows® Operating System",
          "parentProcessGuid": "{557f07f7-b8ed-6979-8e0b-000000000900}",
          "description": "Microsoft(C) Register Server",
          "logonGuid": "{557f07f7-e3fd-6976-5cb9-240000000000}",
          "parentCommandLine": "C:\\\\Windows\\\\system32\\\\regsvr32.exe  /s /i \\"C:\\\\AtomicRedTeam\\\\atomics\\\\T1218.010\\\\bin\\\\AllTheThingsx86.dll\\"",
          "processGuid": "{557f07f7-b8ed-6979-8f0b-000000000900}",
          "logonId": "0x24b95c",
          "parentProcessId": "2192",
          "processId": "10632",
          "currentDirectory": "C:\\\\Users\\\\windowss\\\\AppData\\\\Local\\\\Temp\\\\",
          "utcTime": "2026-01-28 07:21:17.802",
          "hashes": "SHA1=EF75288011693FDCEBE3FAEC0D4CC1B2E16BC473,MD5=6370B65F2CC3D1EAE5F1742FC626DC18,SHA256=05DBA535304128E3DD1005DEA96F40C695EDD67F176E0BBF490DB5296A58A26C,IMPHASH=1F9497A69740A14D93841F62B8A4C646",
          "parentImage": "C:\\\\Windows\\\\System32\\\\regsvr32.exe",
          "ruleName": "technique_id=T1218.010,technique_name=Regsvr32",
          "company": "Microsoft Corporation",
          "commandLine": "  /s /i \\"C:\\\\AtomicRedTeam\\\\atomics\\\\T1218.010\\\\bin\\\\AllTheThingsx86.dll\\"",
          "integrityLevel": "High",
          "fileVersion": "10.0.26100.6725 (WinBuild.160101.0800)",
          "user": "windows\\\\windowss",
          "terminalSessionId": "1",
          "parentUser": "windows\\\\windowss"
        },
        "system": {
          "eventID": "1",
          "keywords": "0x8000000000000000",
          "providerGuid": "{5770385f-c22a-43e0-bf4c-06f5698ffbd9}",
          "level": "4",
          "channel": "Microsoft-Windows-Sysmon/Operational",
          "opcode": "0",
          "message": "\"Process Create:\\r\\nRuleName: technique_id=T1218.010,technique_name=Regsvr32\\r\\nUtcTime: 2026-01-28 07:21:17.802\\r\\nProcessGuid: {557f07f7-b8ed-6979-8f0b-000000000900}\\r\\nProcessId: 10632\\r\\nImage: C:\\\\Windows\\\\SysWOW64\\\\regsvr32.exe\\r\\nFileVersion: 10.0.26100.6725 (WinBuild.160101.0800)\\r\\nDescription: Microsoft(C) Register Server\\r\\nProduct: Microsoft® Windows® Operating System\\r\\nCompany: Microsoft Corporation\\r\\nOriginalFileName: REGSVR32.EXE\\r\\nCommandLine:   /s /i \\"C:\\\\AtomicRedTeam\\\\atomics\\\\T1218.010\\\\bin\\\\AllTheThingsx86.dll\\"\\r\\nCurrentDirectory: C:\\\\Users\\\\windowss\\\\AppData\\\\Local\\\\Temp\\\\\\r\\nUser: windows\\\\windowss\\r\\nLogonGuid: {557f07f7-e3fd-6976-5cb9-240000000000}\\r\\nLogonId: 0x24B95C\\r\\nTerminalSessionId: 1\\r\\nIntegrityLevel: High\\r\\nHashes: SHA1=EF75288011693FDCEBE3FAEC0D4CC1B2E16BC473,MD5=6370B65F2CC3D1EAE5F1742FC626DC18,SHA256=05DBA535304128E3DD1005DEA96F40C695EDD67F176E0BBF490DB5296A58A26C,IMPHASH=1F9497A69740A14D93841F62B8A4C646\\r\\nParentProcessGuid: {557f07f7-b8ed-6979-8e0b-000000000900}\\r\\nParentProcessId: 2192\\r\\nParentImage: C:\\\\Windows\\\\System32\\\\regsvr32.exe\\r\\nParentCommandLine: C:\\\\Windows\\\\system32\\\\regsvr32.exe  /s /i \\"C:\\\\AtomicRedTeam\\\\atomics\\\\T1218.010\\\\bin\\\\AllTheThingsx86.dll\\"\\r\\nParentUser: windows\\\\windowss\"",
          "version": "5",
          "systemTime": "2026-01-28T07:21:17.8195306Z",
          "eventRecordID": "258234",
          "threadID": "4560",
          "computer": "windows",
          "task": "1",
          "processID": "3764",
          "severityValue": "INFORMATION",
          "providerName": "Microsoft-Windows-Sysmon"
        }
      }
    },
Carrying out further investigations on other related events, you can see a process injection event created by the regsvr32 utility and the image loaded:
"data": {
  "win": {
    "eventdata": {
      "originalFileName": "clrjit.dll",
      "image": "C:\\\\Windows\\\\SysWOW64\\\\regsvr32.exe",
      "product": "Microsoft® .NET Framework",
      "signature": "Microsoft Corporation",
      "imageLoaded": "C:\\\\Windows\\\\Microsoft.NET\\\\Framework\\\\v4.0.30319\\\\clrjit.dll",
      "description": "Microsoft .NET Runtime Just-In-Time Compiler",
      "signed": "true",
      "signatureStatus": "Valid",
      "processGuid": "{557f07f7-b8ed-6979-8f0b-000000000900}",
      "processId": "10632",
      "utcTime": "2026-01-28 07:21:18.249",
      "hashes": "SHA1=69DA3EBCB1F9983C6492D09FB55C0023203B47D3,MD5=76E57172ECB5F2374CAA54078DA79D6A,SHA256=B07B68F675B48BA7200C9D507DB7E956CEEF9C39848B3328EBB2EF6CC4E91727,IMPHASH=22B42E3761A89D99CCF356A85C24E209",
      "ruleName": "technique_id=T1055,technique_name=Process Injection",
      "company": "Microsoft Corporation",
      "fileVersion": "4.8.9221.0 built by: NET481REL1LAST_25H2",
      "user": "windows\\\\windowss"
    },
    "system": {
      "eventID": "7",
      "keywords": "0x8000000000000000",
      "providerGuid": "{5770385f-c22a-43e0-bf4c-06f5698ffbd9}",
      "level": "4",
      "channel": "Microsoft-Windows-Sysmon/Operational",
      "opcode": "0",
      "message": "\"Image loaded:\\r\\nRuleName: technique_id=T1055,technique_name=Process Injection\\r\\nUtcTime: 2026-01-28 07:21:18.249\\r\\nProcessGuid: {557f07f7-b8ed-6979-8f0b-000000000900}\\r\\nProcessId: 10632\\r\\nImage: C:\\\\Windows\\\\SysWOW64\\\\regsvr32.exe\\r\\nImageLoaded: C:\\\\Windows\\\\Microsoft.NET\\\\Framework\\\\v4.0.30319\\\\clrjit.dll\\r\\nFileVersion: 4.8.9221.0 built by: NET481REL1LAST_25H2\\r\\nDescription: Microsoft .NET Runtime Just-In-Time Compiler\\r\\nProduct: Microsoft® .NET Framework\\r\\nCompany: Microsoft Corporation\\r\\nOriginalFileName: clrjit.dll\\r\\nHashes: SHA1=69DA3EBCB1F9983C6492D09FB55C0023203B47D3,MD5=76E57172ECB5F2374CAA54078DA79D6A,SHA256=B07B68F675B48BA7200C9D507DB7E956CEEF9C39848B3328EBB2EF6CC4E91727,IMPHASH=22B42E3761A89D99CCF356A85C24E209\\r\\nSigned: true\\r\\nSignature: Microsoft Corporation\\r\\nSignatureStatus: Valid\\r\\nUser: windows\\\\windowss\"",
      "version": "3",
      "systemTime": "2026-01-28T07:21:18.2504066Z",
      "eventRecordID": "258239",
      "threadID": "4560",
      "computer": "windows",
      "task": "7",
      "processID": "3764",
      "severityValue": "INFORMATION",
      "providerName": "Microsoft-Windows-Sysmon"
    }
  }
},
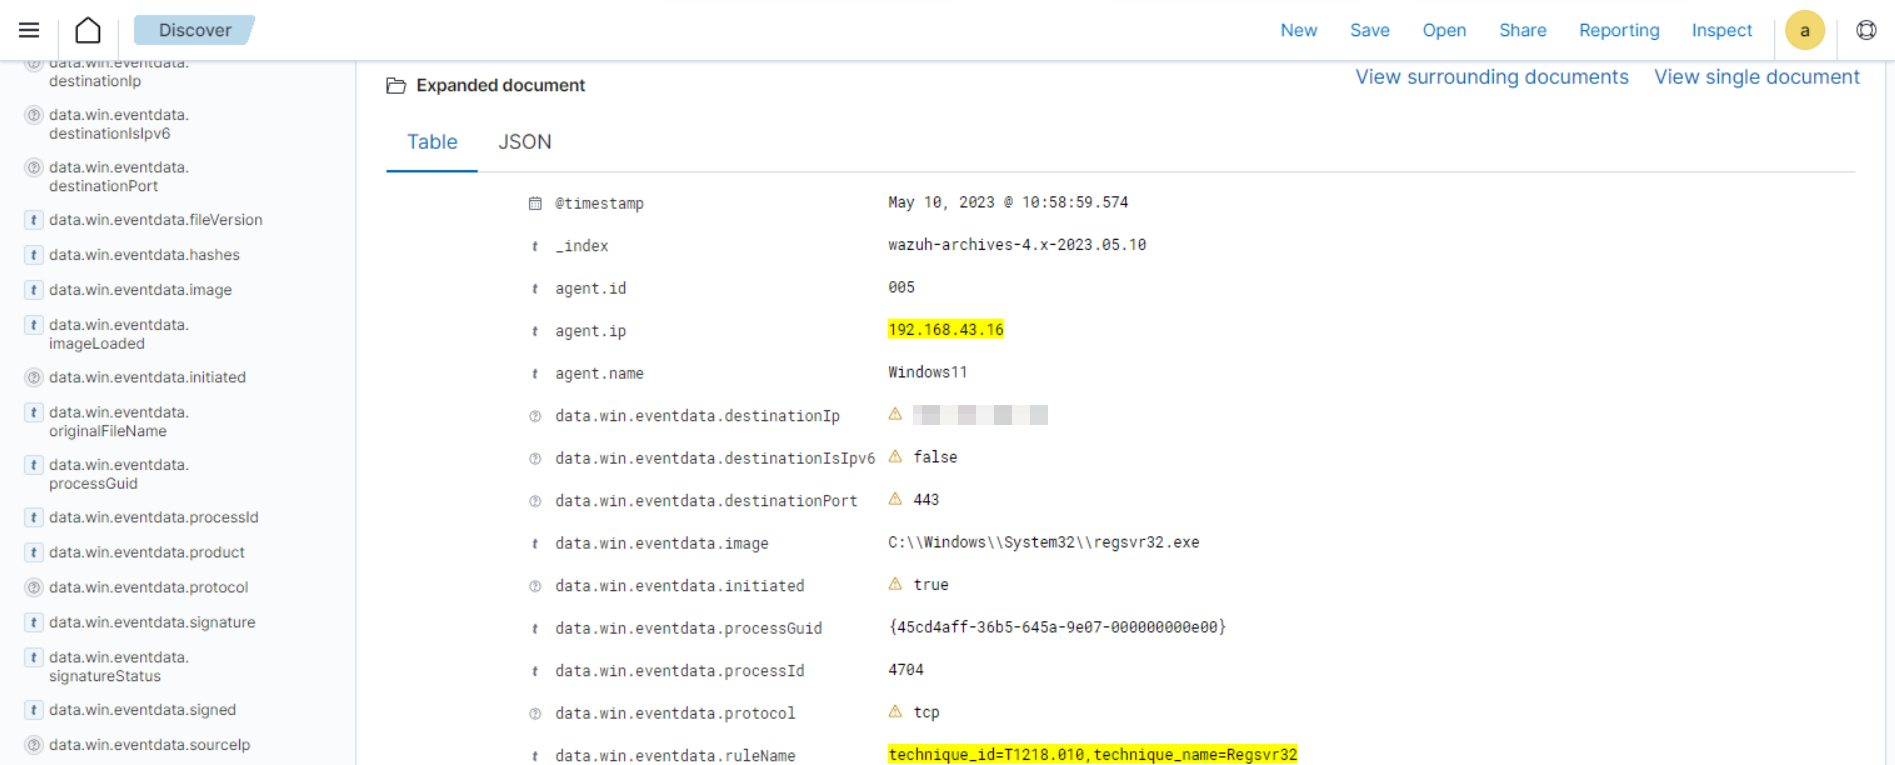
Apply the
data.win.eventdata.ruleName:technique_id=T1218.010,technique_name=Regsvr32filter to see the technique ID as shown below.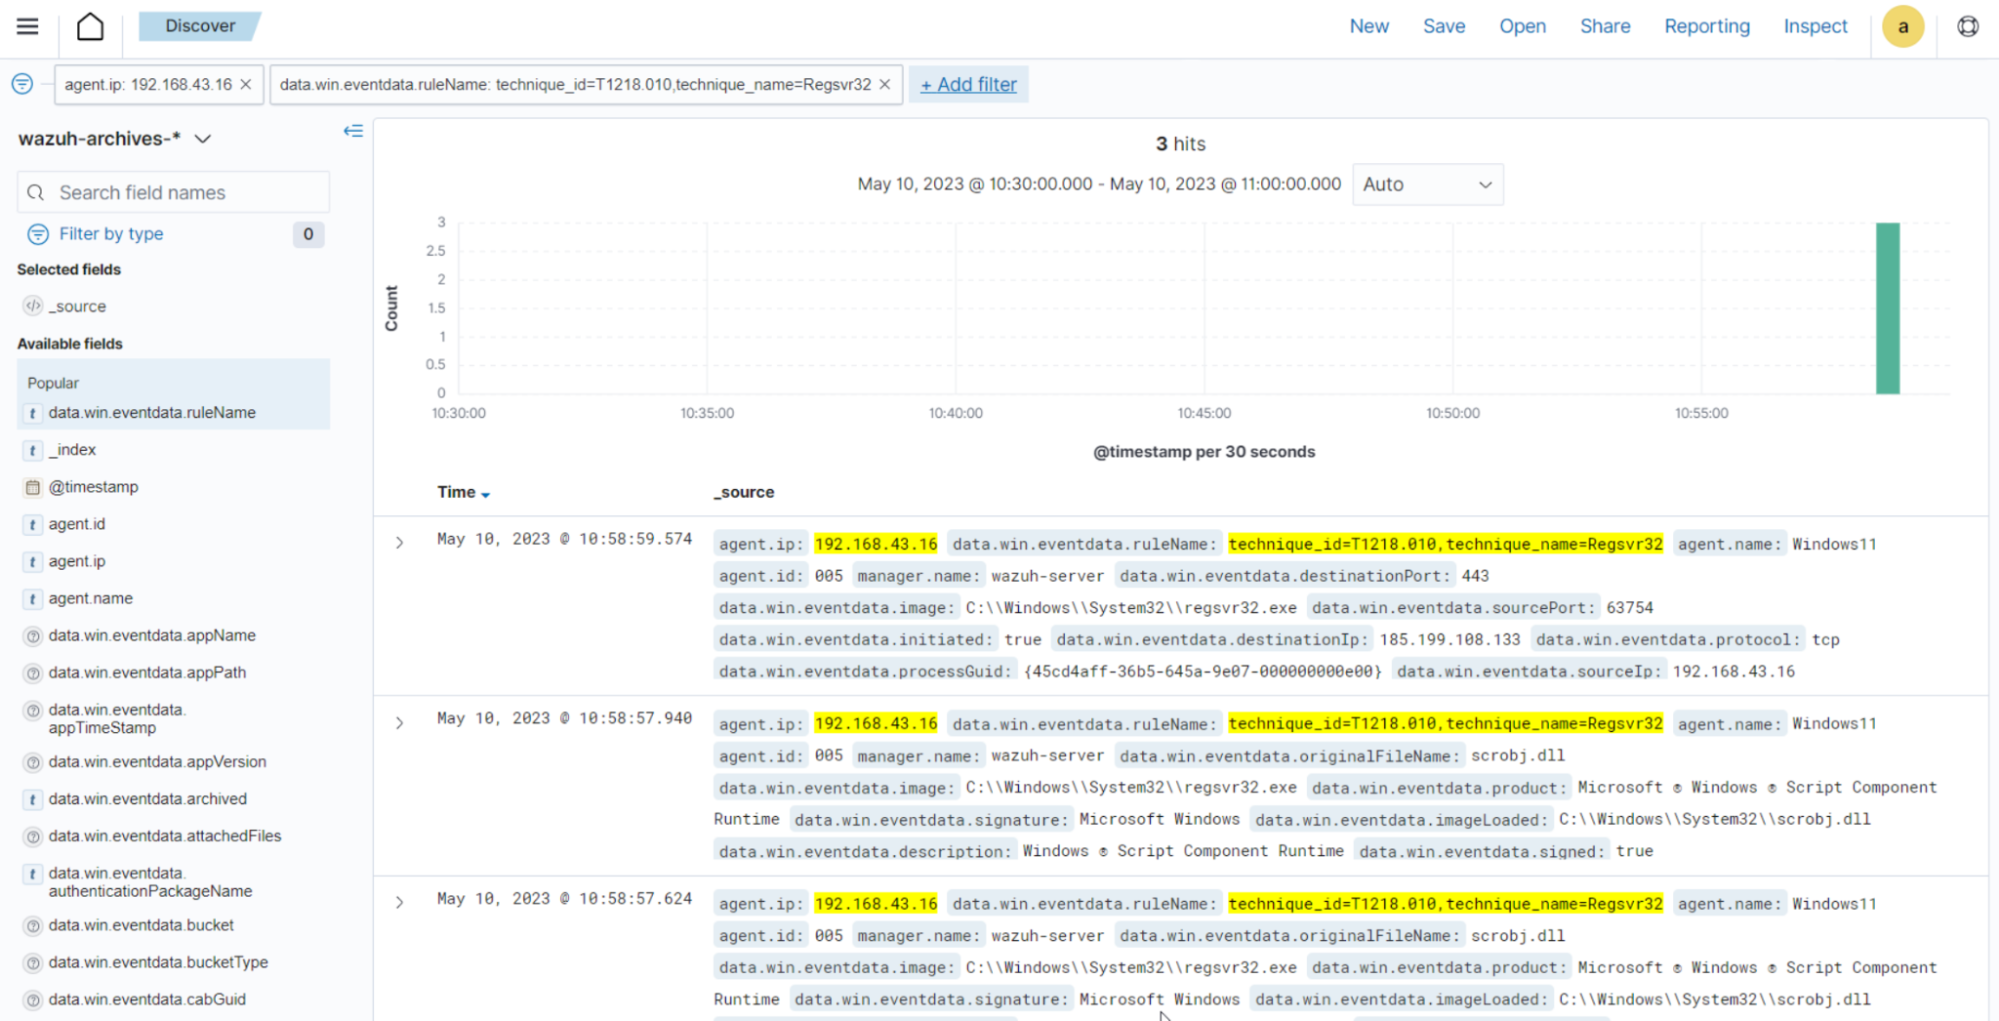
Expand the event to view its associated fields.
Click on the JSON tab to view the JSON format of the archived logs.
You can use events from the Wazuh archives to develop detection logic and write custom decoders and rules. You can also use the out-of-the-box wazuh-logtest tool to test and verify rules against provided logs. For more information, see the Custom rules, Custom decoders, and wazuh-logtest documentation.