Wazuh dashboard
The Wazuh dashboard is a flexible and intuitive web interface for visualizing, analyzing, and managing security data. It enables users to investigate events and alerts, oversee the Wazuh platform, and enforce role-based access control (RBAC) and single sign-on (SSO) policies.
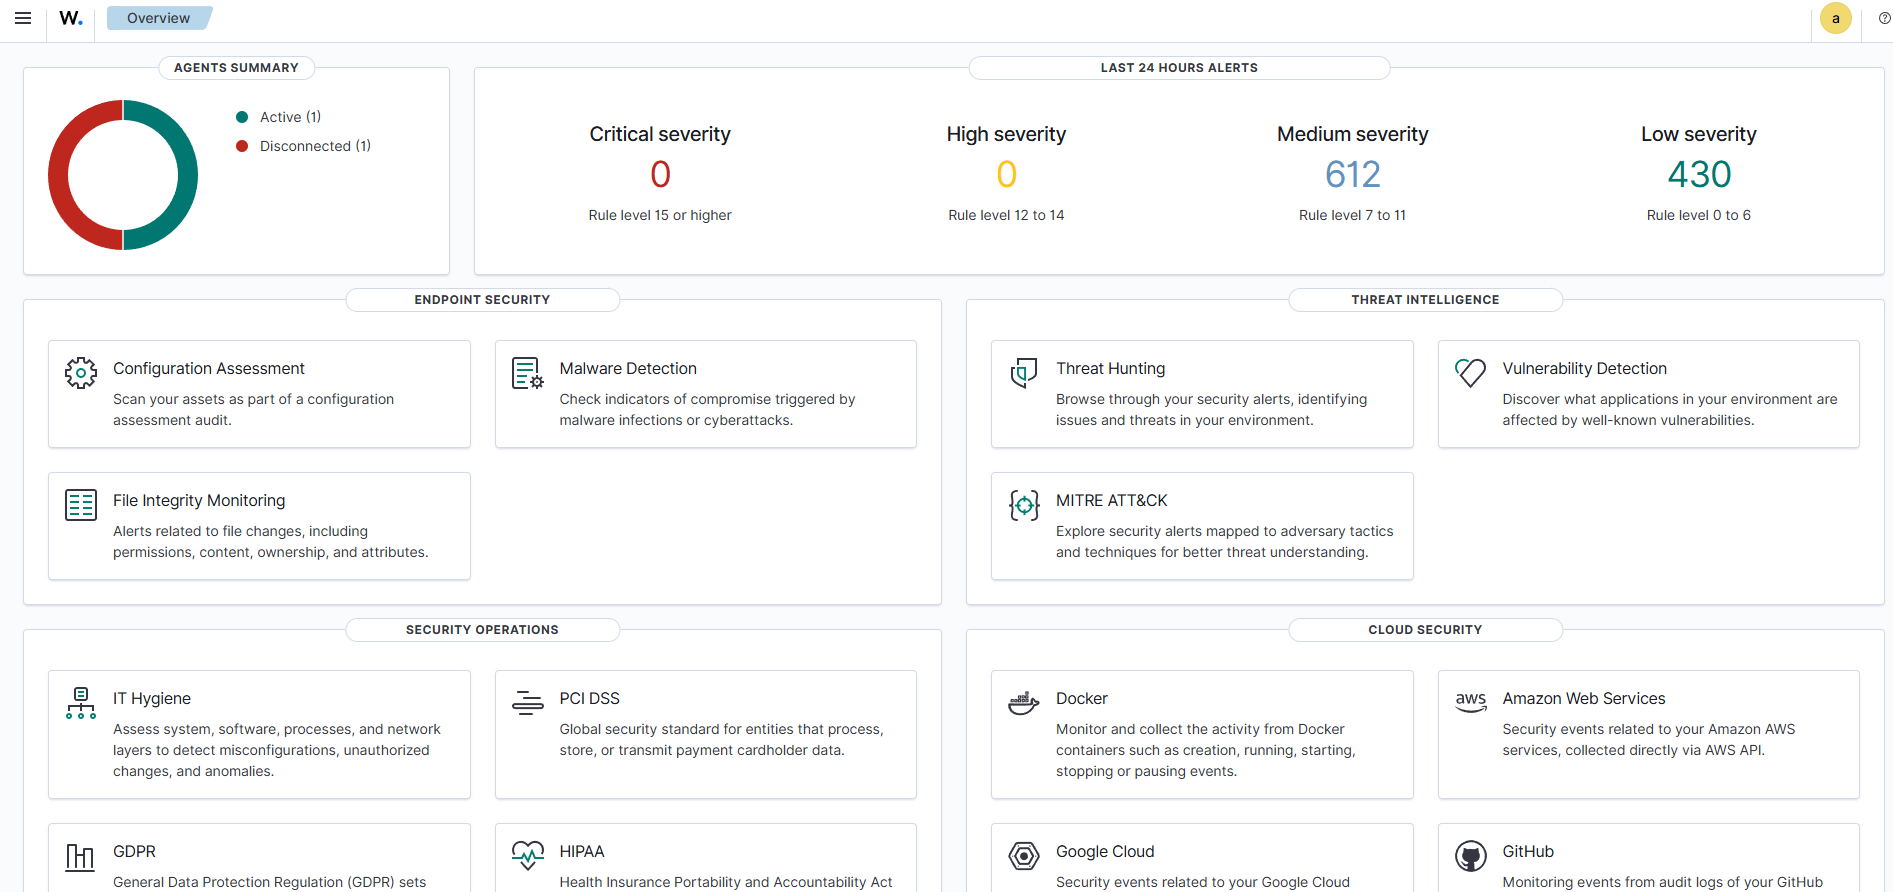
Data visualization and analysis
The Wazuh dashboard lets users navigate security data collected from Wazuh agent and agentless devices, and alerts generated by the Wazuh server. It includes dashboards for threat hunting, malware detection, file integrity monitoring, system inventory, and regulatory compliance (for example, PCI DSS, GDPR, HIPAA, and NIST 800-53). You can generate reports and create custom visualizations and dashboards.
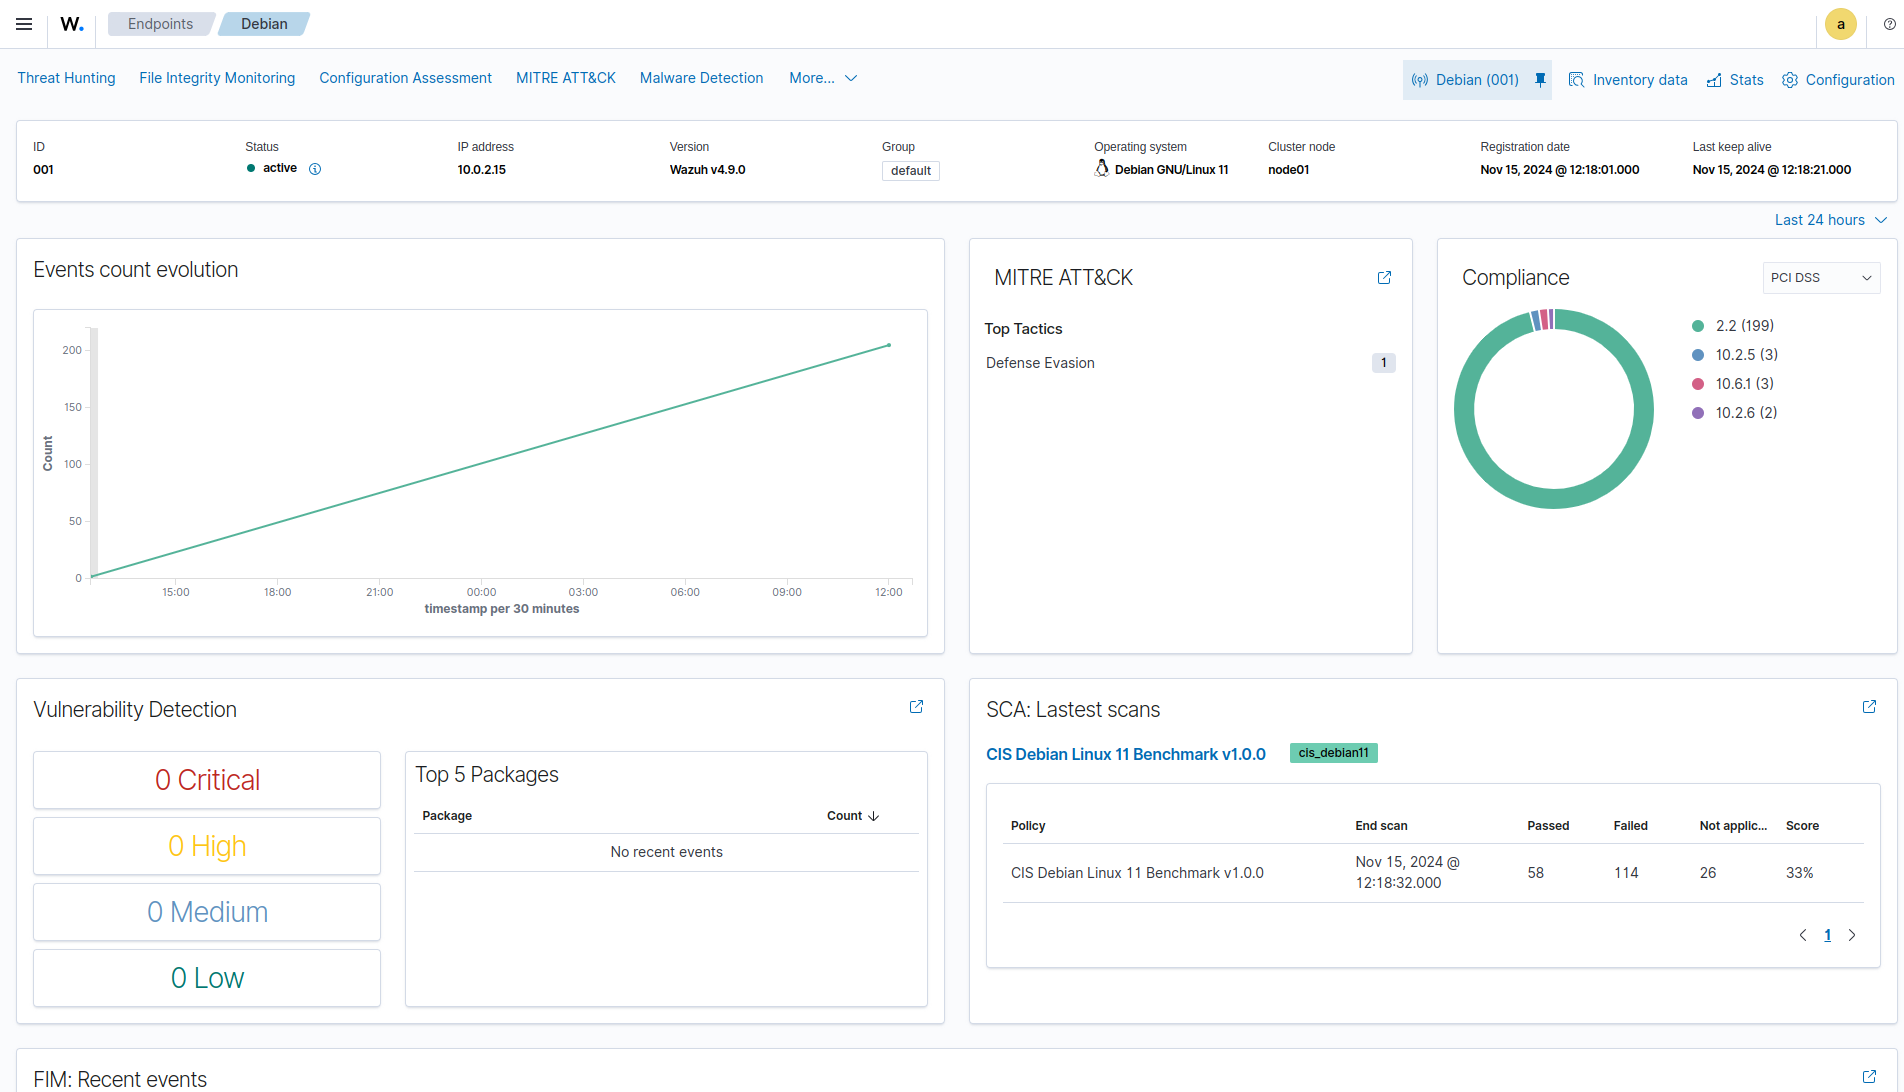
Agents monitoring and configuration
The Wazuh dashboard allows users to manage agent configuration and monitor agent status. For each monitored endpoint, users can define which agent modules are enabled, which log files are read, which files are monitored for integrity changes, and which configuration checks are performed.
Platform management
The Wazuh dashboard provides a user interface to manage a Wazuh deployment. This includes monitoring the status, logs, and statistics of Wazuh components, configuring the Wazuh server, and creating custom rules and decoders for log analysis and threat detection.
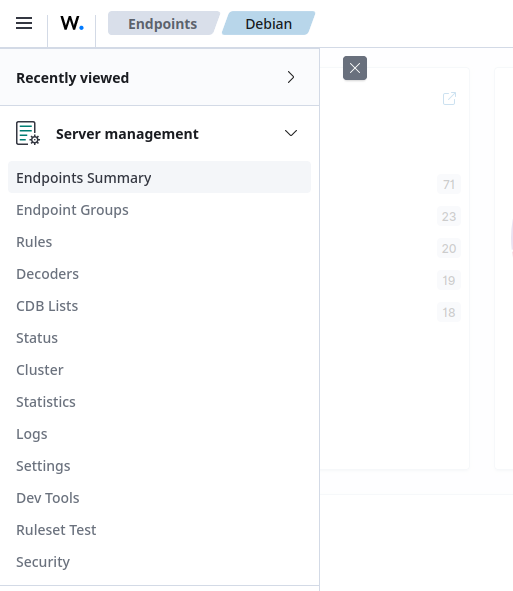
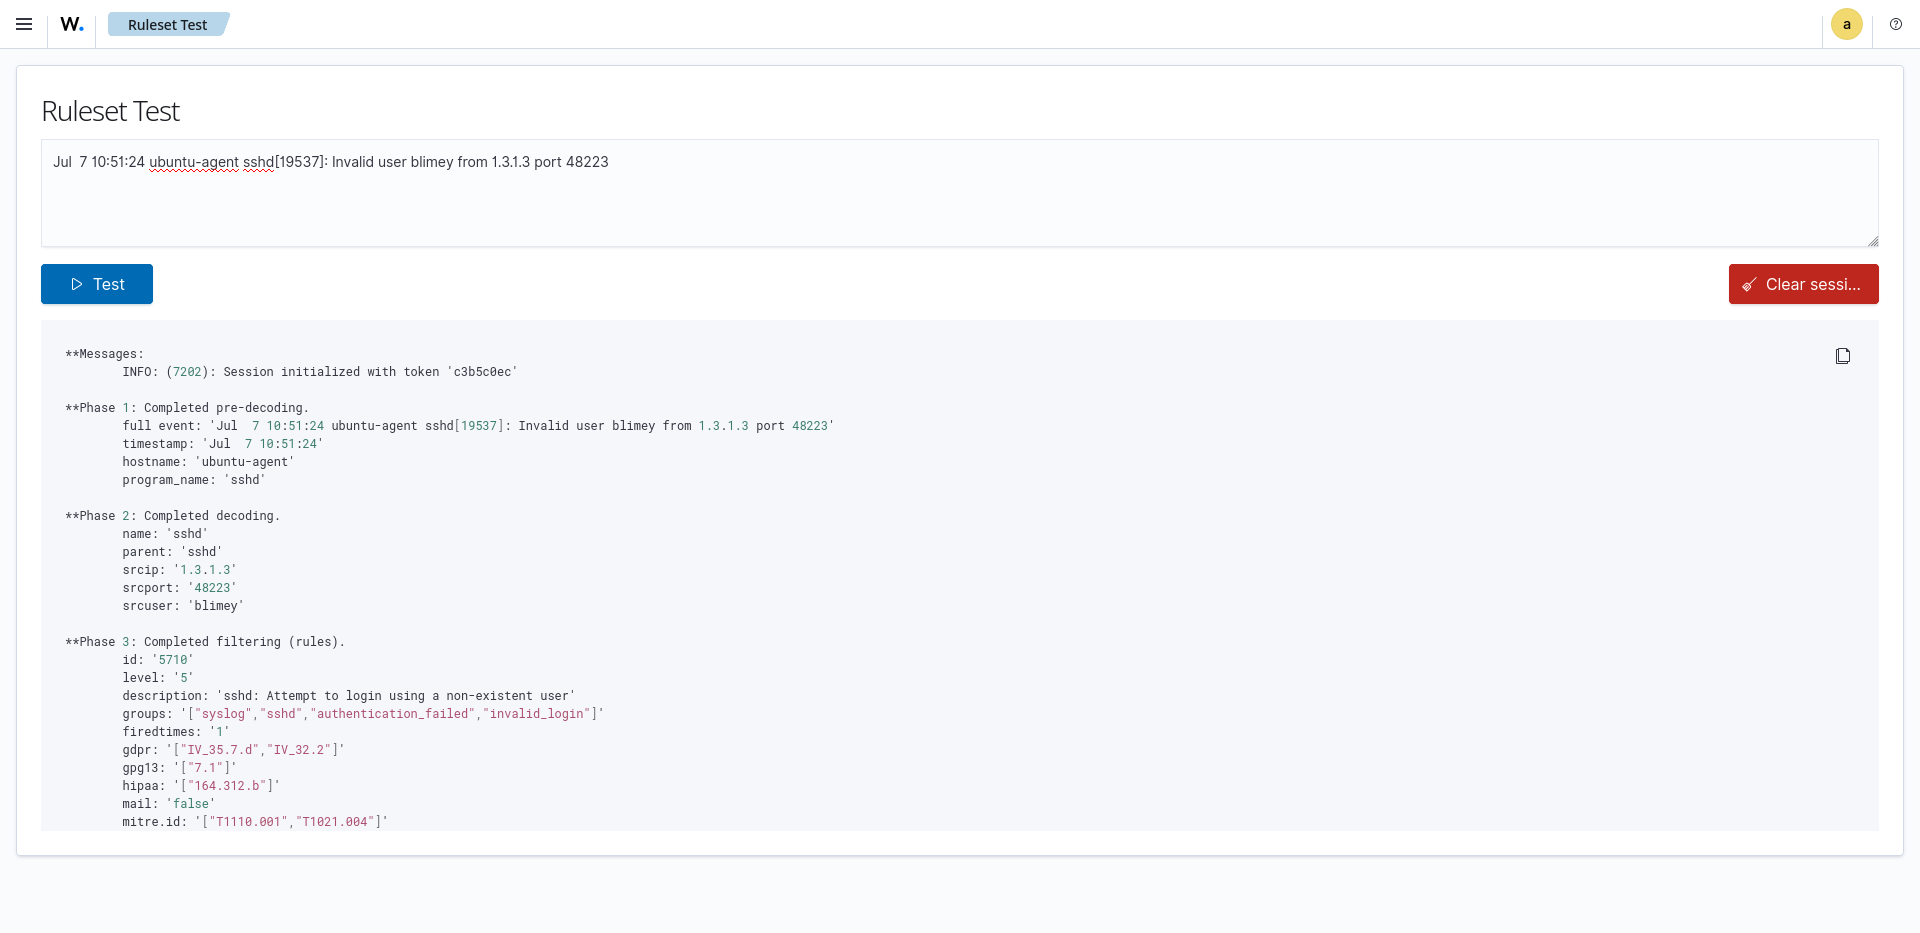
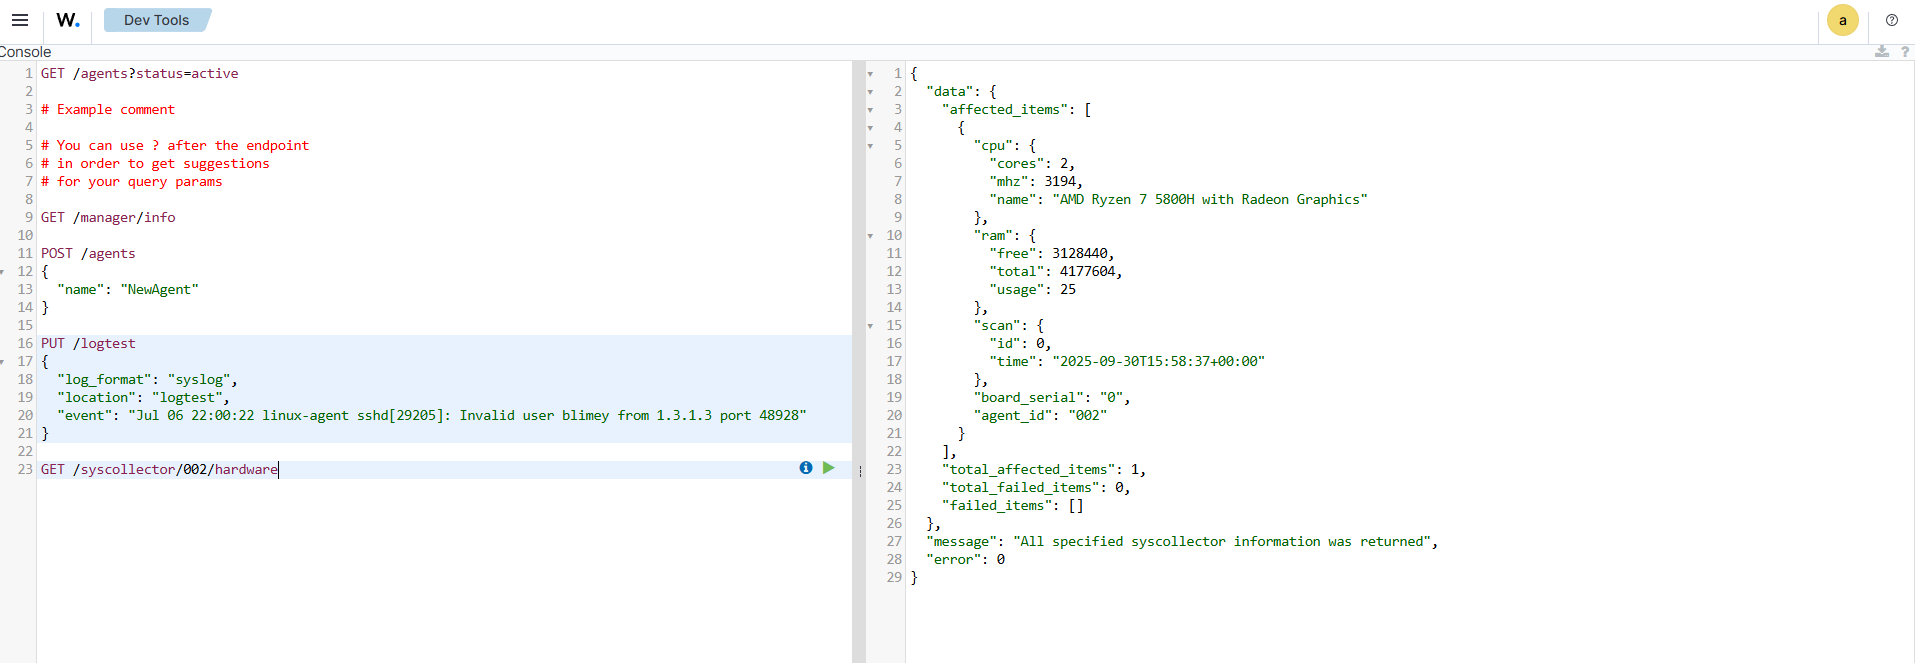
Developer tools
The Wazuh dashboard includes a ruleset test tool that processes log messages to show how they are decoded and whether they match a detection rule. This is useful when testing custom decoders and rules.
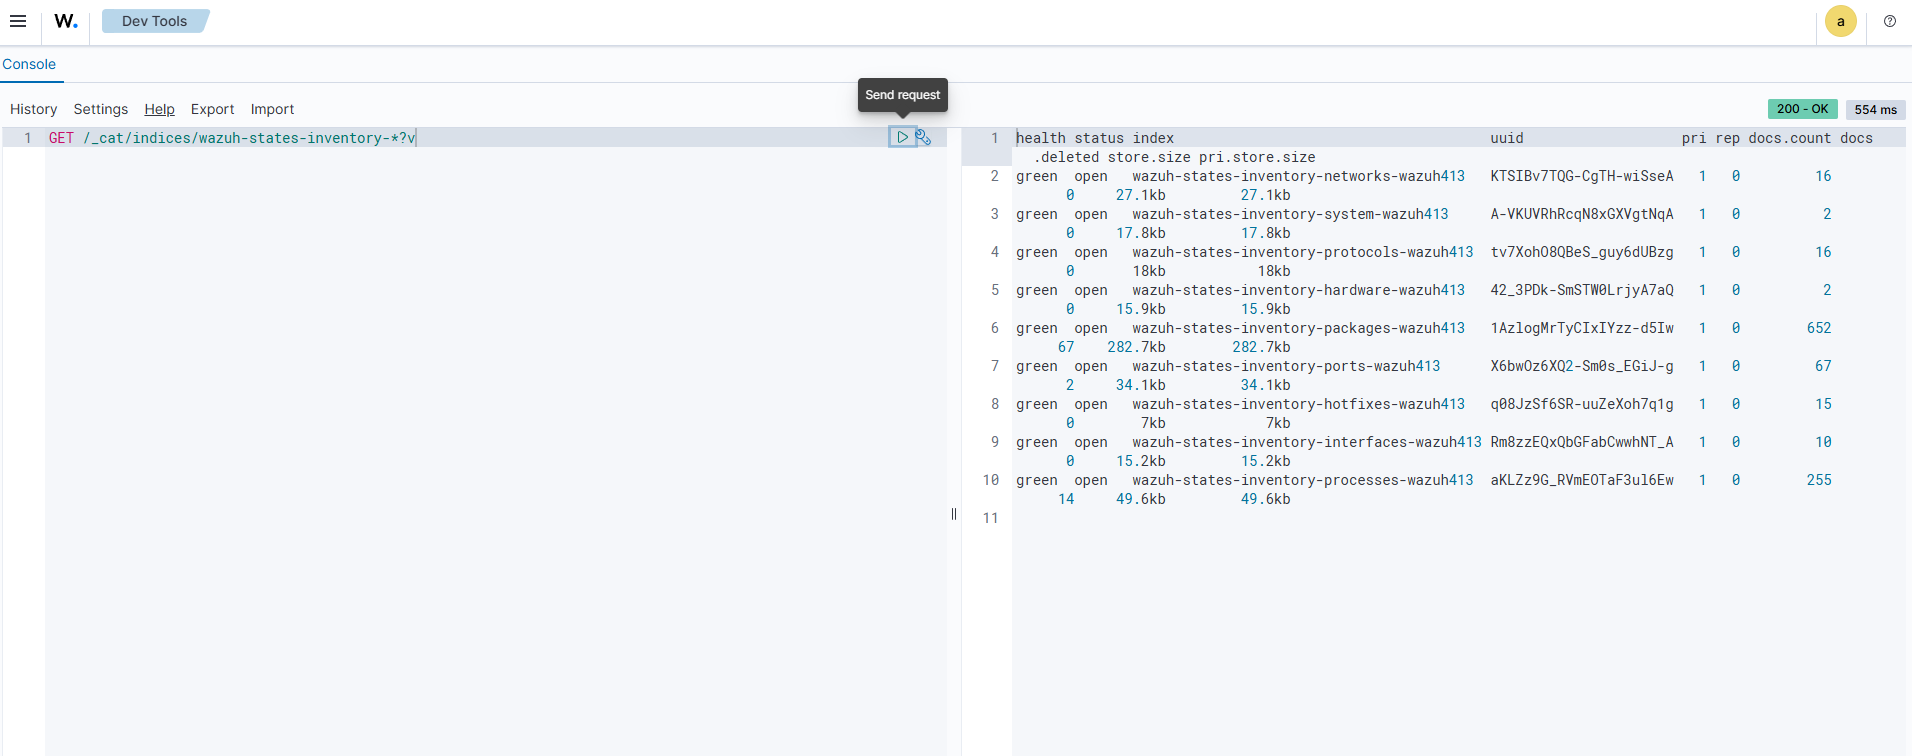
The Wazuh dashboard also includes API consoles for interacting with the Wazuh server and the Wazuh indexer API. They are used to manage the Wazuh server capabilities or interact with Wazuh indexer indices.
Wazuh server API
Wazuh indexer API