Elastic Stack integration
Elasticsearch is the central component of the Elastic Stack, (commonly referred to as the ELK Stack - Elasticsearch, Logstash, and Kibana), which is a set of free and open tools for data ingestion, enrichment, storage, analysis, and visualization.
In this guide, you can find out how to integrate Wazuh with Elastic in the following ways:
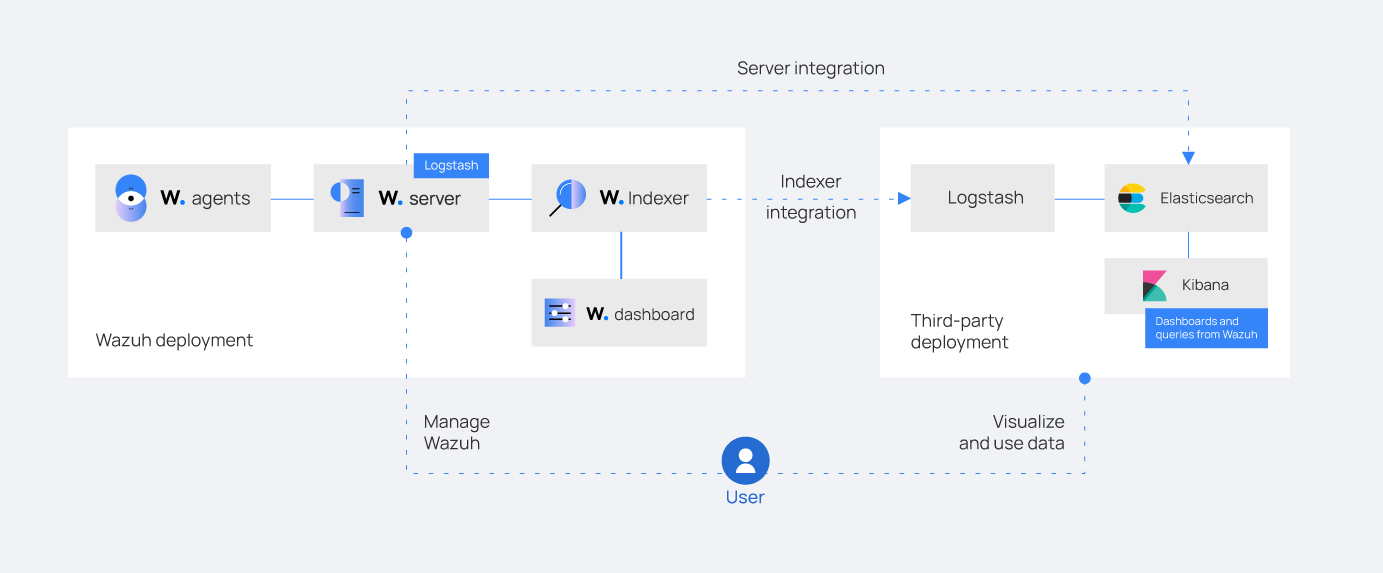
Wazuh indexer integration using Logstash
Perform all the steps described below on your Logstash server. You must install Logstash on a dedicated server or on the server hosting the third-party indexer. We performed the steps on a Linux operating system. Logstash forwards the data from the Wazuh indexer to Elasticsearch in the form of indexes.
Learn more about the Wazuh indexer integration and its necessary considerations.
Installing Logstash
Perform the following steps to install Logstash and the required plugin.
Follow the Elastic documentation to install Logstash. Ensure that you consider the requirements and performance tuning guidelines for running Logstash.
Note
Ensure all components of your ELK (Elasticsearch, Logstash, and Kibana) stack are the same version to avoid compatibility issues.
Run the following command to install the logstash-input-opensearch plugin. This plugin reads data from the Wazuh indexer into the Logstash pipeline.
$ sudo /usr/share/logstash/bin/logstash-plugin install logstash-input-opensearch
Copy the Wazuh indexer and Elasticsearch root certificates to the Logstash server.
Note
You can add the certificates to any directory of your choice. For example, we added them in
/etc/logstash/wazuh-indexer-certsand/etc/logstash/elasticsearch-certsrespectively.Give the
logstashuser the necessary permissions to read the copied certificates:$ sudo chmod -R 755 </PATH/TO/LOCAL/WAZUH_INDEXER/CERTIFICATE>/root-ca.pem $ sudo chmod -R 755 </PATH/TO/LOCAL/ELASTICSEARCH/CERTIFICATE>/root-ca.pem
Replace
</PATH/TO/LOCAL/WAZUH_INDEXER/CERTIFICATE>/root-ca.pemand</PATH/TO/LOCAL/ELASTICSEARCH/CERTIFICATE>/root-ca.pemwith your Wazuh indexer and Elasticsearch certificate local paths on the Logstash endpoint respectively.
Configuring new indexes
You must define the mappings between the data and the index types to ensure Elasticsearch indexes your data correctly. Elasticsearch can infer these mappings, but we recommend that you explicitly configure them. Wazuh provides a set of mappings to ensure Elasticsearch indexes the data correctly.
You need to use the logstash/es_template.json template to configure this index initialization for your Elasticsearch platform. The refresh_interval is set to 5s in the template we provide.
Create a /etc/logstash/templates/ directory and download the template as wazuh.json using the following commands:
$ sudo mkdir /etc/logstash/templates
$ sudo curl -o /etc/logstash/templates/wazuh.json https://packages.wazuh.com/integrations/elastic/4.x-8.x/dashboards/wz-es-4.x-8.x-template.json
In Elasticsearch, the indexes support up to 1000 fields by default. However, Wazuh logs might contain even more than this number of fields. To solve this issue, the provided wazuh.json template has the fields set to 10000 by default as shown below:
...
"template": {
  ...
  "settings": {
        ...
        "mapping": {
         "total_fields": {
            "limit": 10000
         }
        }
        ...
  }
  ...
}
...
You can further increase this value by following the creating an index template documentation.
Configuring a pipeline
A Logstash pipeline allows Logstash to use plugins to read the data from the Wazuh indexes and send them to Elasticsearch.
The Logstash pipeline requires access to the following secret values:
Wazuh indexer credentials
Elasticsearch credentials
We use the Logstash keystore to securely store these values.
Run the following commands on your Logstash server to set a keystore password:
$ set +o history
$ echo 'LOGSTASH_KEYSTORE_PASS="<MY_KEYSTORE_PASSWORD>"'| sudo tee /etc/sysconfig/logstash
$ export LOGSTASH_KEYSTORE_PASS=<MY_KEYSTORE_PASSWORD>
$ set -o history
$ sudo chown root /etc/sysconfig/logstash
$ sudo chmod 600 /etc/sysconfig/logstash
$ sudo systemctl start logstash
Where
<MY_KEYSTORE_PASSWORD>is your keystore password.Note
You need to create the
/etc/sysconfigfolder if it does not exist on your server.Run the following commands to securely store the credentials of the Wazuh indexer and Elasticsearch in the Logstash keystore.
Note
When you run each of the commands, you will be prompted to enter your credentials and the credentials will not be visible as you enter them.
ELASTICSEARCH_USERNAME,ELASTICSEARCH_PASSWORD,WAZUH_INDEXER_USERNAME, andWAZUH_INDEXER_PASSWORDare keys representing the secret values you are adding to the Logstash keystore. These keys will be used in the Logstash pipeline.Create a new Logstash keystore:
$ sudo -E /usr/share/logstash/bin/logstash-keystore --path.settings /etc/logstash create
Store your Elasticsearch username and password:
$ sudo -E /usr/share/logstash/bin/logstash-keystore --path.settings /etc/logstash add ELASTICSEARCH_USERNAME
$ sudo -E /usr/share/logstash/bin/logstash-keystore --path.settings /etc/logstash add ELASTICSEARCH_PASSWORD
Store your Wazuh indexer administrator username and password:
$ sudo -E /usr/share/logstash/bin/logstash-keystore --path.settings /etc/logstash add WAZUH_INDEXER_USERNAME
$ sudo -E /usr/share/logstash/bin/logstash-keystore --path.settings /etc/logstash add WAZUH_INDEXER_PASSWORD
Where:
ELASTICSEARCH_USERNAMEandELASTICSEARCH_PASSWORDare keys representing your Elasticsearch username and password respectively.WAZUH_INDEXER_USERNAMEandWAZUH_INDEXER_PASSWORDare keys representing your Wazuh indexer administrator username and password respectively.
Perform the following steps to configure the Logstash pipeline.
Create the configuration file
wazuh-elasticsearch.confin/etc/logstash/conf.d/folder:$ sudo touch /etc/logstash/conf.d/wazuh-elasticsearch.conf
Add the following configuration to the
wazuh-elasticsearch.conffile. This sets the parameters required to run Logstash.input { opensearch { hosts => ["<WAZUH_INDEXER_ADDRESS>:9200"] user => "${WAZUH_INDEXER_USERNAME}" password => "${WAZUH_INDEXER_PASSWORD}" index => "wazuh-alerts-4.x-*" ssl => true ca_file => "</PATH/TO/LOCAL/WAZUH_INDEXER>/root-ca.pem" query => '{ "query": { "range": { "@timestamp": { "gt": "now-1m" } } } }' schedule => "* * * * *" } } output { elasticsearch { hosts => "<ELASTICSEARCH_ADDRESS>" index => "wazuh-alerts-4.x-%{+YYYY.MM.dd}" user => '${ELASTICSEARCH_USERNAME}' password => '${ELASTICSEARCH_PASSWORD}' ssl => true cacert => "</PATH/TO/LOCAL/ELASTICSEARCH>/root-ca.pem" template => "/etc/logstash/templates/wazuh.json" template_name => "wazuh" template_overwrite => true } }Where:
<WAZUH_INDEXER_ADDRESS>is your Wazuh indexer address or addresses in case of cluster deployment.<ELASTICSEARCH_ADDRESS>is your Elasticsearch IP address.</PATH/TO/LOCAL/WAZUH_INDEXER>/root-ca.pemis your Wazuh indexer certificate local path on the Logstash server. For example, you can use/etc/logstash/wazuh-indexer-certs/root-ca.pemwhich is the Wazuh indexer root certificate that was copied earlier.</PATH/TO/LOCAL/ELASTICSEARCH>/root-ca.pemis your Elasticsearch certificate local path on the Logstash server. For example, you can use/etc/logstash/elasticsearch-certs/root-ca.pemwhich is the Elasticsearch certificate that was copied earlier.
Note
For testing purposes, you can avoid SSL verification by replacing
cacert => "</PATH/TO/LOCAL/ELASTICSEARCH>/root-ca.pem"withssl_certificate_verification => false.If you are using composable index templates and the _index_template API, set the optional parameter legacy_template => false.
Running Logstash
Once you have everything set, run Logstash from CLI with your configuration:
$ sudo systemctl stop logstash
$ sudo -E /usr/share/logstash/bin/logstash -f /etc/logstash/conf.d/wazuh-elasticsearch.conf --path.settings /etc/logstash/
Make sure to use your own paths for the executable, the pipeline, and the configuration files.
Ensure that Wazuh indexer RESTful API port (9200) is open on your Wazuh indexer. To verify that the necessary ports for Wazuh component communication are open, refer to the list of required ports.
After confirming that the configuration loads correctly without errors, cancel the command and run Logstash as a service. This way Logstash is not dependent on the lifecycle of the terminal it's running on. You can now enable and run Logstash as a service:
$ sudo systemctl enable logstash.service
$ sudo systemctl start logstash.service
Check Elastic documentation for more details on setting up and running Logstash.
Note
Any data indexed before the configuration is complete will not be forwarded to the Elastic indexes.
The /var/log/logstash/logstash-plain.log file in the Logstash instance stores events generated when Logstash runs. View this file in case you need to troubleshoot.
After Logstash is successfully running, check how to configure the Wazuh alert index pattern and verify the integration.
Wazuh server integration using Logstash
Perform all the steps below on your Wazuh server. Learn more about the Wazuh server integration and its necessary considerations.
Installing Logstash
We use Logstash to forward security data in the /var/ossec/logs/alerts/alerts.json alerts file from the Wazuh server to the Elasticsearch indexes.
Perform the following steps to install Logstash and the required plugin.
Follow the Elastic documentation to install Logstash. Ensure that you consider the requirements and performance tuning guidelines for running Logstash.
Note
Ensure all components of your ELK (Elasticsearch, Logstash, and Kibana) stack are the same version to avoid compatibility issues.
Run the following command to install the logstash-output-elasticsearch plugin. This plugin allows Logstash to write data into Elasticsearch.
$ sudo /usr/share/logstash/bin/logstash-plugin install logstash-output-elasticsearch
Copy the Elasticsearch root certificate to the Wazuh server. You can add the certificate to any directory of your choice. In our case, we add it in
/etc/logstash/elasticsearch-certsdirectory.Give the
logstashuser the necessary permissions to read the copied certificates:$ sudo chmod -R 755 </PATH/TO/LOCAL/ELASTICSEARCH/CERTIFICATE>/root-ca.pem
Replace
</PATH/TO/LOCAL/ELASTICSEARCH/CERTIFICATE>/root-ca.pemwith your Elasticsearch certificate local path on the Wazuh server.
Configuring new indexes
You must define the mappings between the data and the index types to ensure Elasticsearch indexes your data correctly. Elasticsearch can infer these mappings, but we recommend that you explicitly configure them. Wazuh provides a set of mappings to ensure Elasticsearch indexes the data correctly.
You need to use the logstash/es_template.json template to configure this index initialization for your Elasticsearch platform. The refresh_interval is set to 5s in the template we provide.
Create a /etc/logstash/templates/ directory and download the template as wazuh.json using the following commands:
$ sudo mkdir /etc/logstash/templates
$ sudo curl -o /etc/logstash/templates/wazuh.json https://packages.wazuh.com/integrations/elastic/4.x-8.x/dashboards/wz-es-4.x-8.x-template.json
In Elasticsearch, the indexes support up to 1000 fields by default. However, Wazuh logs might contain even more than this number of fields. To solve this issue, the provided wazuh.json template has the fields set to 10000 by default as shown below:
...
"template": {
  ...
  "settings": {
        ...
        "mapping": {
         "total_fields": {
            "limit": 10000
         }
        }
        ...
  }
  ...
}
...
You can further increase this value by following the creating an index template documentation.
Configuring a pipeline
A Logstash pipeline allows Logstash to use plugins to read the data in the Wazuh /var/ossec/logs/alerts/alerts.json alert file and send them to Elasticsearch.
The Logstash pipeline requires access to your Elasticsearch credentials.
We use the Logstash keystore to securely store these values.
Run the following commands on your Logstash server to set a keystore password:
$ set +o history
$ echo 'LOGSTASH_KEYSTORE_PASS="<MY_KEYSTORE_PASSWORD>"'| sudo tee /etc/sysconfig/logstash
$ export LOGSTASH_KEYSTORE_PASS=<MY_KEYSTORE_PASSWORD>
$ set -o history
$ sudo chown root /etc/sysconfig/logstash
$ sudo chmod 600 /etc/sysconfig/logstash
$ sudo systemctl start logstash
Where
<MY_KEYSTORE_PASSWORD>is your keystore password.Note
You need to create the
/etc/sysconfigfolder if it does not exist on your server.Run the following commands to securely store the credentials of Elasticsearch.
Note
When you run each of the commands, you will be prompted to enter your credentials and the credentials will not be visible as you enter them.
ELASTICSEARCH_USERNAMEandELASTICSEARCH_PASSWORDare keys representing the secret values you are adding to the Logstash keystore. These keys will be used in the Logstash pipeline.Create a new Logstash keystore:
$ sudo -E /usr/share/logstash/bin/logstash-keystore --path.settings /etc/logstash create
Store your Elasticsearch username and password:
$ sudo -E /usr/share/logstash/bin/logstash-keystore --path.settings /etc/logstash add ELASTICSEARCH_USERNAME
$ sudo -E /usr/share/logstash/bin/logstash-keystore --path.settings /etc/logstash add ELASTICSEARCH_PASSWORD
Where
ELASTICSEARCH_USERNAMEandELASTICSEARCH_PASSWORDare keys representing your Elasticsearch username and password respectively.
Perform the following steps to configure the Logstash pipeline.
Create the configuration file
wazuh-elasticsearch.confin/etc/logstash/conf.d/folder:$ sudo touch /etc/logstash/conf.d/wazuh-elasticsearch.conf
Add the following configuration to the
wazuh-elasticsearch.conffile. This sets the parameters required to run Logstash.input { file { id => "wazuh_alerts" codec => "json" start_position => "beginning" stat_interval => "1 second" path => "/var/ossec/logs/alerts/alerts.json" mode => "tail" ecs_compatibility => "disabled" } } output { elasticsearch { hosts => "<ELASTICSEARCH_ADDRESS>" index => "wazuh-alerts-4.x-%{+YYYY.MM.dd}" user => '${ELASTICSEARCH_USERNAME}' password => '${ELASTICSEARCH_PASSWORD}' ssl => true cacert => "</PATH/TO/LOCAL/ELASTICSEARCH>/root-ca.pem" template => "/etc/logstash/templates/wazuh.json" template_name => "wazuh" template_overwrite => true } }Where:
<ELASTICSEARCH_ADDRESS>is your Elasticsearch IP address.</PATH/TO/LOCAL/ELASTICSEARCH>/root-ca.pemis your Elasticsearch root certificate local path on the Wazuh server. For example, you can use/etc/logstash/elasticsearch-certs/root-ca.pemwhich is the Elasticsearch root certificate that was copied earlier.
Note
For testing purposes, you can avoid SSL verification by replacing
cacert => "/PATH/TO/LOCAL/ELASTICSEARCH/root-ca.pem"withssl_certificate_verification => false.
By default the
/var/ossec/logs/alerts/alerts.jsonfile is owned by thewazuhuser with restrictive permissions. You must add thelogstashuser to thewazuhgroup so it can read the file when running Logstash as a service:$ sudo usermod -a -G wazuh logstash
Running Logstash
Once you have everything set, run Logstash from CLI with your configuration:
$ sudo systemctl stop logstash
$ sudo -E /usr/share/logstash/bin/logstash -f /etc/logstash/conf.d/wazuh-elasticsearch.conf --path.settings /etc/logstash/
Make sure to use your own paths for the executable, the pipeline, and the configuration files.
Ensure that Wazuh server RESTful API port (55000) is open on your Wazuh server. To verify that the necessary ports for Wazuh component communication are open, refer to the list of required ports.
After confirming that the configuration loads correctly without errors, cancel the command and run Logstash as a service. This way Logstash is not dependent on the lifecycle of the terminal it's running on. You can now enable and run Logstash as a service:
$ sudo systemctl enable logstash.service
$ sudo systemctl start logstash.service
Note
Any data indexed before the configuration is complete would not be forwarded to the Elastic indexes.
The /var/log/logstash/logstash-plain.log file in the Logstash instance stores events generated when Logstash runs. View this file in case you need to troubleshoot.
Check Elastic documentation for more details on setting up and running Logstash.
Configuring the Wazuh alerts index pattern in Elastic
In Kibana, do the following to create the index pattern name for the Wazuh alerts.
Select ☰ > Management > Stack Management.
Choose Kibana > Data Views and select Create data view.
Enter a name for the data view and define
wazuh-alerts-*as the index pattern name.Select timestamp in the Timestamp fields dropdown menu. Then Save data view to Kibana.
Open the menu and select Discover under Analytics.
Select ☰ > Analytics > Discover.
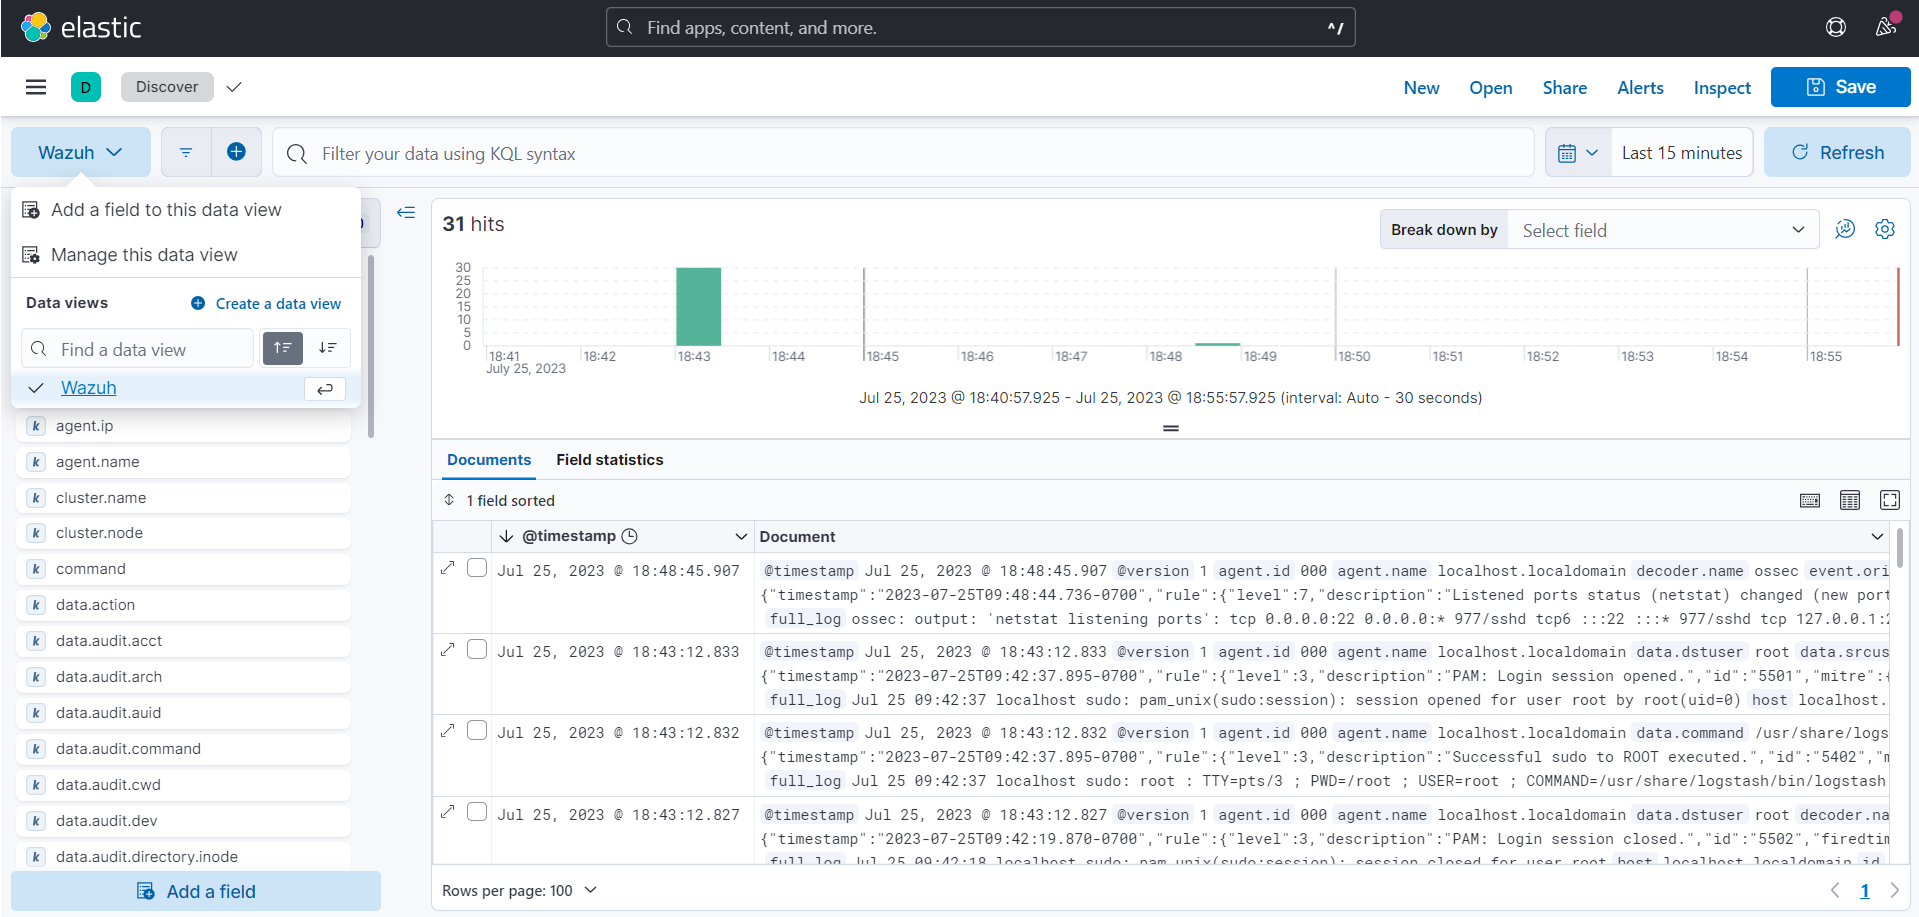
Verifying the integration
To check the integration with Elasticsearch, navigate to Discover in Kibana and verify that you can find the Wazuh security data with the data view name you entered.
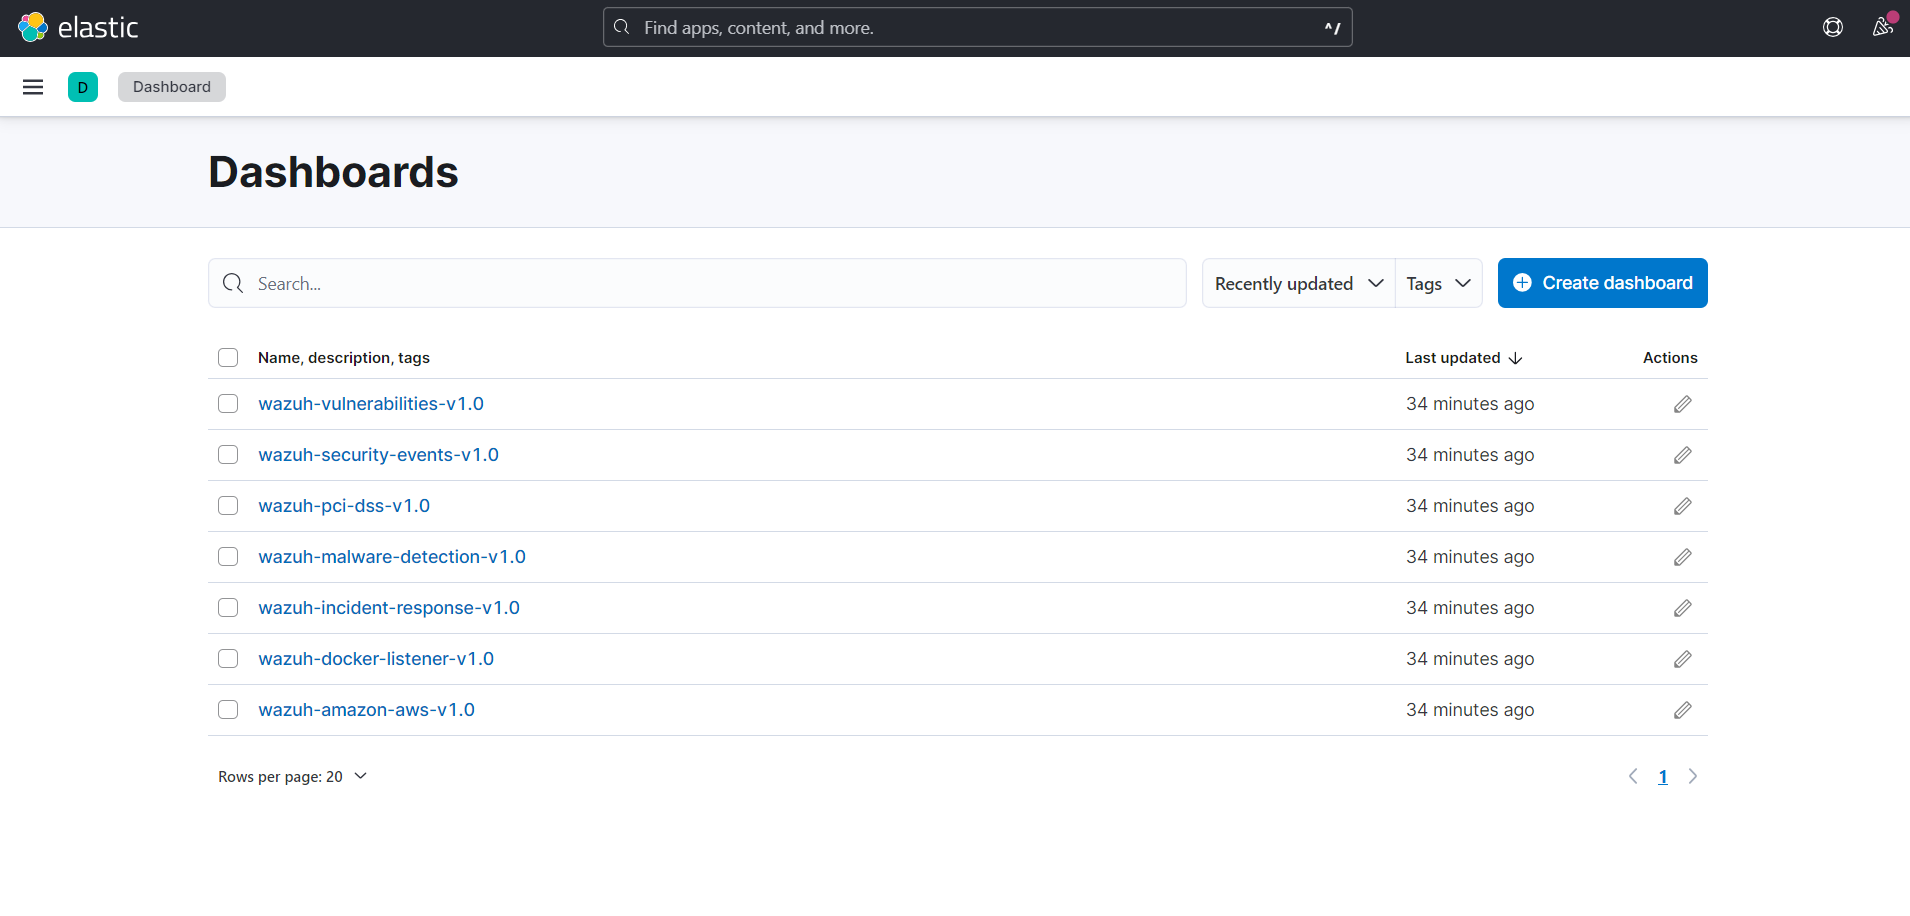
Elastic dashboards
Wazuh provides several dashboards for Elastic Stack. After finishing with the Elasticsearch integration setup, these dashboards display your Wazuh alerts in Elastic.
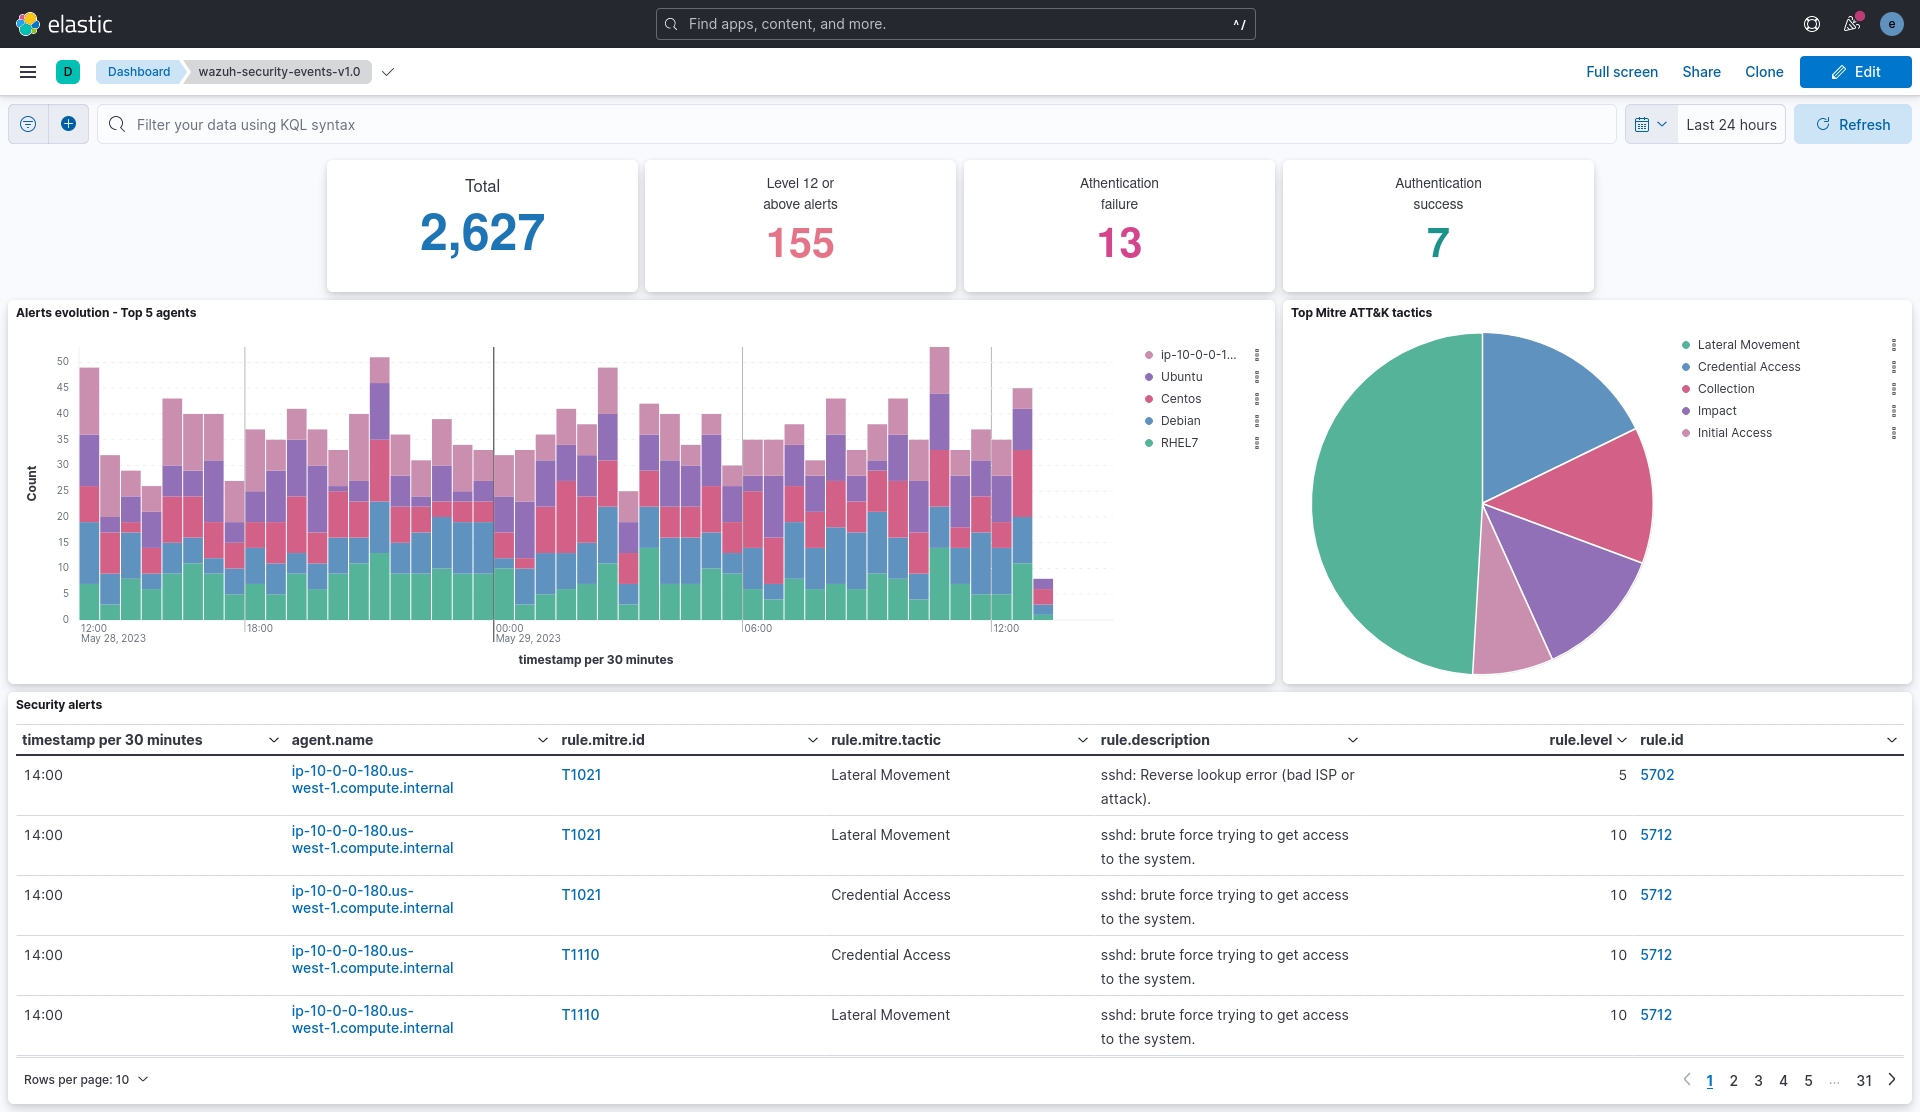
Importing these dashboards defines the index pattern name wazuh-alerts-*. The index pattern name is necessary for creating index names and receiving the alerts. We recommend using wazuh-alerts-4.x-%{+YYYY.MM.dd}.
Follow the next steps to import the Wazuh dashboards for Elastic.
Run the command below to download the Wazuh dashboard file for Elastic.
If you are accessing the Elastic dashboard (Kibana) from a Linux or macOS system:
# wget https://packages.wazuh.com/integrations/elastic/4.x-8.x/dashboards/wz-es-4.x-8.x-dashboards.ndjson
If you are accessing the Elastic dashboard (Kibana) from a Windows system, run the following command in Powershell:
# Invoke-WebRequest -Uri "https://packages.wazuh.com/integrations/elastic/4.x-8.x/dashboards/wz-es-4.x-8.x-dashboards.ndjson" -OutFile "allDashboards.ndjson"
Navigate to Management > Stack management in Kibana.
Click on Saved Objects and click Import.
Click on the Import icon, browse your files, and select the dashboard file.
Click the Import button to start importing.
To find the imported dashboards, select Analytics > Dashboard.