Wazuh indexer indices
An index is a collection of documents that relate to each other. The Wazuh indexer uses indices to store and organize security data for fast retrieval. Wazuh uses the following index patterns to store this data:
wazuh‑alerts-* - This is the index pattern for alerts generated by the Wazuh server.
wazuh‑archives-* - This is the index pattern for all events sent to the Wazuh server.
wazuh‑monitoring-* - This is the index pattern for the status of the Wazuh agents.
wazuh‑statistics-* - This is the index pattern that shows the performance metrics of the Wazuh server. It contains information that shows how many events are received, processed and dropped by the Wazuh server.
wazuh-states-vulnerabilities-* - This is the index pattern for information about vulnerabilities detected in the endpoints being monitored.
wazuh-states-inventory-hardware-* - This is the index pattern for basic information about hardware components on a monitored endpoint.
wazuh-states-inventory-hotfixes-* - This is the index pattern for updates installed on a Windows endpoint. The Wazuh vulnerability detection module uses this to discover what vulnerabilities have been patched on a Windows endpoint.
wazuh-states-inventory-interfaces-* - This is the index pattern for
upanddownstatus information, and packet transfer information about network interfaces on a monitored endpoint.wazuh-states-inventory-networks-* - This is the index pattern for IPv4 and IPv6 addresses associated with each network interface on a monitored endpoint.
wazuh-states-inventory-packages-* - This is the index pattern for currently installed software packages on an endpoint.
wazuh-states-inventory-ports-* - This is the index pattern for open network ports on a monitored endpoint.
wazuh-states-inventory-processes-* - This is the index pattern for system processes running on a monitored endpoint.
wazuh-states-inventory-protocols-* - This is the index pattern for network routing configuration details and protocols for each network interface on a monitored endpoint.
wazuh-states-inventory-system-* - This is the index pattern for information on the operating system, hostname, and architecture on a monitored endpoint.
wazuh-states-inventory-browser-extensions-* - This is the index pattern for information about browser extensions on a monitored endpoint.
wazuh-states-inventory-services-* - This is the index pattern for information about system services on a monitored endpoint.
wazuh-states-inventory-groups-* - This is the index pattern for information about user groups on a monitored endpoint.
wazuh-states-inventory-users-* - This is the index pattern for information about user accounts on a monitored endpoint.
You can create a custom index pattern or modify the default index patterns.
Creating custom index pattern
This section describes how to create a custom index pattern, for example, my-custom-alerts-*, alongside the default pattern, wazuh-alerts-*. Switch to the root user and perform the steps below.
Stop the Filebeat service:
# systemctl stop filebeat
Download the Wazuh template and save it into a file (for example,
template.json):# curl -so template.json https://raw.githubusercontent.com/wazuh/wazuh/v4.14.6/extensions/elasticsearch/7.x/wazuh-template.json
Open the template file and locate this line at the beginning of the file:
"index_patterns": [
  "wazuh-alerts-4.x-*",
  "wazuh-archives-4.x-*"
],
Add your custom pattern to look like this:
"index_patterns": [
  "wazuh-alerts-4.x-*",
  "wazuh-archives-4.x-*",
  "my-custom-alerts-*"
],
The asterisk character (
*) on the index patterns is important because Filebeat will create indices using a name that follows this pattern, which is necessary to apply the proper format to visualize the alerts on the Wazuh dashboard.Save the modifications and insert the new template into the Wazuh indexer. This will replace the existing template:
# curl -XPUT -k -u <INDEXER_USERNAME>:<INDEXER_PASSWORD> 'https://<INDEXER_IP_ADDRESS>:9200/_template/wazuh' -H 'Content-Type: application/json' -d @template.json
Replace:
<INDEXER_IP_ADDRESS>with the IP address of your Wazuh indexer<INDEXER_USERNAME>and<INDEXER_PASSWORD>with the Wazuh indexer username and password. You can obtain the Wazuh indexer credentials for fresh deployments using the command:Note
If using the Wazuh OVA, use the default credentials
admin:adminor refer to the password management section.# tar -axf wazuh-install-files.tar wazuh-install-files/wazuh-passwords.txt -O | grep -P "\'admin\'" -A 1
{"acknowledged":true}Note
{"acknowledged":true}indicates that the template was inserted correctly.Note
Perform step 5 only if you want to replace the default alert index pattern
wazuh-alerts-*and/or the default archive index patternwazuh‑archives-*withmy-custom-alerts-*.Open the Wazuh alerts configuration file
/usr/share/filebeat/module/wazuh/alerts/manifest.ymland optionally the archives file/usr/share/filebeat/module/wazuh/archives/manifest.ymland replace the index name.For example, from:
- name: index_prefix
  default: wazuh-alerts-
To this:
- name: index_prefix
  default: my-custom-alerts-
Note
The index name must not contain the characters
#,\,/,*,?,",<,>,|,,, and must not start with_,-, or+. Also, all the letters must be lowercase.(Optional) If you want to use the new index pattern by default, open the
/usr/share/wazuh-dashboard/data/wazuh/config/wazuh.ymlfile and add the below configuration:pattern: my-custom-alerts-*
This will make the Wazuh server automatically create and/or select the new index pattern.
Restart Filebeat and the Wazuh server components:
# systemctl restart filebeat
# systemctl restart wazuh-manager
# systemctl restart wazuh-indexer
# systemctl restart wazuh-dashboard
Note
If you already have indices created with the previous name, they won't be changed. You can still change to the previous index pattern to see them, or you can perform reindexing to rename the existing indices.
Checking indices information
You can check for information about Wazuh indices in two ways.
Using the web user interface.
Making a request to the Wazuh indexer API.
Using the web user interface
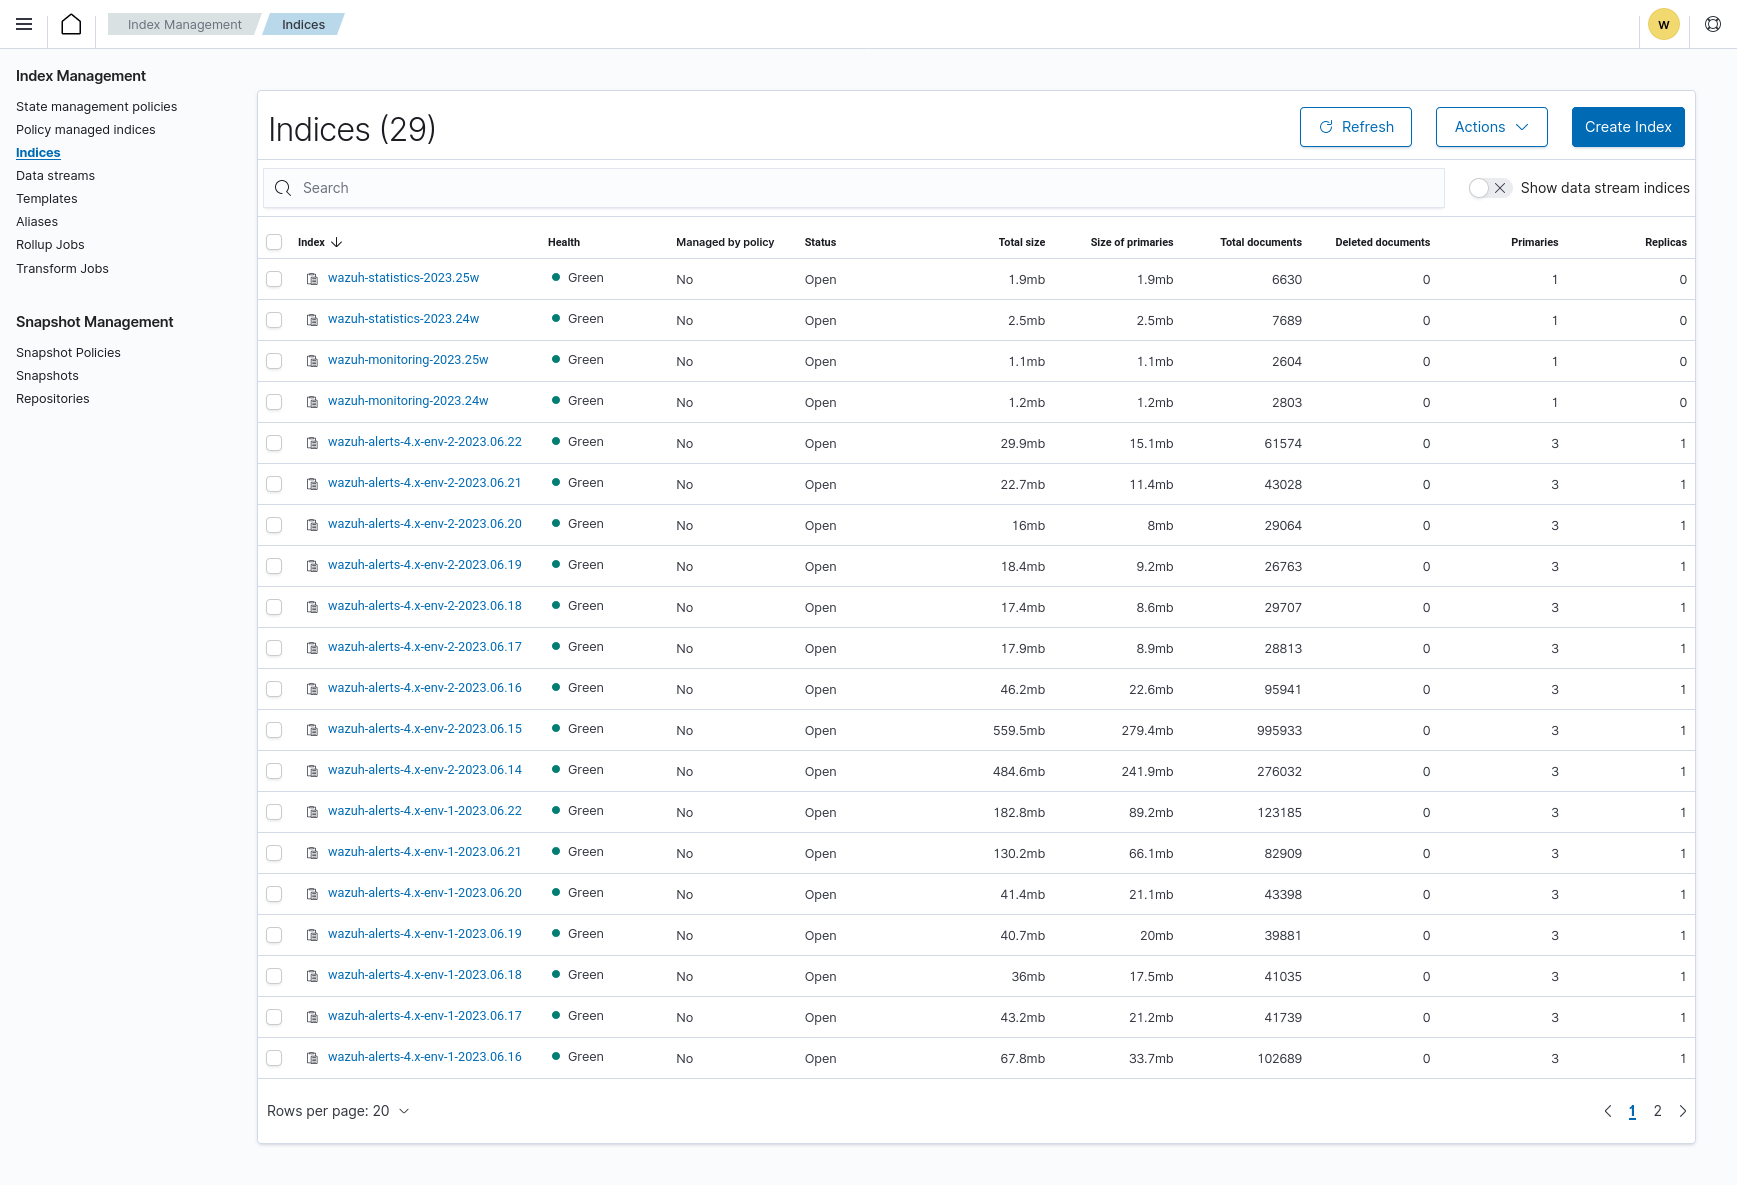
In the Wazuh dashboard upper left menu ☰, go to Indexer management > Index Management.
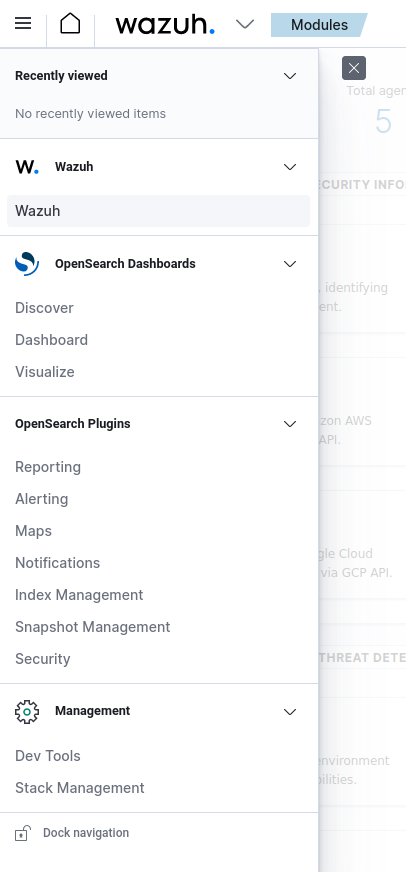
Click on Indices.
If the pattern is not present in the Wazuh dashboard, create a new one using the index pattern used in the template
my-custom-alerts-*, and make sure to usetimestampas the Time Filter field name.
Using the Wazuh indexer API
You can query the indices information using the Wazuh indexer API from the Wazuh dashboard or the Wazuh server.
Wazuh dashboard
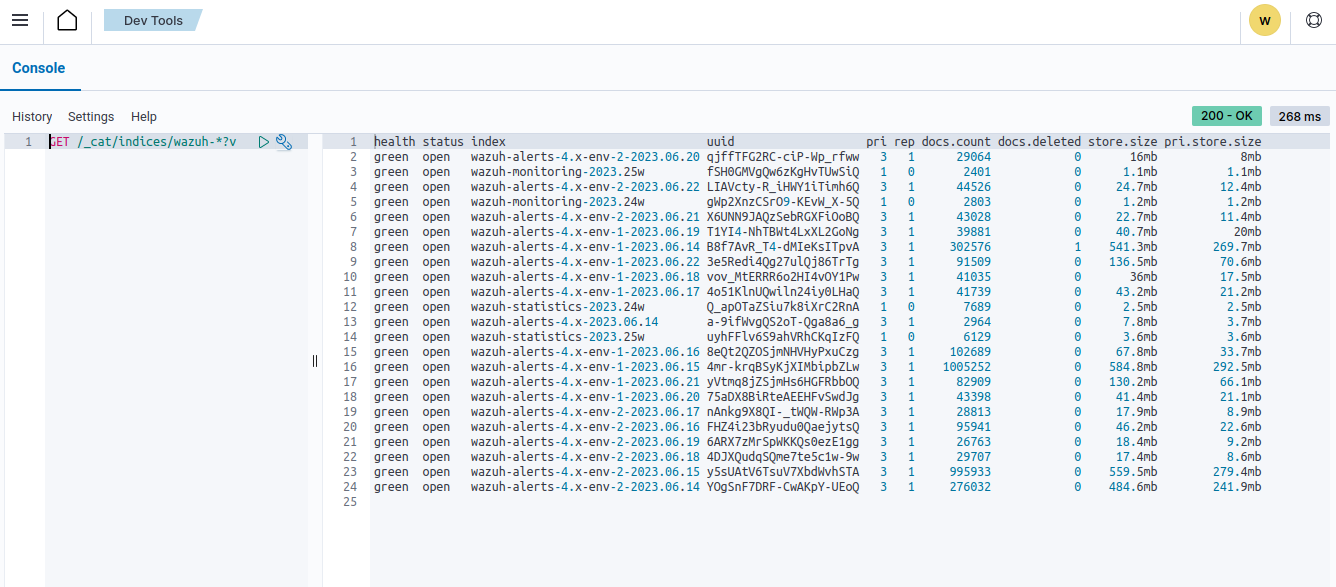
Navigate to ☰ > Indexer management > Dev Tools:
GET /_cat/indices/wazuh-*?v
Command line interface
Obtain the Wazuh indexer username and password for fresh deployments using the below command:
# tar -axf wazuh-install-files.tar wazuh-install-files/wazuh-passwords.txt -O | grep -P "\'admin\'" -A 1
Note
If using the Wazuh OVA, use the default credentials admin:admin or refer to the password management section.
Run the following command to query your index status. Replace
<INDEXER_USERNAME>and<INDEXER_PASSWORD>with the username and password obtained. Replace<INDEXER_IP_ADDRESS>with your Wazuh indexer IP address or FQDN. You can replacewazuh-*with a more specific pattern for your query, such aswazuh-alerts-*.# curl -k -u <INDEXER_USERNAME>:<INDEXER_PASSWORD> https://<INDEXER_IP_ADDRESS>:9200/_cat/indices/wazuh-*?v
health status index                       uuid                   pri rep docs.count docs.deleted store.size pri.store.size
green  open   wazuh-statistics-2023.30w   xtHZtGqBR0WNJWbs5sjrnQ   1   0       2394            0      1.2mb          1.2mb
green  open   wazuh-alerts-4.x-2023.07.28 VbBfAasJTsiqw3lwRhY5sg   3   0        513            0      1.9mb          1.9mb
green  open   wazuh-alerts-4.x-2023.07.27 7s2x8INqRVmtz5uqMDuA7Q   3   0        515            0        2mb            2mb
green  open   wazuh-alerts-4.x-2023.07.05 0h4cyLJoQYiMvMnqyLDnag   3   0         49            0    370.4kb        370.4kb
green  open   wazuh-alerts-4.x-2023.07.07 kp_N4c7RRuOE91KkuqPuAw   3   0         98            0    397.7kb        397.7kb
green  open   wazuh-alerts-4.x-2023.07.29 rbAC4befS7epxOjiSzFRQQ   3   0       1717            0      3.9mb          3.9mb
green  open   wazuh-monitoring-2023.31w   1WwxsGQHRfG1_DOIZD-Lag   1   0        954            0    771.9kb        771.9kb
green  open   wazuh-alerts-4.x-2023.07.20 SQbaQC24SgO9eWO_AsBI_w   3   0       1181            0      2.8mb          2.8mb
green  open   wazuh-statistics-2023.28w   jO52bS6eRamtB2YNmfGzIA   1   0        676            0    501.1kb        501.1kb
The wazuh‑alerts-* indices
The Wazuh server analyzes events received from monitored endpoints and generates alerts when the events match a detection rule. These alerts are saved using the wazuh-alerts-* indices.
The Wazuh server logs the alert data into the /var/ossec/logs/alerts/alerts.json and /var/ossec/logs/alerts/alerts.log files by default. Once saved in the /var/ossec/logs/alerts/alerts.json file, it forwards the JSON alert document to the Wazuh indexer API for indexing. The indexed files are stored in the /var/lib/wazuh-indexer/nodes/0/indices directory of the Wazuh indexer.
When forwarding alerts to the Wazuh indexer, the Wazuh server formats the current date into an index name. For example, the Wazuh server will define the index names wazuh-alerts-4.x-2023.03.17 and wazuh-alerts-4.x-2023.03.18 for March 17th and 18th alerts, respectively. The Wazuh indexer then creates alert indices using the defined wazuh‑alerts-* index names.
You can modify the default index name in the /usr/share/filebeat/module/wazuh/alerts/ingest/pipeline.json file of the Wazuh server. To do this, navigate to the date_index_name field and date_rounding key to change the default index name formatting in the /usr/share/filebeat/module/wazuh/alerts/ingest/pipeline.json file:
{
  "description": "Wazuh alerts pipeline",
  "processors": [
     { "json" : { "field" : "message", "add_to_root": true } },
     {
     "geoip": {
     "field": "data.srcip",
     "target_field": "GeoLocation",
     "properties": ["city_name", "country_name", "region_name", "location"],
     "ignore_missing": true,
     "ignore_failure": true
     }
     },
     {
     "geoip": {
     "field": "data.win.eventdata.ipAddress",
     "target_field": "GeoLocation",
     "properties": ["city_name", "country_name", "region_name", "location"],
     "ignore_missing": true,
     "ignore_failure": true
     }
     },
     {
     "geoip": {
     "field": "data.aws.sourceIPAddress",
     "target_field": "GeoLocation",
     "properties": ["city_name", "country_name", "region_name", "location"],
     "ignore_missing": true,
     "ignore_failure": true
     }
     },
     {
     "geoip": {
     "field": "data.gcp.jsonPayload.sourceIP",
     "target_field": "GeoLocation",
     "properties": ["city_name", "country_name", "region_name", "location"],
     "ignore_missing": true,
     "ignore_failure": true
     }
     },
     {
     "geoip": {
     "field": "data.office365.ClientIP",
     "target_field": "GeoLocation",
     "properties": ["city_name", "country_name", "region_name", "location"],
     "ignore_missing": true,
     "ignore_failure": true
     }
     },
     {
     "date": {
     "field": "timestamp",
     "target_field": "@timestamp",
     "formats": ["ISO8601"],
     "ignore_failure": false
     }
     },
     {
     "date_index_name": {
     "field": "timestamp",
     "date_rounding": "d",
     "index_name_prefix": "{{fields.index_prefix}}",
     "index_name_format": "yyyy.MM.dd",
     "ignore_failure": false
     }
     },
     { "remove": { "field": "message", "ignore_missing": true, "ignore_failure": true } },
     { "remove": { "field": "ecs", "ignore_missing": true, "ignore_failure": true } },
     { "remove": { "field": "beat", "ignore_missing": true, "ignore_failure": true } },
     { "remove": { "field": "input_type", "ignore_missing": true, "ignore_failure": true } },
     { "remove": { "field": "tags", "ignore_missing": true, "ignore_failure": true } },
     { "remove": { "field": "count", "ignore_missing": true, "ignore_failure": true } },
     { "remove": { "field": "@version", "ignore_missing": true, "ignore_failure": true } },
     { "remove": { "field": "log", "ignore_missing": true, "ignore_failure": true } },
     { "remove": { "field": "offset", "ignore_missing": true, "ignore_failure": true } },
     { "remove": { "field": "type", "ignore_missing": true, "ignore_failure": true } },
     { "remove": { "field": "host", "ignore_missing": true, "ignore_failure": true } },
     { "remove": { "field": "fields", "ignore_missing": true, "ignore_failure": true } },
     { "remove": { "field": "event", "ignore_missing": true, "ignore_failure": true } },
     { "remove": { "field": "fileset", "ignore_missing": true, "ignore_failure": true } },
     { "remove": { "field": "service", "ignore_missing": true, "ignore_failure": true } }
  ],
  "on_failure" : [{
     "drop" : { }
  }]
}
Where the values:
M - stands for monthw - stands for weekd - stands for dayThe wazuh‑archives-* indices
In addition to logging alerts to the /var/ossec/logs/alerts/alerts.json and /var/ossec/logs/alerts/alerts.log files, you can enable the Wazuh archives to log and index all the events the Wazuh server receives. This includes events that are analyzed by Wazuh and events that do not trigger alerts.
Storing and indexing all events might be useful for later analysis and compliance requirements. However, you must consider that enabling logging and indexing of all events will increase the storage requirement on the Wazuh server.
By default, the Wazuh indexer creates event indices for each unique day. You can modify the default index name in the /usr/share/filebeat/module/wazuh/archives/ingest/pipeline.json file of the Wazuh server. To do this:
Navigate to the
date_index_namefield.Locate the
date_roundingkey and change the default index name formatting in the/usr/share/filebeat/module/wazuh/archives/ingest/pipeline.jsonfile.
The sections below provide details on how to enable the wazuh archives and set up the wazuh-archives-* indices.
Enabling Wazuh archives
Edit
/var/ossec/etc/ossec.confon the Wazuh server and set the<logall_json>line toyes. This enables logging to archives.json of all events. Forwarding to the Wazuh indexer requires the logging of all events in JSON format.<logall_json>yes</logall_json>
Restart the Wazuh manager to make the change effective.
# systemctl restart wazuh-manager
or
# service wazuh-manager restart
Edit
/etc/filebeat/filebeat.ymland changeenabledtotruein the archives mapping. This enables events to be forwarded to the Wazuh indexer.filebeat.modules: - module: wazuh alerts: enabled: true archives: enabled: true
Restart the Filebeat service to apply the change:
# systemctl restart filebeat
Test that the Filebeat service works properly:
# filebeat test output
elasticsearch: https://127.0.0.1:9200...
  parse url... OK
  connection...
    parse host... OK
    dns lookup... OK
    addresses: 127.0.0.1
    dial up... OK
  TLS...
    security: server's certificate chain verification is enabled
    handshake... OK
    TLS version: TLSv1.2
    dial up... OK
  talk to server... OK
  version: 7.10.2
Defining the index pattern
In the Wazuh dashboard upper left menu ☰, go to Dashboard management > Dashboard Management and click Index Patterns.
Click on Create index pattern.
Set
wazuh-archives-*as the Index pattern name. This defines the index pattern to match the events being forwarded and indexed. Click on Next step.Select timestamp for the Time field.
Note
Be careful to choose timestamp instead of @timestamp.
Click on Create index pattern.
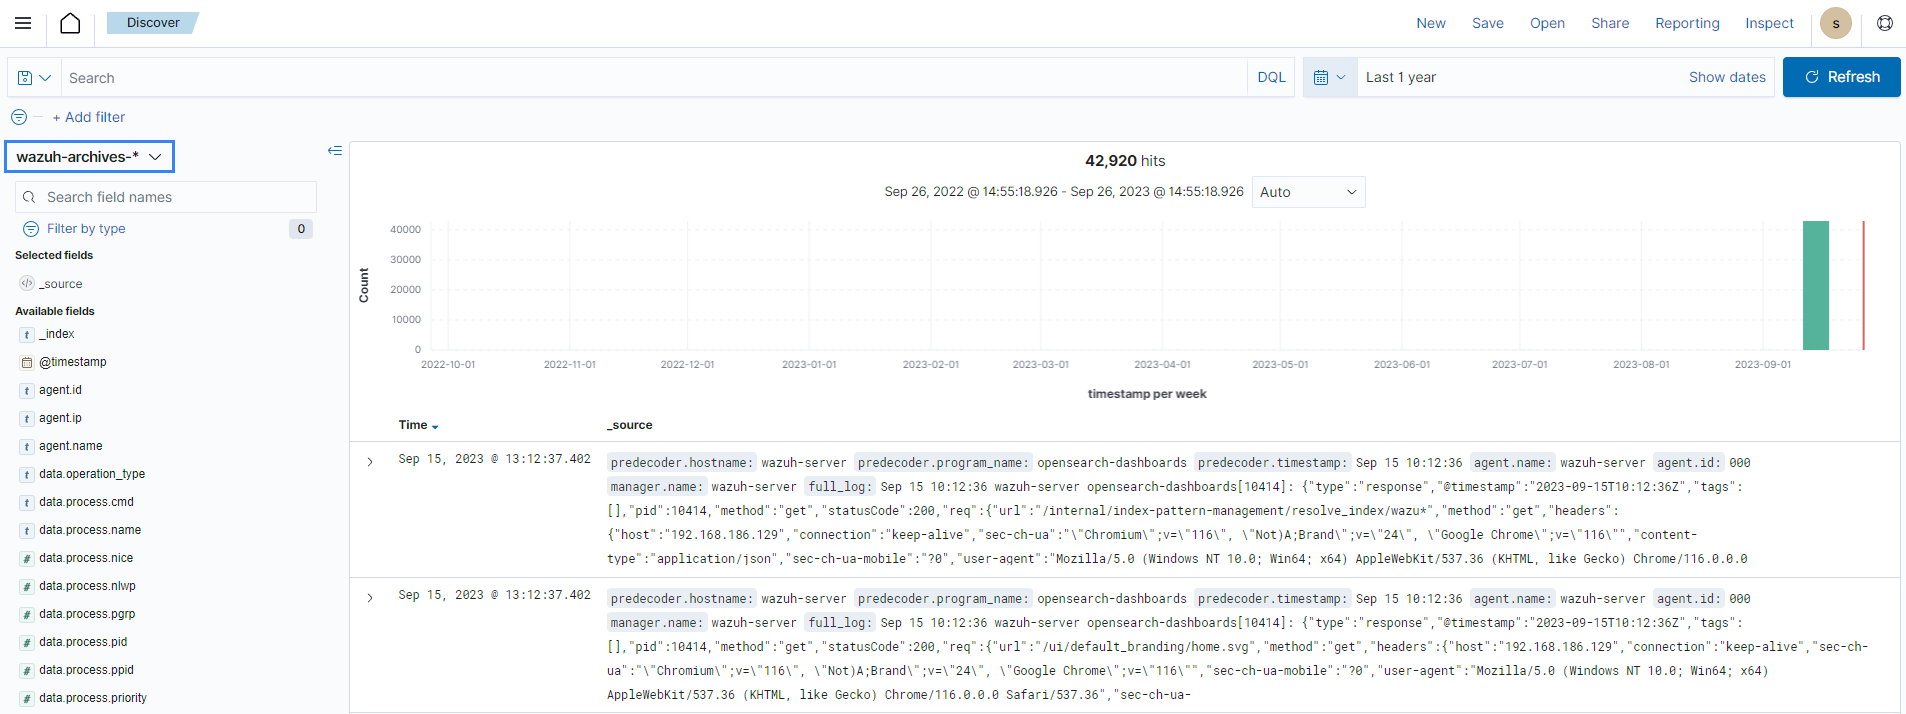
Viewing the index pattern
Click Explore on the upper left menu ☰, and then click Discover.
Select wazuh-archives-* to view the events.
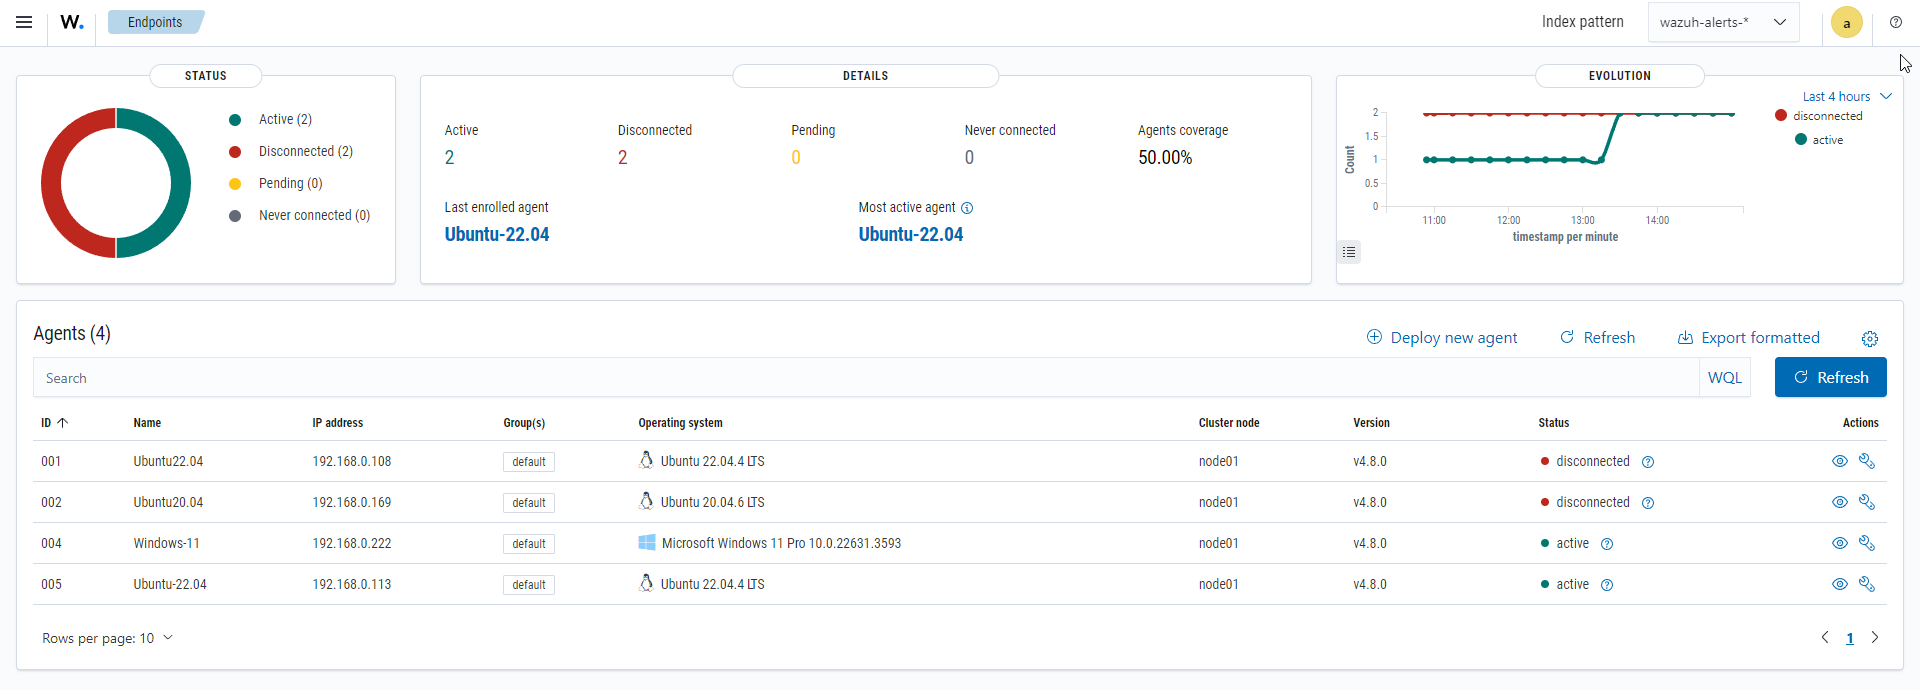
The wazuh-monitoring-* indices
The connection status of an enrolled Wazuh agent at any moment is one of the following:
Active
Disconnected
Pending
Never connected
Wazuh stores a history of the connection status of all its agents. By default, it indexes the agent connection status using the wazuh‑monitoring-* indices. The Wazuh indexer creates one of these indices per week by default. Check the documentation on custom creation intervals. These indices store the connection status of all the agents every 15 minutes by default. Check the documentation on the frequency of API requests.
The Wazuh dashboard requires these indices to display information about agent status. For example, by clicking ☰ > Agents management > Summary, you can see information such as the Wazuh agent's connection status and historical evolution within set timeframes.
In the Wazuh dashboard configuration file, you can change the settings to do the following:
Disable inserting and showing connection status data for the agents. Change wazuh.monitoring.enabled to accomplish this.
Change the insertion frequency of connection status data for the agents. Change wazuh.monitoring.frequency to accomplish this.
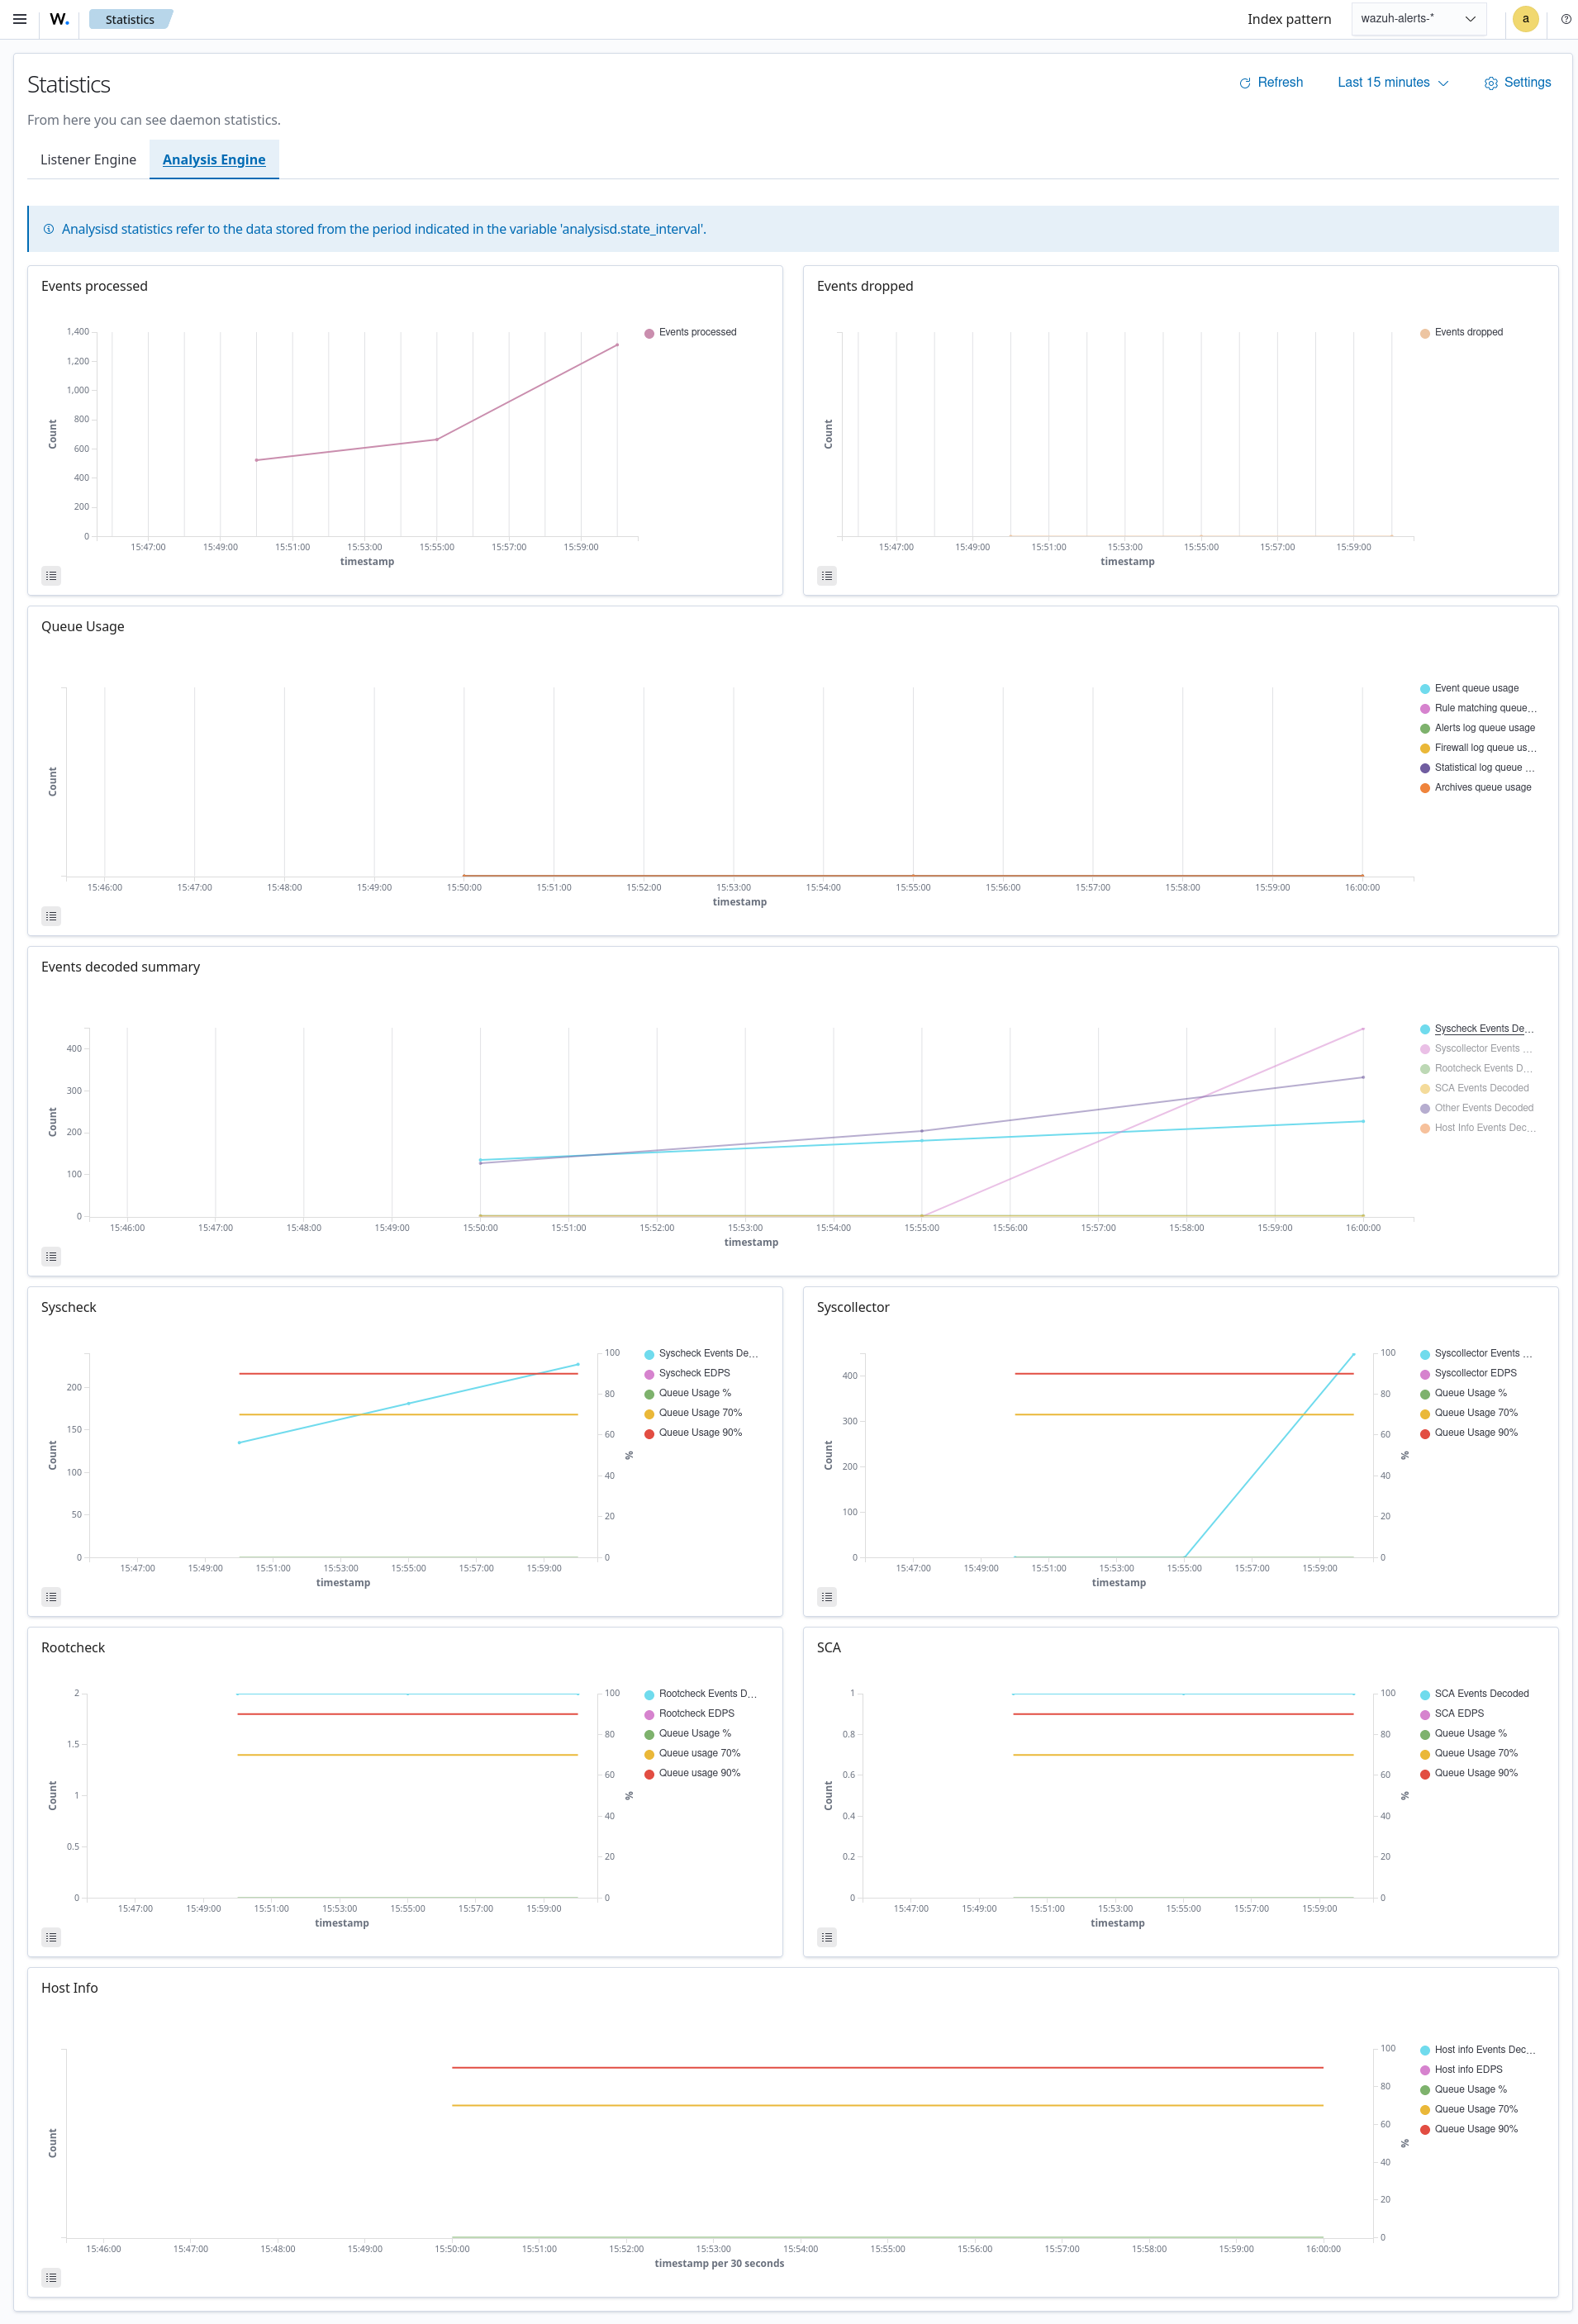
The wazuh‑statistics-* indices
The Wazuh dashboard uses the wazuh‑statistics-* indices to display statistics about the Wazuh server usage and performance. The information displayed includes the number of events decoded, bytes received, and TCP sessions.
The Wazuh dashboard runs requests to the Wazuh manager API to query usage-related information. It inserts data into the wazuh‑statistics-* indices from the information collected. The Wazuh indexer creates a wazuh‑statistics-* index per week by default. Check the documentation on the Statistics creation interval. These indices store Wazuh server statistics every 5 minutes by default. Check the documentation on the Frequency of task execution.
To visualize this information in the Wazuh dashboard, go to Server management > Statistics.
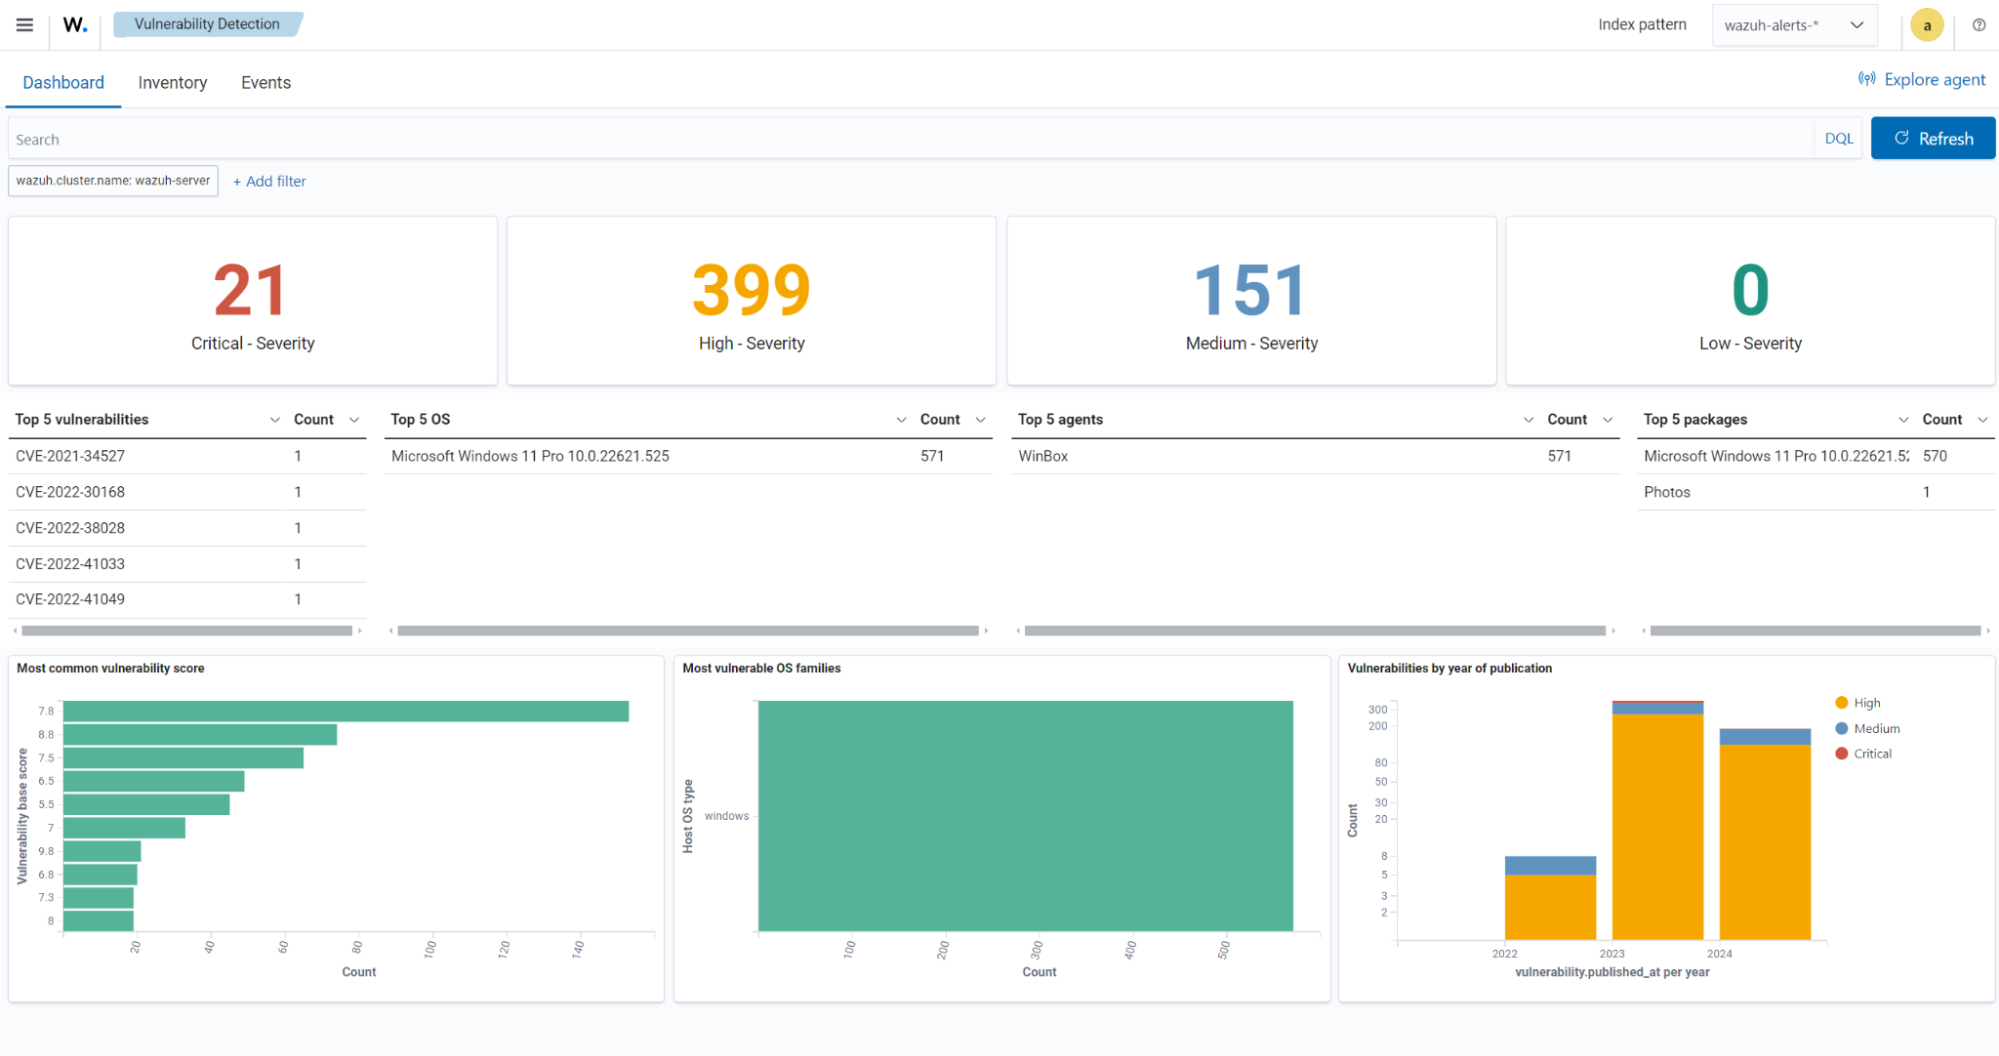
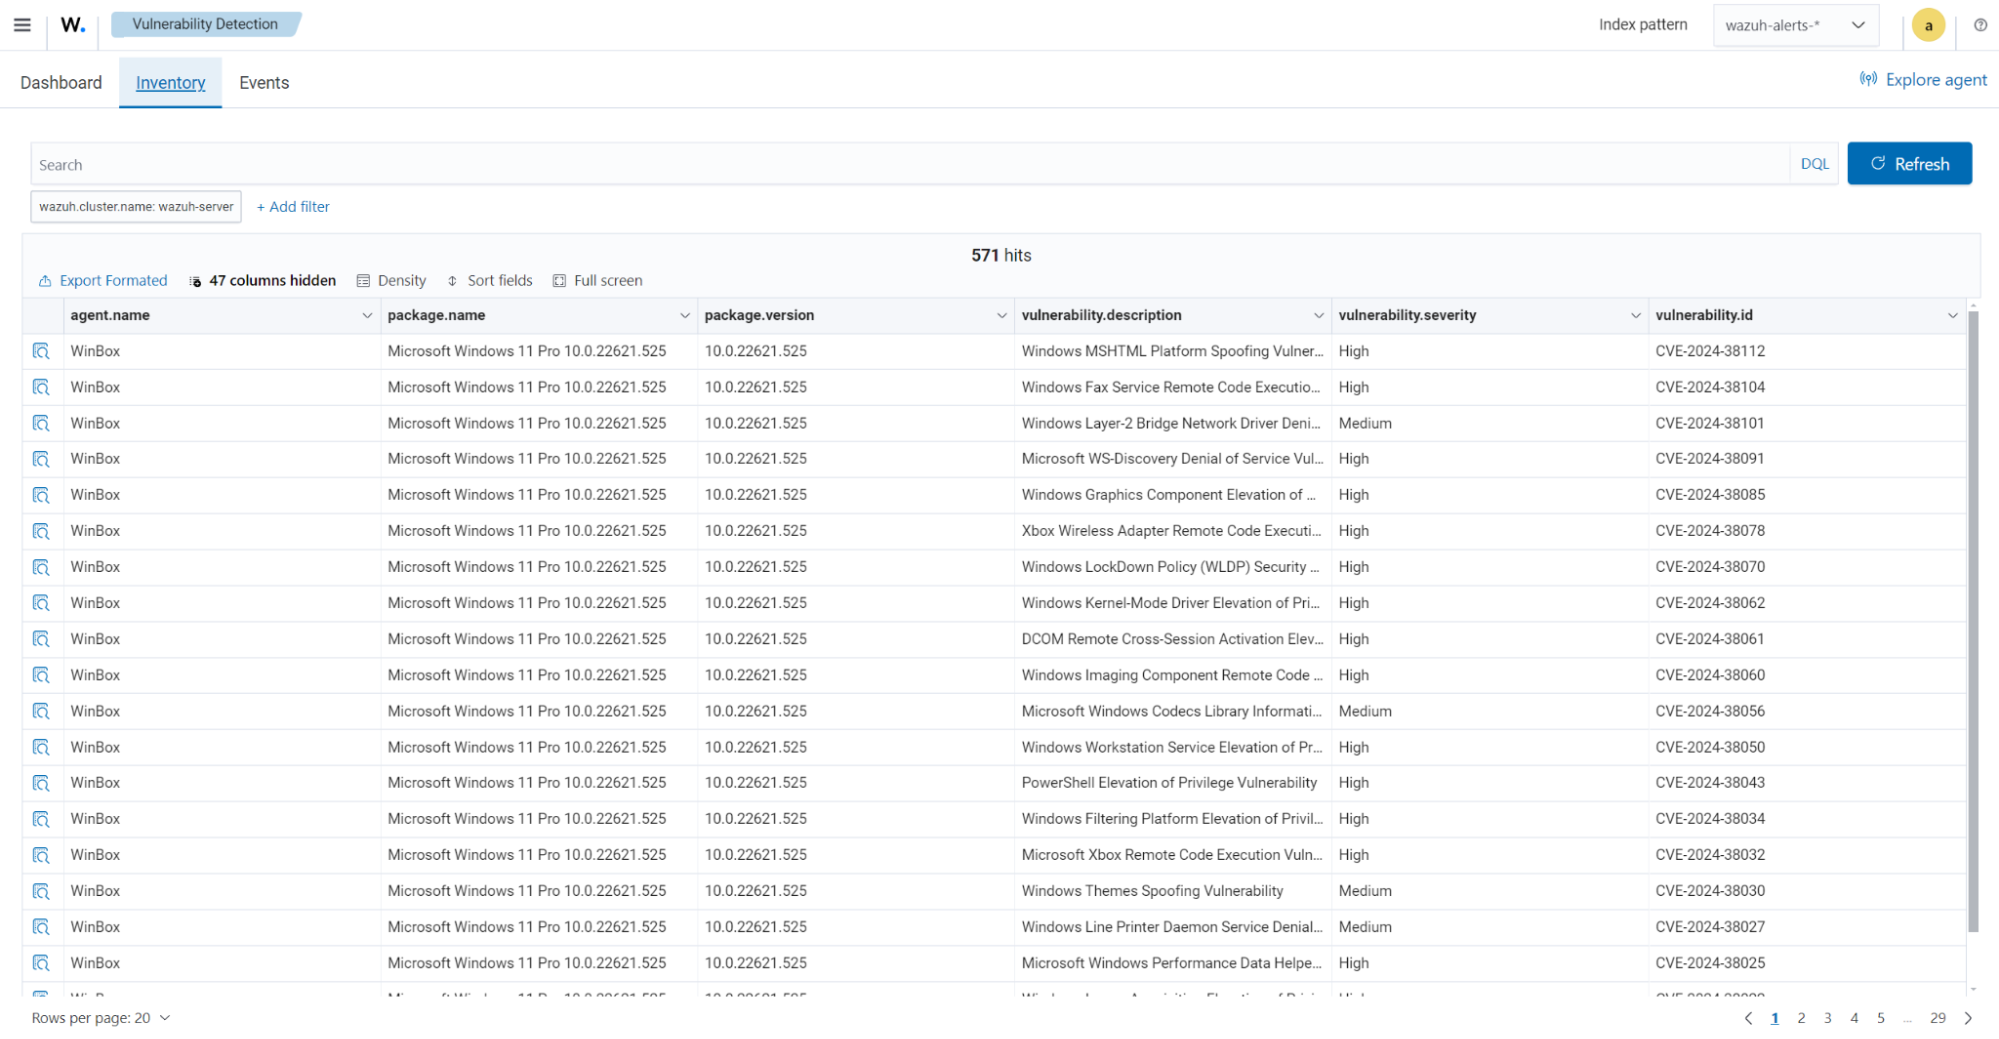
The wazuh-states-vulnerabilities-* indices
The wazuh-states-vulnerabilities-* index is used in Wazuh to store data related to the vulnerability state of monitored assets. This index typically contains information about vulnerabilities detected on monitored endpoints, including details such as the severity, status, affected software, and vulnerability reference. The * at the end of the index pattern allows for the creation of multiple indices with similar names, segmented by time or other factors. This enables efficient storage and retrieval of vulnerability data over time.
To visualize this information in the Wazuh dashboard, click on Vulnerability Detection from the Wazuh dashboard home page.
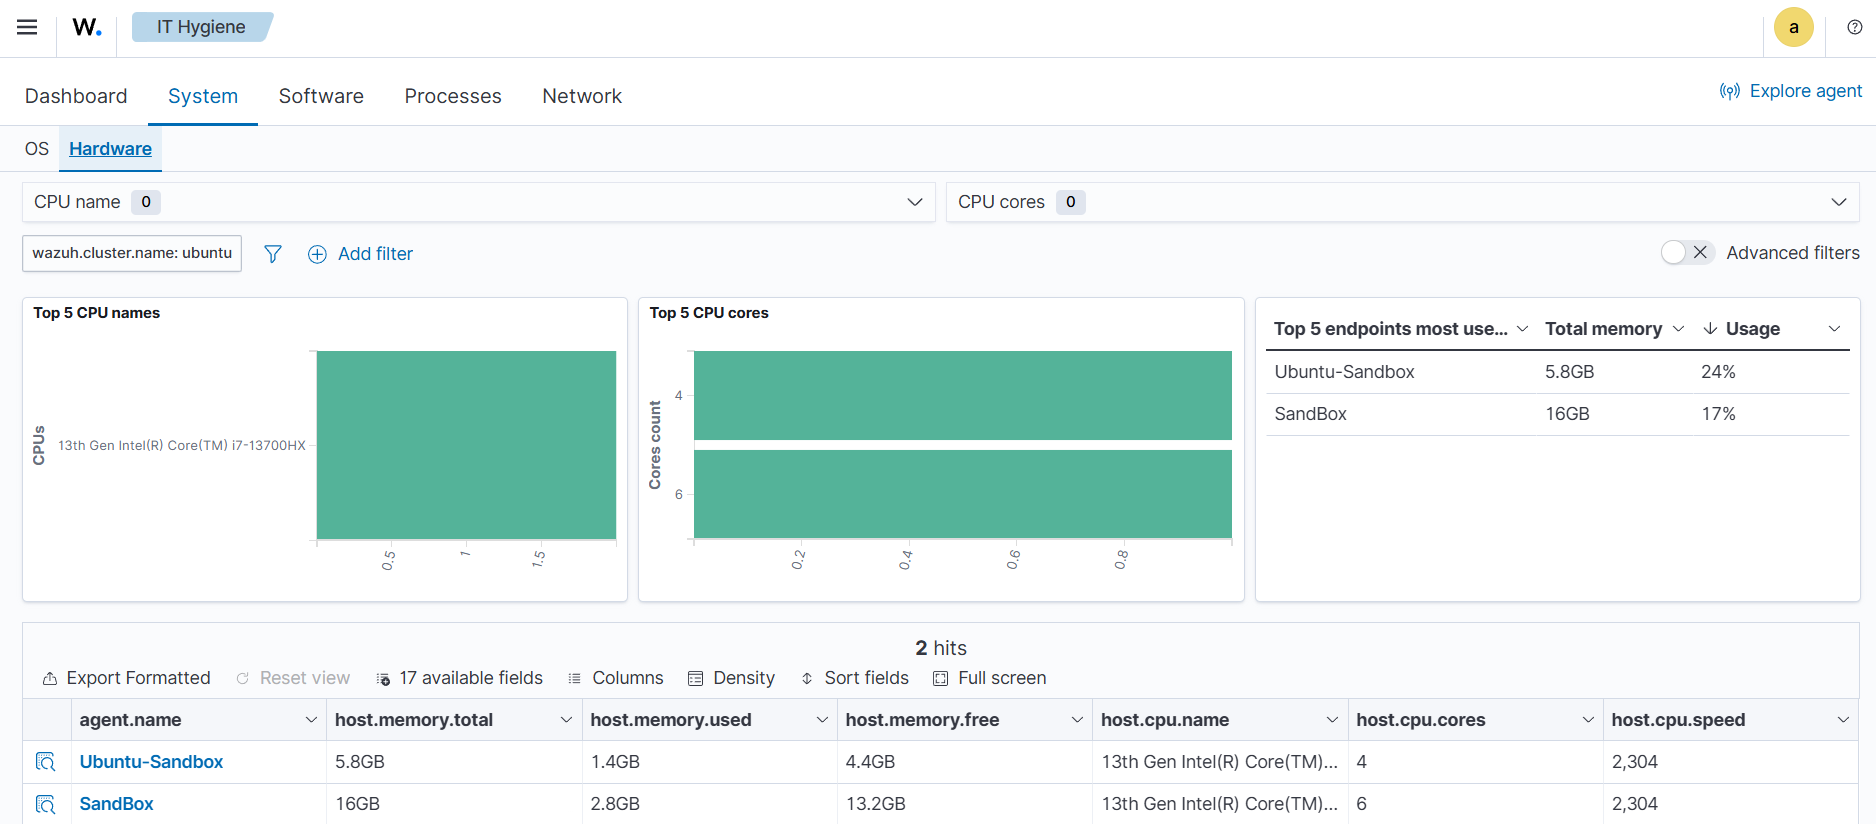
The wazuh-states-inventory-hardware-* indices
The wazuh-states-inventory-hardware-* index contains the baseline hardware inventory collected from monitored endpoints. Each document in this index represents details about the endpoint's hardware components, such as CPU and memory.
This index provides security teams and administrators with visibility into the underlying hardware of each endpoint. By tracking this information, Wazuh makes it possible to detect hardware changes, validate asset configurations, and support compliance or auditing efforts.
Since hardware details rarely change under normal circumstances, unexpected modifications captured in this index can serve as a signal for anomalies. For example, if you navigate to IT Hygiene > System > Hardware, you will see information relating to the hardware.
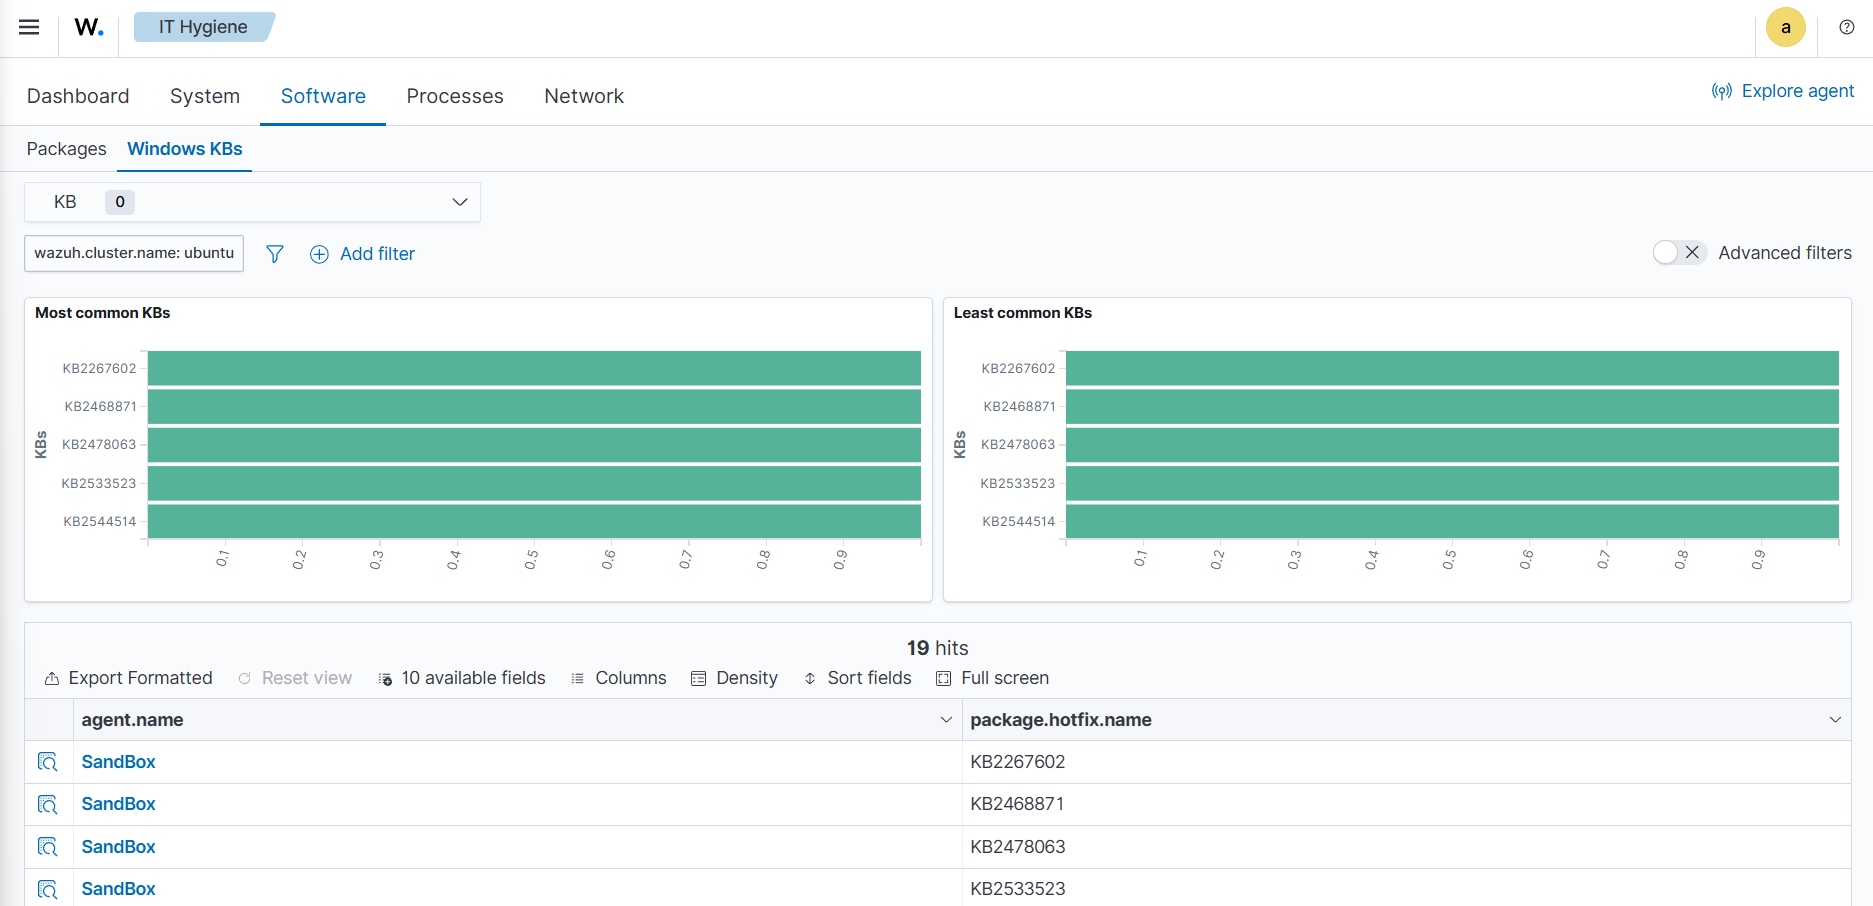
The wazuh-states-inventory-hotfixes-* indices
The wazuh-states-inventory-hotfixes-* index stores information about Windows updates (hotfixes) installed on monitored endpoints. Each entry in this index corresponds to a specific update, including details such as the hotfix identifier, description, and installation date.
This index is closely related to the Wazuh vulnerability detection module. By cross-referencing installed hotfixes with known vulnerability databases, Wazuh can determine which vulnerabilities have already been patched and which ones remain unpatched on an endpoint.
Beyond vulnerability management, this index also helps administrators to verify system update compliance, audit patch history, and ensure that critical updates are consistently applied across their environment.
To find information relating to the hotfixes on Windows endpoints, navigate to IT Hygiene > Software > Windows KBs.
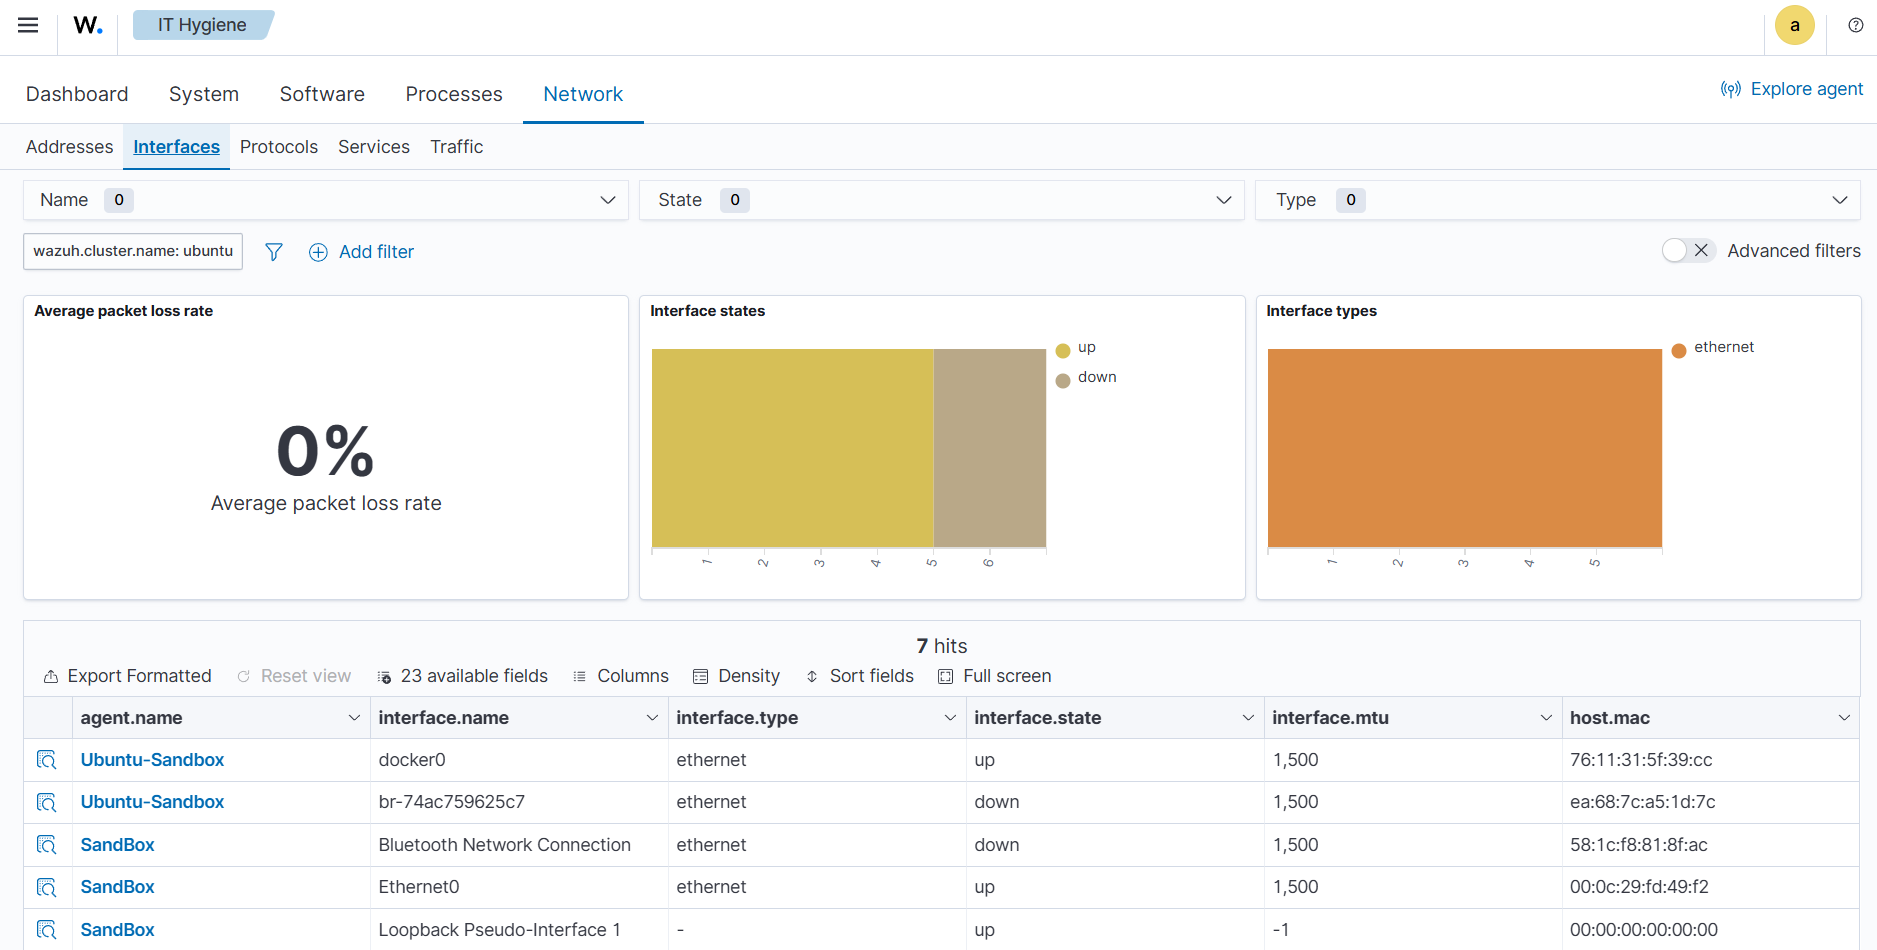
The wazuh-states-inventory-interfaces-* indices
The wazuh-states-inventory-interfaces-* index stores detailed information about the network interfaces on monitored endpoints. Each document records attributes such as interface status (up or down), MAC address, and packet transfer statistics.
This index gives administrators visibility into the networking interfaces on their systems. By tracking interface activity and configuration changes, we detect unusual behavior such as interfaces going down unexpectedly, new interfaces appearing, or abnormal packet transfer patterns.
In addition to aiding security investigations, this index is also useful for operational monitoring, capacity planning, and verifying that network configurations remain consistent with organizational standards.
To find information relating to an endpoint's network interface, navigate to IT Hygiene > Network > Interfaces.
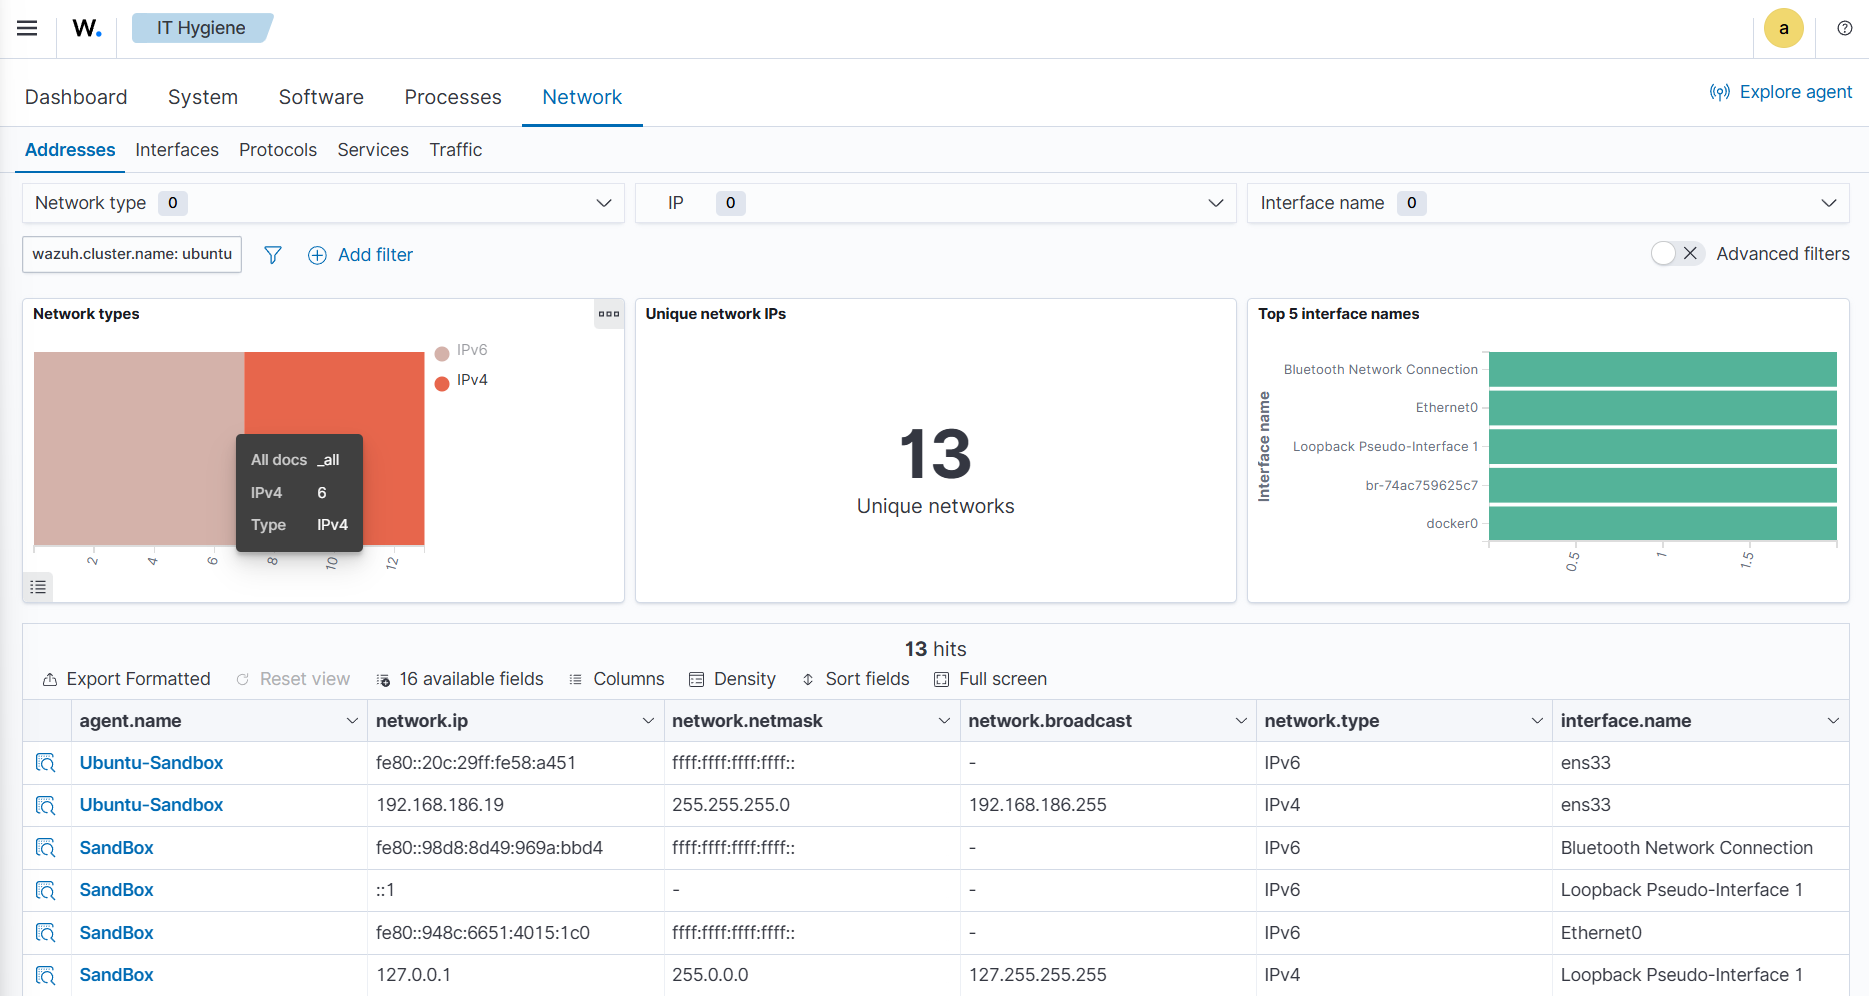
The wazuh-states-inventory-networks-* indices
The wazuh-states-inventory-networks-* index contains information about the IPv4 and IPv6 addresses assigned to network interfaces on monitored endpoints. Each record shows details on the interface to IP address mapping, enabling visibility into how an endpoint is connected to the network.
This index is valuable for tracking changes in network configurations, such as new IP addresses being assigned and old ones being removed. Such changes can indicate legitimate reconfiguration, but they may also point to misconfigurations or suspicious activity.
By maintaining this inventory, Wazuh helps administrators validate network settings, support compliance requirements, and investigate security incidents where IP address history and assignments are needed.
To find information relating to an endpoint's IP address assignment, navigate to IT Hygiene > Network > Addresses.
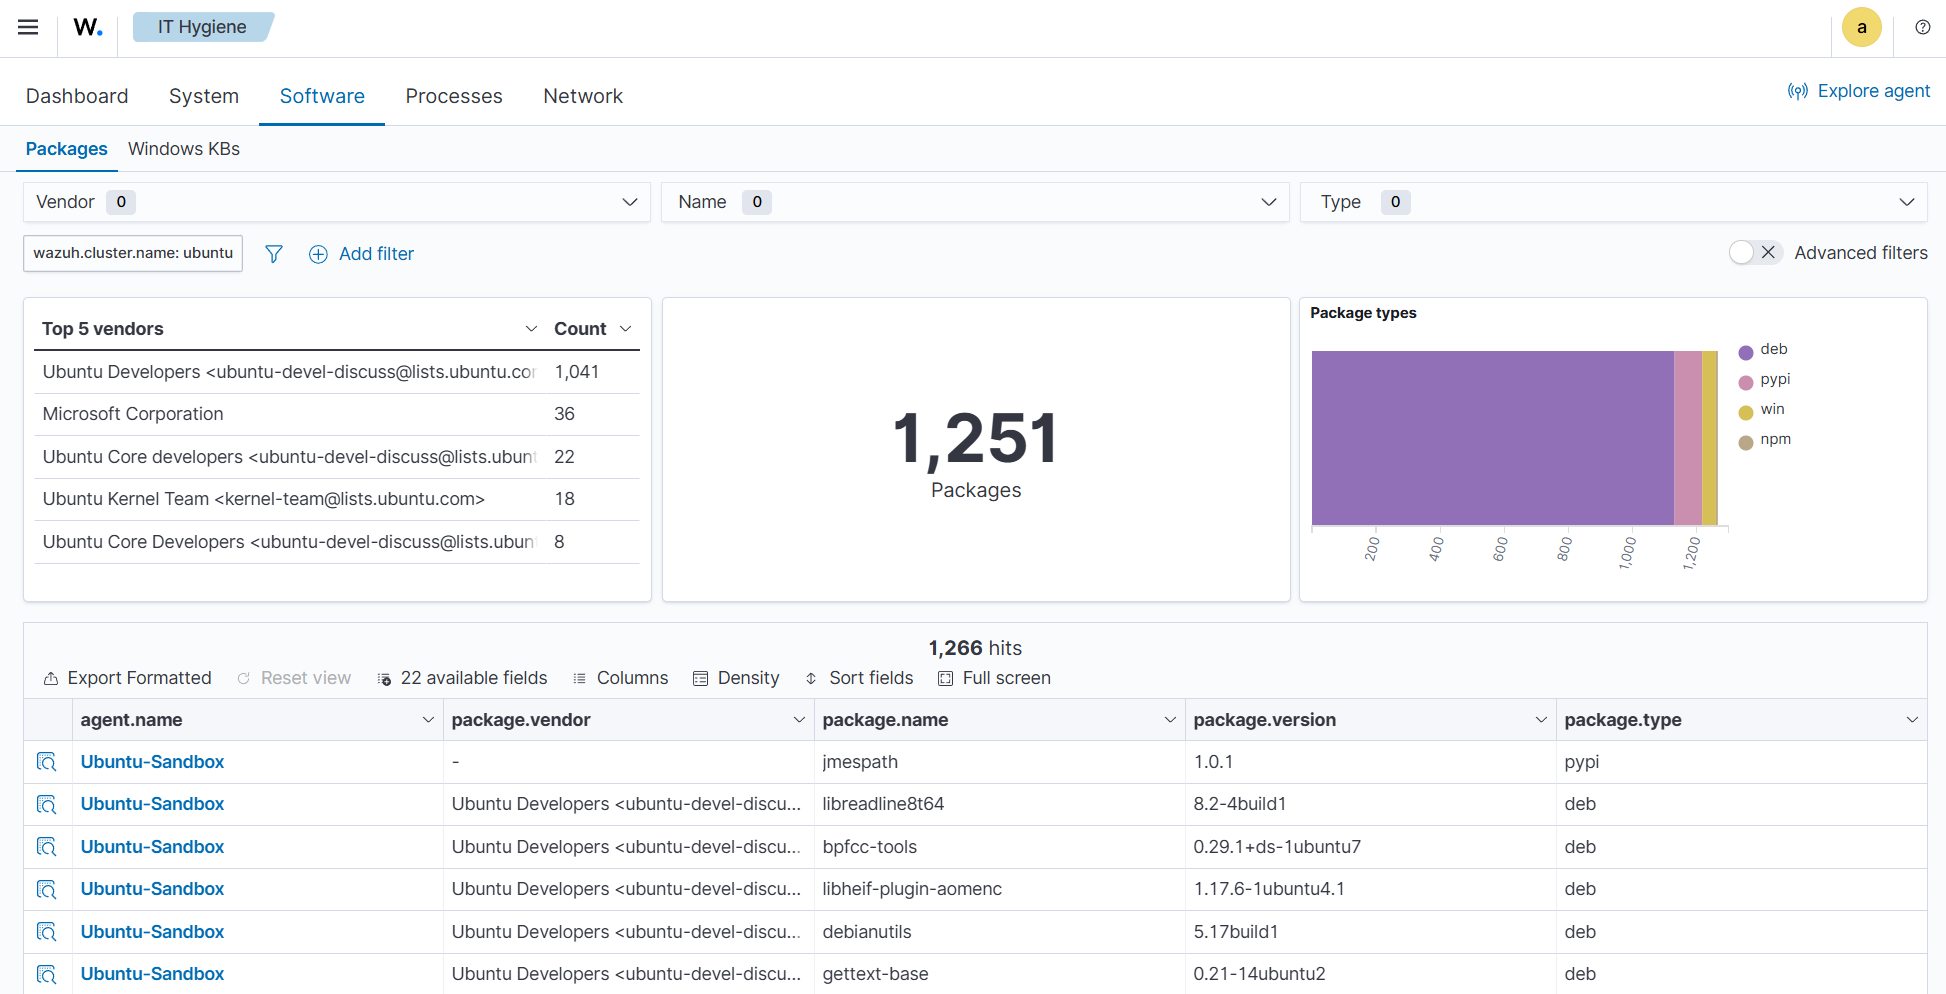
The wazuh-states-inventory-packages-* indices
The wazuh-states-inventory-packages-* index stores information about the software packages currently installed on monitored endpoints. Each record details a package and includes details such as the package name, version, and vendor.
This index provides the foundation for software inventory management within Wazuh. It also enables administrators to track changes in the software stack, verify compliance with organizational policies, and spot the presence of unauthorized or outdated applications.
This index is a critical component of Wazuh vulnerability detection, which cross-references package versions with known vulnerabilities to identify endpoints that may be exposed. In this way, the index not only aids asset management but also plays a direct role in improving security posture.
To find information relating to an endpoint's software packages, navigate to IT Hygiene > Software > Packages.
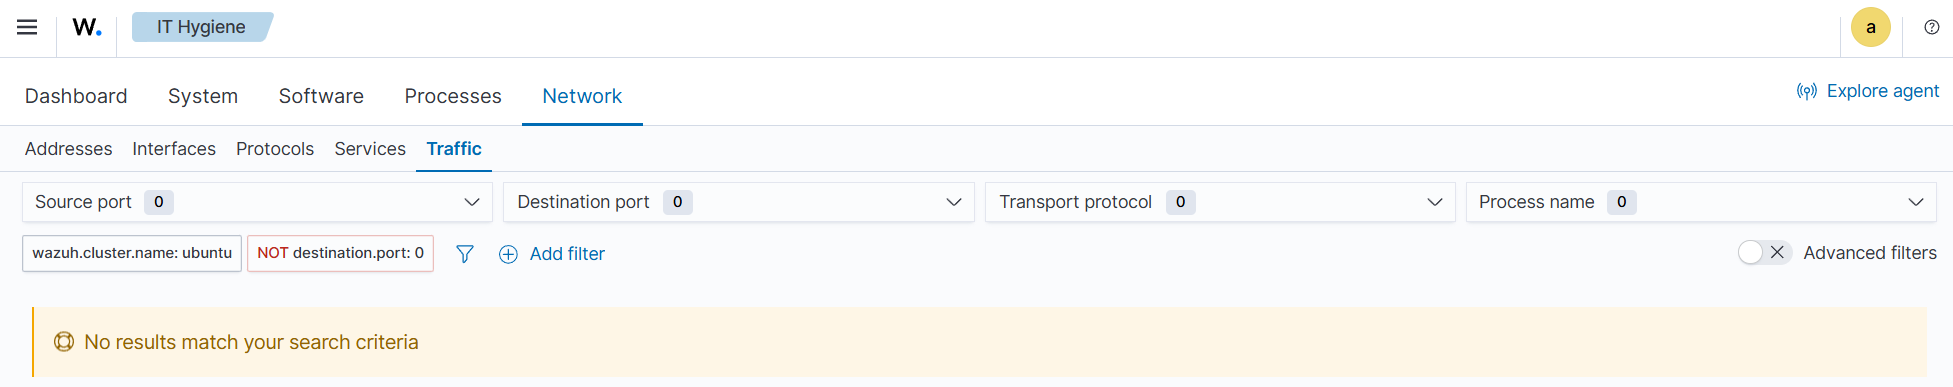
The wazuh-states-inventory-ports-* indices
The wazuh-states-inventory-ports-* index records the open network ports detected on monitored endpoints. It includes details such as port numbers, associated services, and listening states.
By maintaining visibility into exposed ports, this index helps administrators identify unauthorized services, track changes in system exposure, and reduce the attack surface. Unsanctioned open ports can be an early sign of compromise or misconfiguration, making this data essential for both security monitoring and compliance audits.
To find information relating to ports on a monitored endpoint, navigate to IT Hygiene > Network > Traffic.
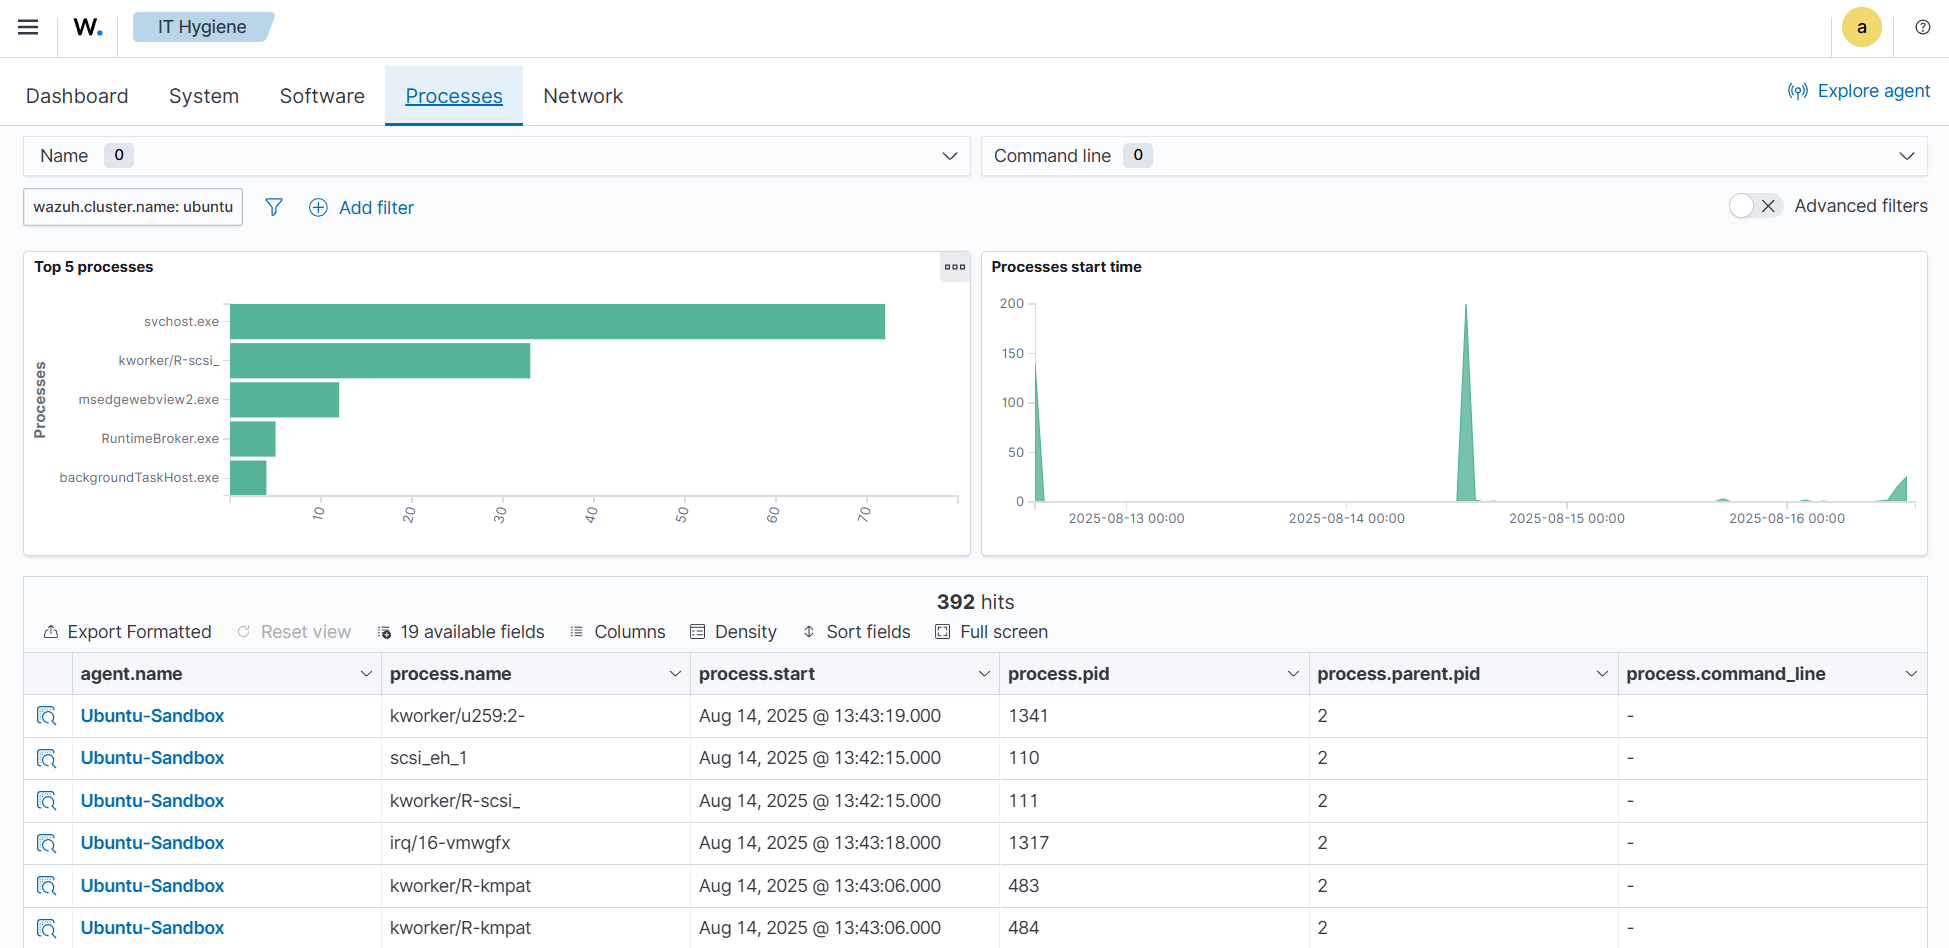
The wazuh-states-inventory-processes-* indices
The wazuh-states-inventory-processes-* index contains information about the processes running on monitored endpoints. Each entry describes attributes like process name, PID (process ID), and an associated user.
Tracking running processes allows Wazuh to detect suspicious or unauthorized software execution. This visibility is crucial for spotting malware, persistence mechanisms, or rogue processes that may evade traditional defenses. It also provides administrators with a historical reference for system activity, supporting forensic investigations.
To find information relating to processes on a monitored endpoint, navigate to IT Hygiene > Processes.
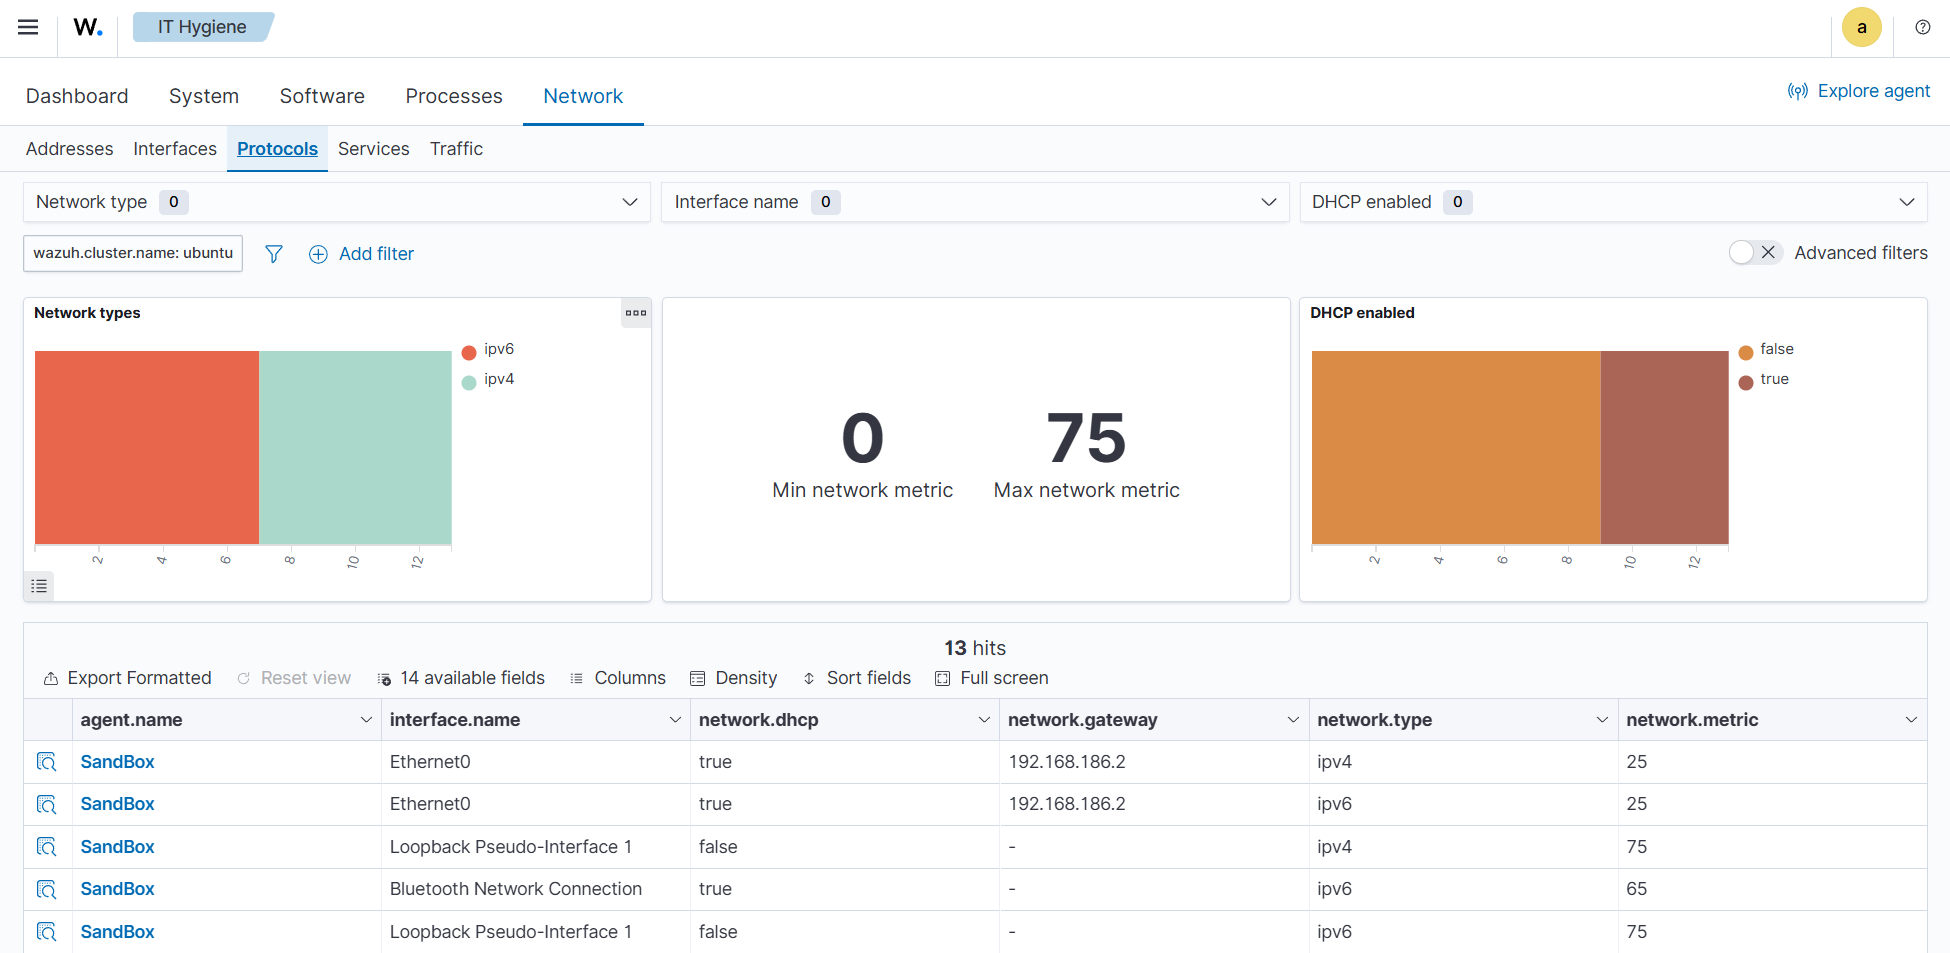
The wazuh-states-inventory-protocols-* indices
The wazuh-states-inventory-protocols-* index stores details about the network routing configuration and supported protocols for each network interface on monitored endpoints. This includes protocol types, routing tables, and interface associations.
Monitoring this information enables organizations to ensure network configurations align with expected baselines. Unexpected protocol changes or routing entries can indicate misconfigurations or malicious activity, such as traffic redirection or tunneling attempts.
To find information relating to protocols on a monitored endpoint, navigate to IT Hygiene > Network > Protocols.
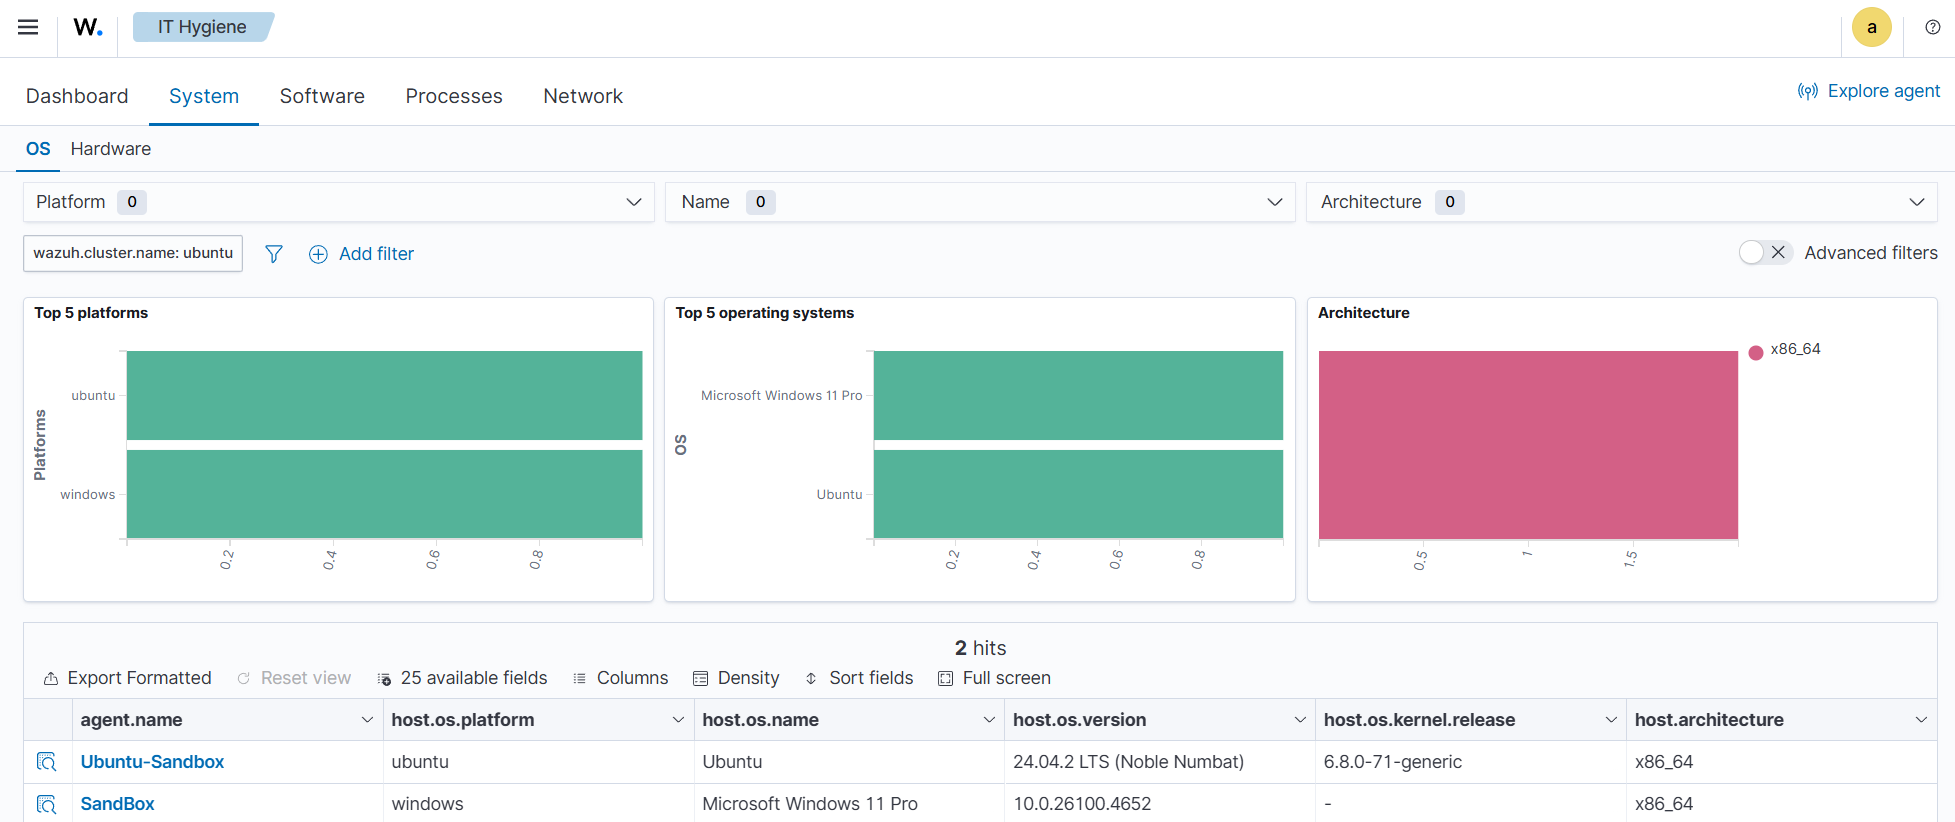
The wazuh-states-inventory-system-* indices
The wazuh-states-inventory-system-* index provides system-level details about each monitored endpoint, including the operating system, version, hostname, and architecture.
This index acts as a master record of core system attributes, supporting inventory management, compliance tracking, and security investigations. It also allows administrators to group and correlate alerts based on system name, OS type, and architecture.
To find system-level information relating to monitored endpoints, navigate to IT Hygiene > System > OS.
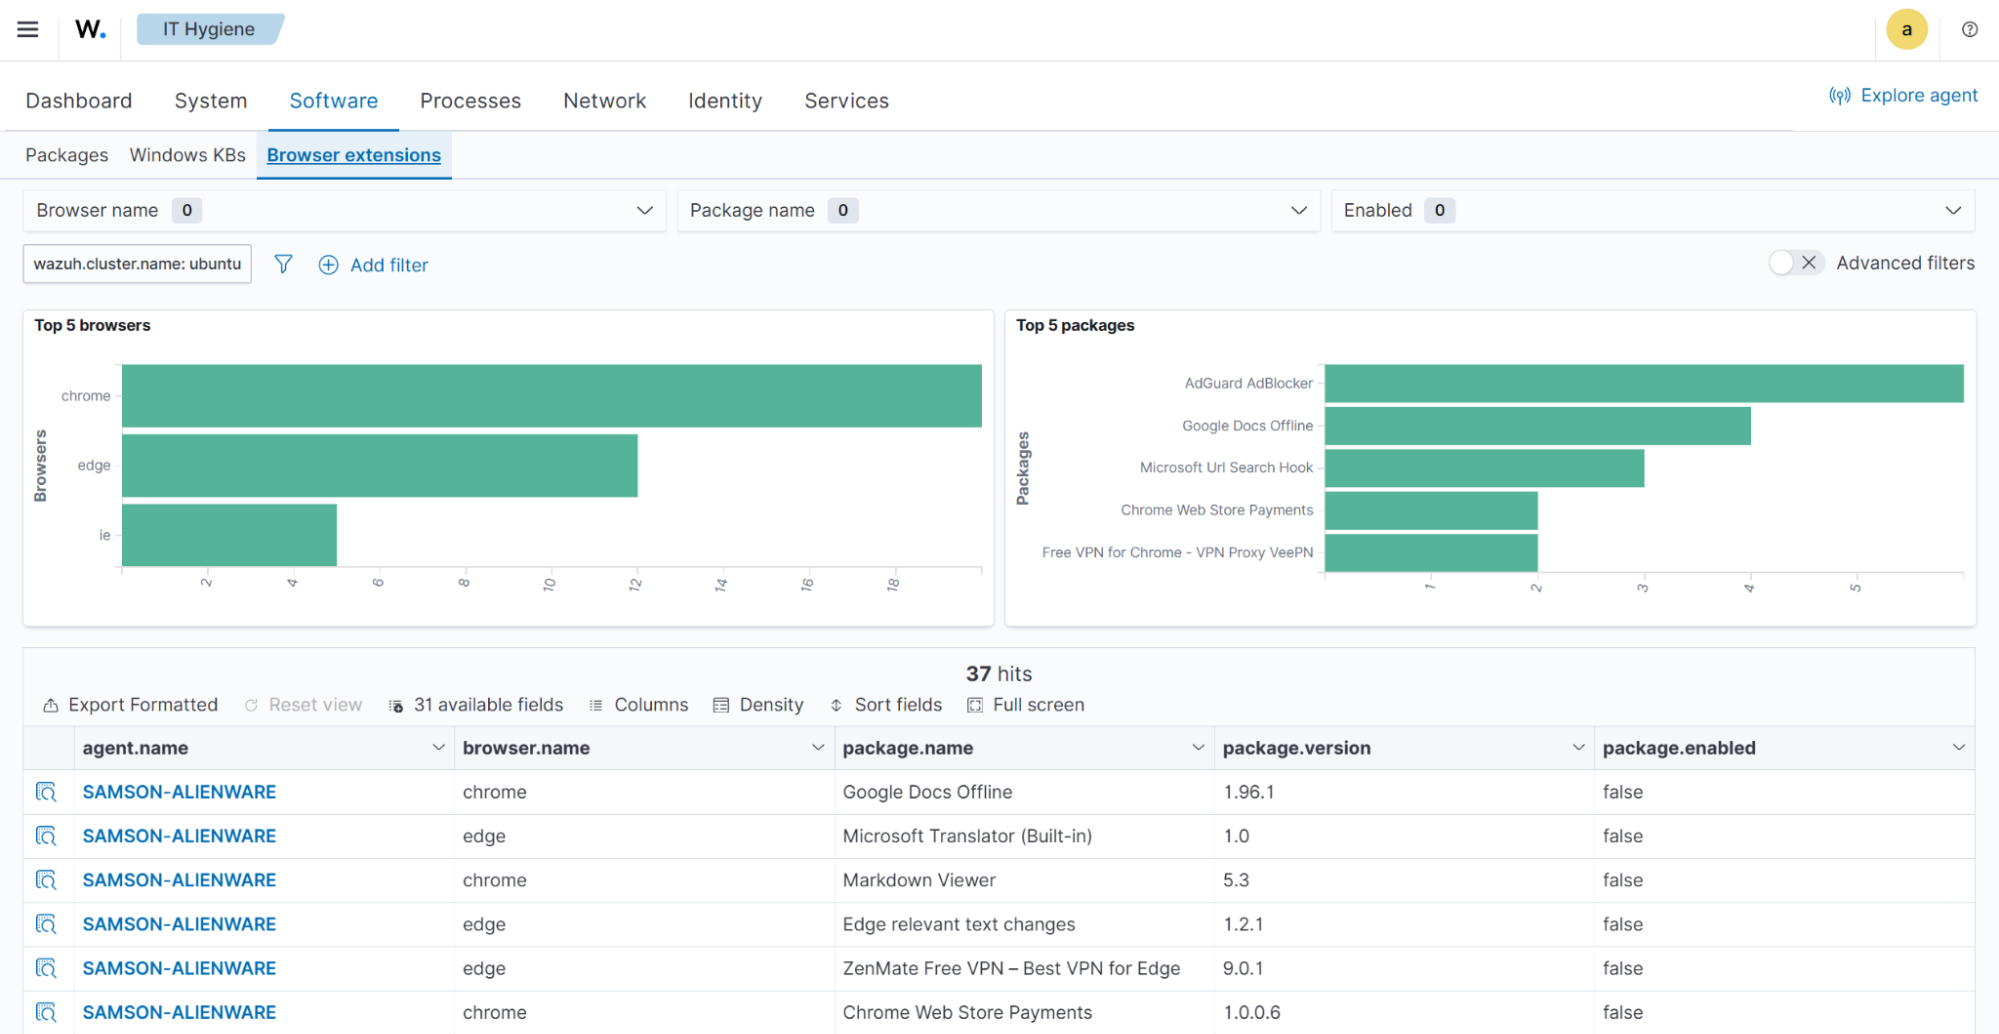
The wazuh-states-inventory-browser-extensions-* indices
The wazuh-states-inventory-browser-extensions-* indices store detailed information about browser extensions installed across monitored endpoints. It captures data such as extension name, version, browser type, and installation source.
This helps security teams identify unauthorized or vulnerable extensions, enforce browser security policies, and ensure compliance with corporate browsing standards.
To find information relating to browser extensions on a monitored endpoint, navigate to IT Hygiene > Software > Browser extensions.
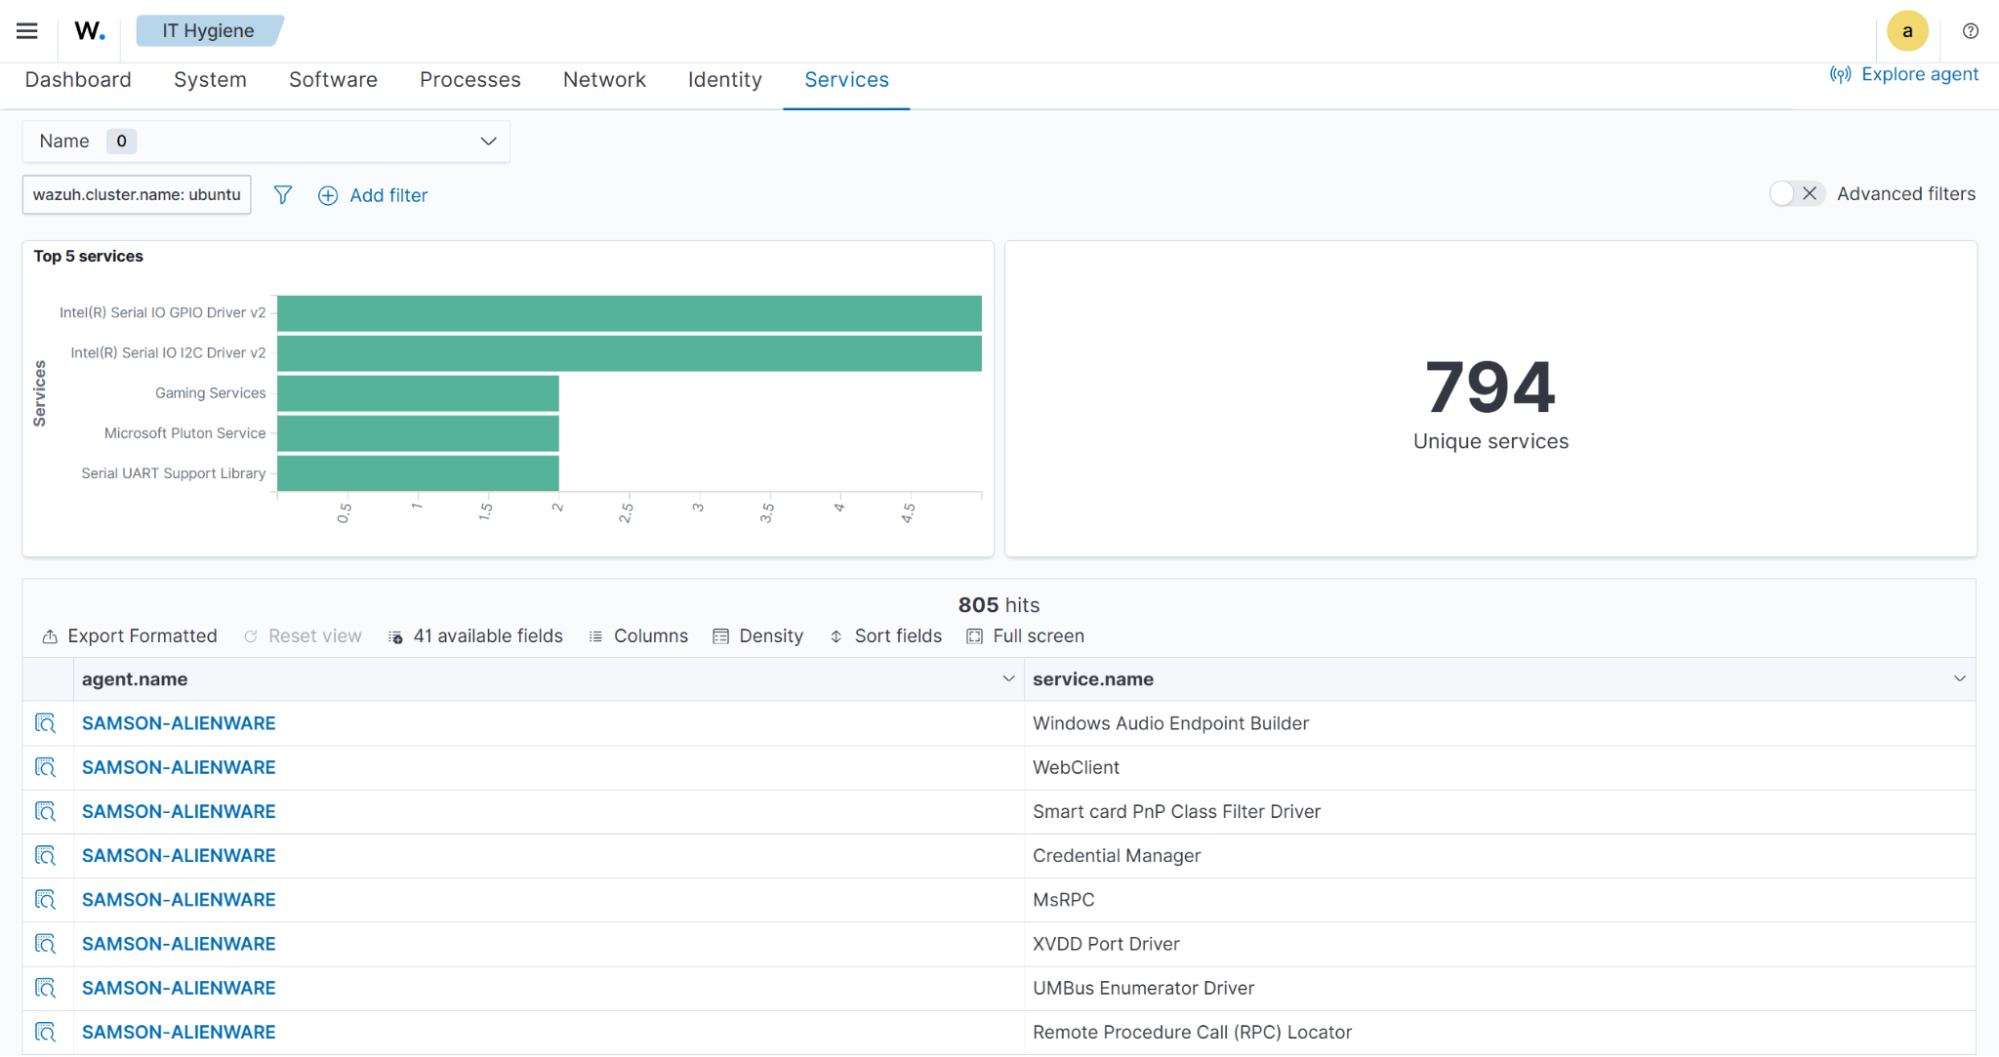
The wazuh-states-inventory-services-* indices
The wazuh-states-inventory-services-* indices records information about active and inactive system services. Each entry includes details such as service name, status, startup type, and associated executable paths.
By maintaining this inventory, administrators can monitor for unauthorized or misconfigured services, detect persistence mechanisms used by malware, and validate service configurations during audits or incident investigations.
To find information relating to services on a monitored endpoint, navigate to IT Hygiene > Services.
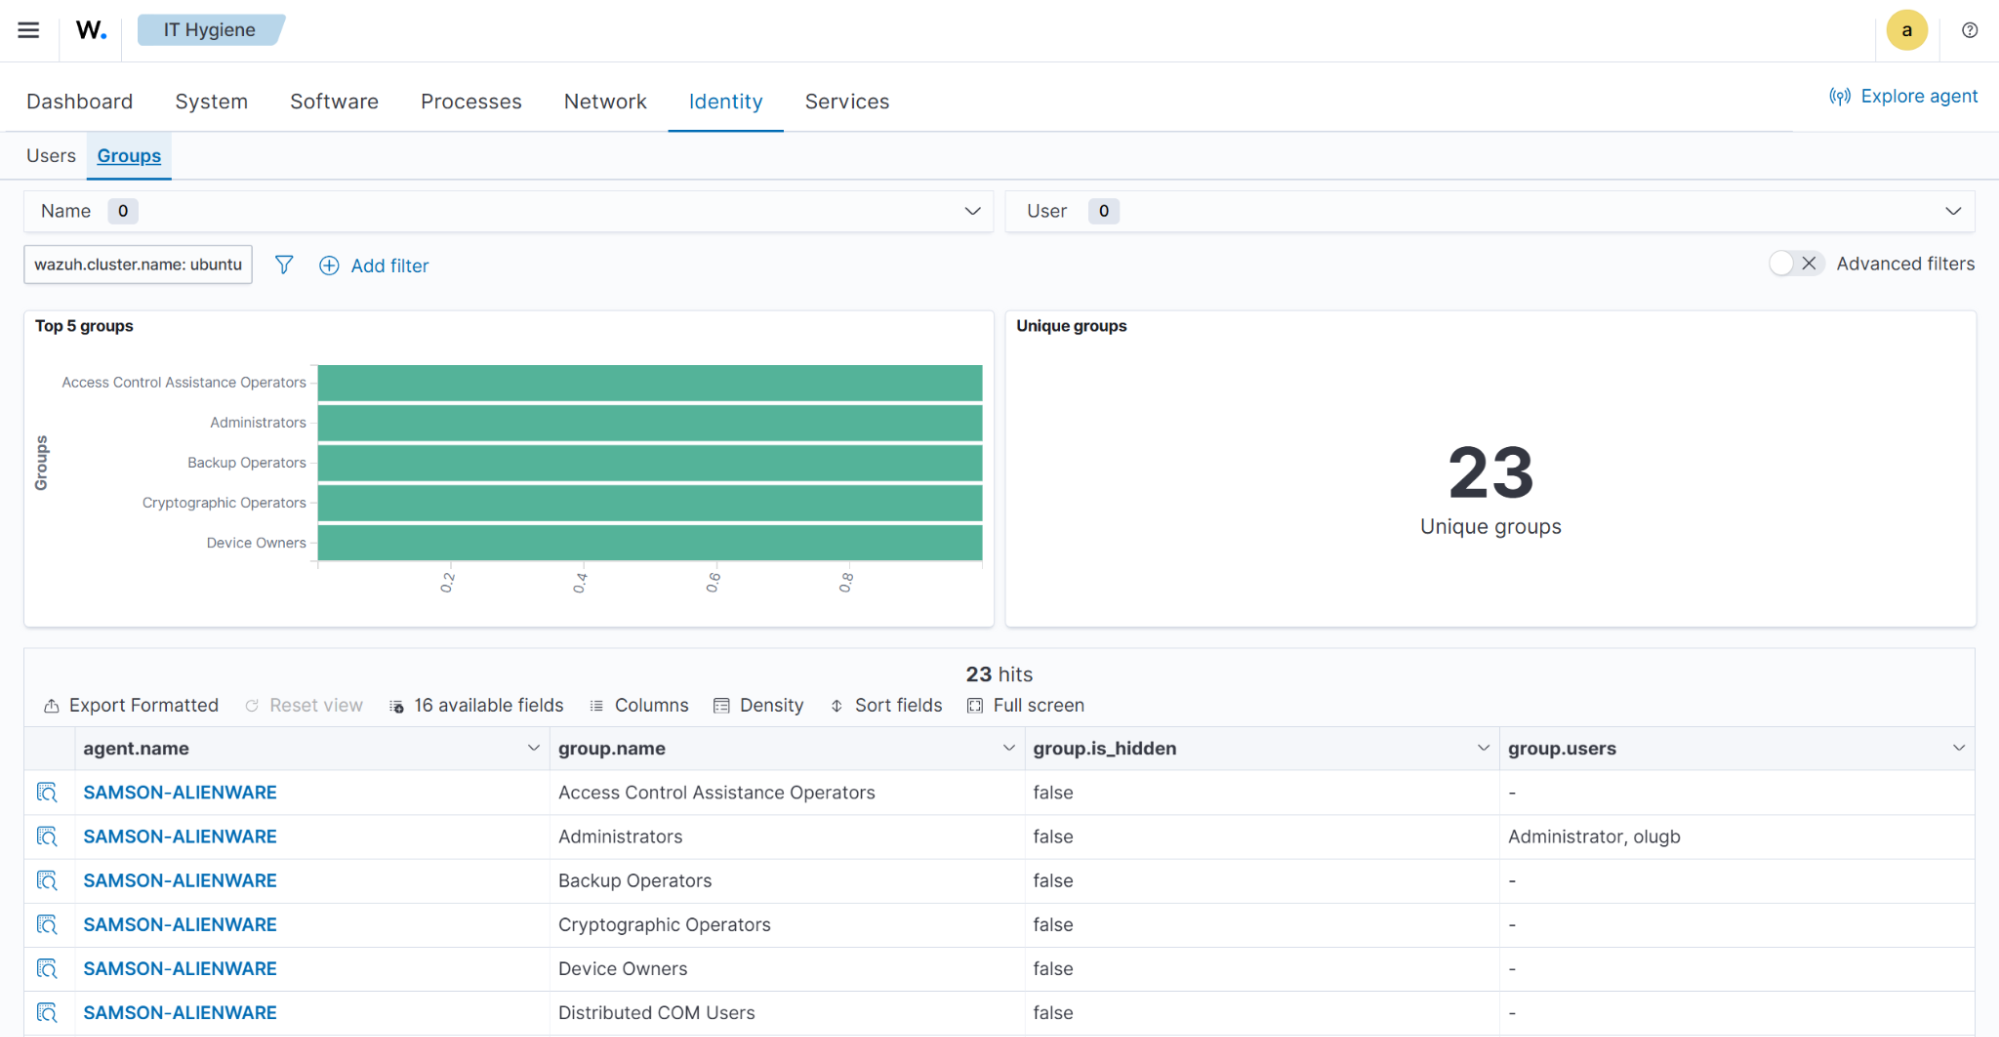
The wazuh-states-inventory-groups-* indices
The wazuh-states-inventory-groups-* indices track the system and domain groups present on monitored endpoints. They contain data on group names, identifiers, and associated privileges.
This allows administrators to review access control structures, detect privilege escalations or unauthorized group memberships, and maintain proper role-based access control (RBAC) within the IT infrastructure.
To find information relating to user groups on a monitored endpoint, navigate to IT Hygiene > Identity > Groups.
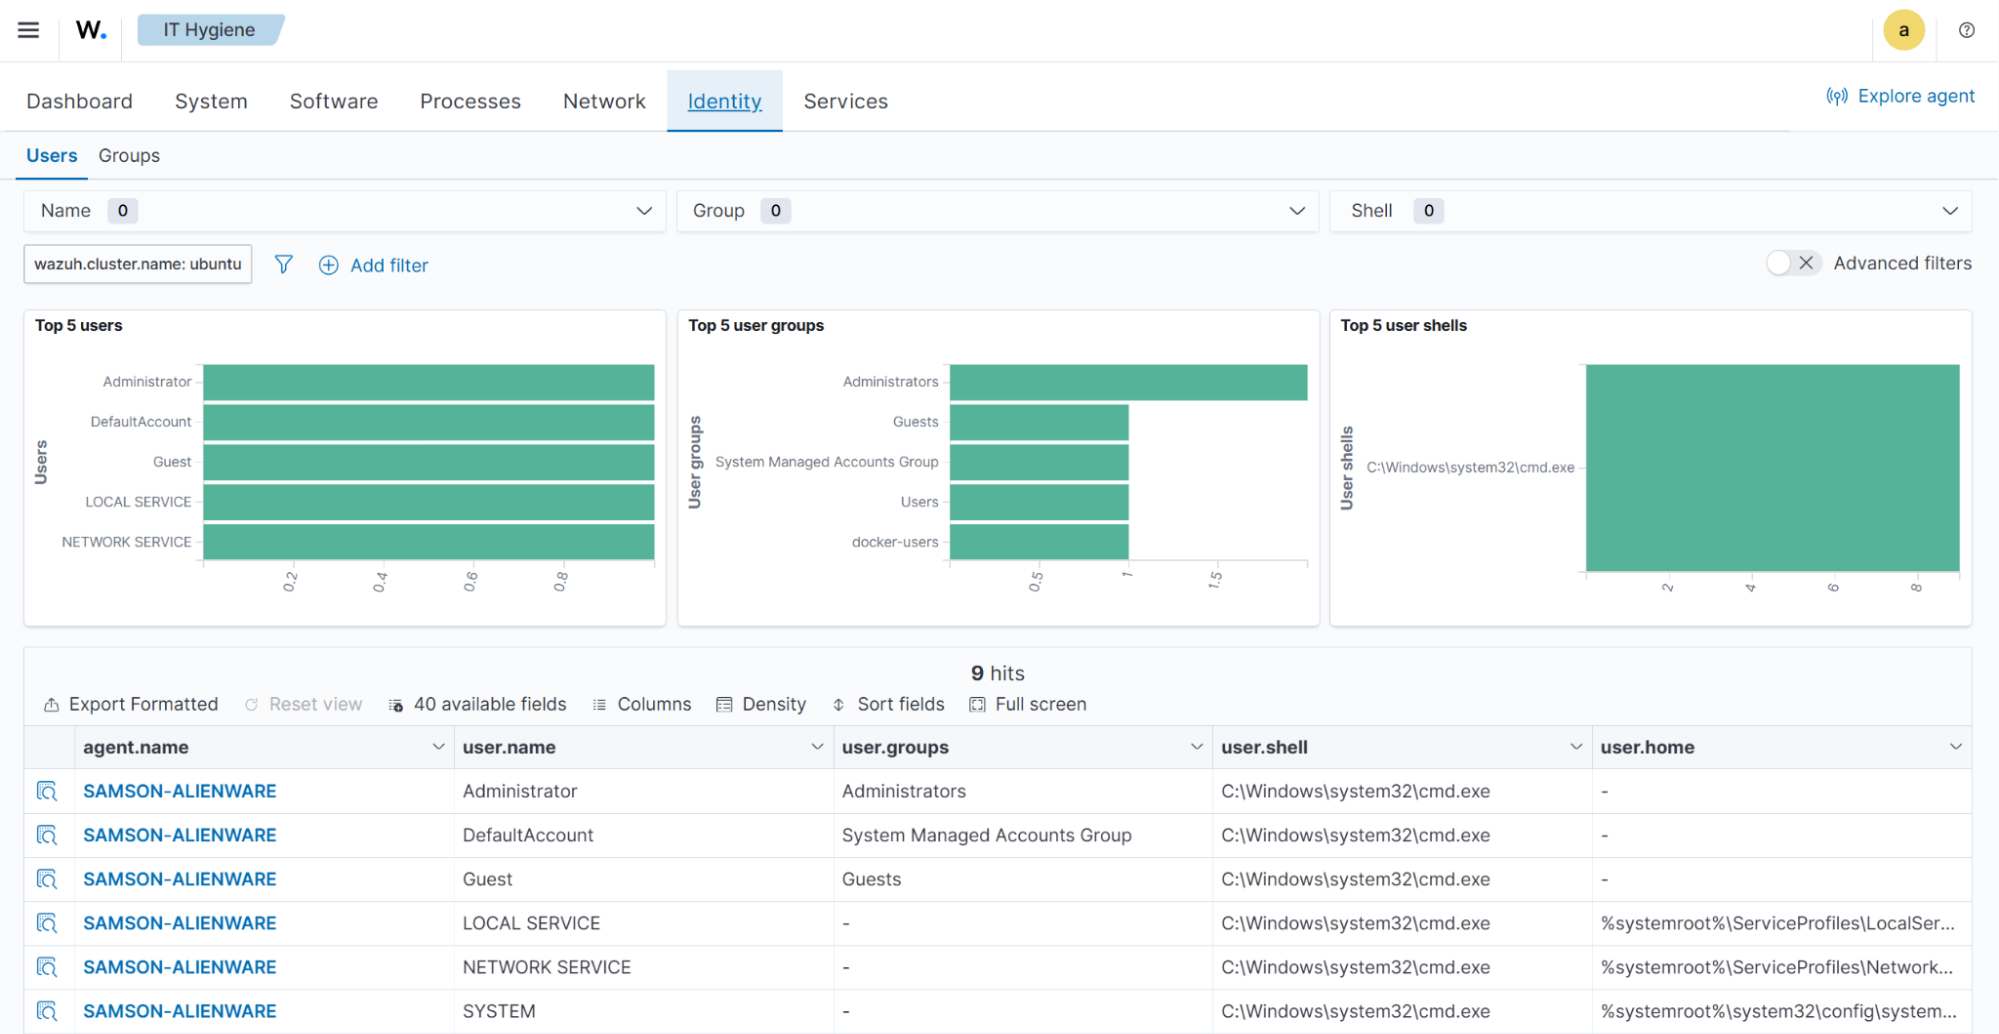
The wazuh-states-inventory-users-* indices
The wazuh-states-inventory-users-* indices catalogs user accounts found on monitored endpoints, including usernames, group assignment, privilege levels, and login status.
It supports identity and access management by helping detect unauthorized user creation, track administrative accounts, and correlate user activity with security alerts. This visibility enhances auditing, insider threat detection, and compliance reporting.
To find information relating to user accounts on a monitored endpoint, navigate to IT Hygiene > Identity > Users.