Journald log collection
Journald is a system service that offers a modern approach to system logging. It provides powerful tools for managing and analyzing log data on Linux endpoints. Journald replaces traditional syslog daemons and provides a centralized and structured approach to logging.
Wazuh Logcollector capability collects logs from sources such as kernel messages, applications, and system services using the journald service. This enables the Wazuh agentd daemon to forward the collected logs to the Wazuh server.
In this document, we cover the basic configuration needed to forward logs from the journald service to the Wazuh server. Additionally, we show real world use cases that demonstrate the value of journald log collection.
How this works
Wazuh agent utilizes the Logcollector module to gather log messages using journald from Linux endpoints. journald collects log data from various sources and stores them in a binary format within the /var/log/journal/ directory, enabling the inclusion of structured metadata, which improves log search capabilities and reliability. Users interact with logs in journald using tools like journalctl, which extract fields from the stored logs based on various criteria such as service, priority, or time. Learn more about the systemd journal fields.
Wazuh collects log data from journald service in syslog format for better compatibility with the Wazuh ruleset, using the following fields:
_HOSTNAMESYSLOG_IDENTIFIERMESSAGESYSLOG_PIDor_PID(if available)
Wazuh uses the above fields to construct log data:
$TIMESTAMP $_HOSTNAME $SYSLOG_IDENTIFIER[$PID]: $MESSAGE
Once the Wazuh agent collects logs using journald service, they are forwarded to the Wazuh server for further processing. The Wazuh analysis engine integrated within the Wazuh server then performs real time analysis of the collected journald log messages, extracting relevant information from the logs and mapping them to appropriate fields using decoders. After decoding, it compares the log messages against its rules, triggering alerts when specific criteria are met, and records all alerts in both /var/ossec/logs/alerts/alerts.log and /var/ossec/logs/alerts/alerts.json files on the Wazuh server.
The image below illustrates the flow of log data collection from the journald service and analysis in Wazuh.

Configuration
The Wazuh agent allows you to configure the local ossec.conf configuration file on the monitored endpoint to collect journald log messages. This configuration is enabled by default in the /var/ossec/etc/ossec.conf file, as shown below:
<localfile>
  <location>journald</location>
  <log_format>journald</log_format>
</localfile>
The above configuration in the Wazuh agent forwards all logs stored in the journald service to the Wazuh server.
However, we can apply additional journald filters to selectively collect logs, reducing noise from unwanted service logs. By applying these filters, users simplify log management and focus on the most relevant log entries.
A filter with the
<_SYSTEMD_UNIT>field is useful for collecting logs of a specific systemd service.A filter with the
<PRIORITY>field is useful for collecting logs that have a priority level.
In the next section, we show two use cases to illustrate how the filters are configured to enhance the journald log collection capabilities.
It is worth noting that Wazuh only collects future log events from the journald service after a successful configuration. However, you can disable the only-future-events option if you also need to collect historical events generated since the Wazuh log collector service was stopped.
Use cases
Using the journald service to forward SSH and CRON logs to Wazuh
In this section, we configure the Wazuh Logcollector module on a monitored Ubuntu endpoint to capture and forward SSH and CRON log messages from the journald service to the Wazuh server. Then we utilize custom decoders and rules on the Wazuh server to process the received log messages and visualize the alerts.
Ubuntu
Below, we show Wazuh agent configurations for collecting SSH and CRON logs from the journald service on an Ubuntu endpoint.
Perform the steps below on your monitored Ubuntu endpoint.
Modify and add the following
<localfile>configuration block to the<ossec_conf>section in the/var/ossec/etc/ossec.conffile:<!-- For monitoring journald service --> <localfile> <location>journald</location> <log_format>journald</log_format> <filter field="_SYSTEMD_UNIT">^ssh.service$</filter> </localfile> <localfile> <location>journald</location> <log_format>journald</log_format> <filter field="_SYSTEMD_UNIT">^cron.service$</filter> <filter field="PRIORITY">[0-6]</filter> </localfile>
Where:
The
<filter field>is set to_SYSTEM_UNITwith the valuessh.serviceandcron.serviceto collect SSH and CRON logs.The
<filter field>is set toPRIORITYto define a range of priority levels.The priority level is set to
[0-6]to forward logs that have a priority level within this range. Logs with a priority level higher than 6 will be ignored.
Note
When a log collected from the journald service matches two or more filters in a
<localfile>block, the Wazuh agent sends the log only once. This avoids sending duplicate logs.Restart the Wazuh agent to apply the changes:
# systemctl restart wazuh-agent
Wazuh server
Wazuh decodes SSH logs and generates alerts from them by default. We create custom decoders and rules for the CRON logs to extract relevant data from them and generate security alerts.
Perform the steps below on your Wazuh server.
Add the following custom decoders to the local decoder
/var/ossec/etc/decoders/local_decoder.xmlfile:<decoder name="cron-service"> <program_name>cron|CRON</program_name> </decoder> <decoder name="cron-service1"> <parent>cron-service</parent> <regex type="pcre2">\((\w+)\) CMD \((.*?)\)$</regex> <order>service_user, command</order> </decoder> <decoder name="cron-service1"> <parent>cron-service</parent> <regex type="pcre2">\((\w+)\) INFO \(Skipping @(\w+) jobs .*?\)$</regex> <order>service, message</order> </decoder>
Add the following custom rules to the local rule
/var/ossec/etc/rules/local_rules.xmlfile:<!-- Rules for journald logs for CRON services--> <group name="cron-service,"> <!-- rule for groupped logs --> <rule id="111800" level="0"> <decoded_as>cron-service</decoded_as> <description>Journald logs for CRON.</description> </rule> <!-- rules to detect when the cron.service executes a command--> <rule id="111801" level="8"> <if_sid>111800</if_sid> <match>CMD</match> <description>CRON: The $(service_user) user executed ($(command)) on $(hostname).</description> </rule> <!-- rules to detect when the cron.service performs a reboot--> <rule id="111802" level="12"> <if_sid>111800</if_sid> <match>not system startup</match> <description>CRON: The cron.service on $(hostname) just performed a $(message).</description> </rule> </group>
Where:
Rule ID
111800groups all CRON logs from the journald service.Rule ID
111801triggers when the CRON service executes a command.Rule ID
111802triggers when the CRON service reboots after a configuration change.
Restart the Wazuh manager for the changes to take effect:
# systemctl restart wazuh-manager
Testing the configuration
In this section, we proceed to establish an SSH connection to the monitored Ubuntu endpoint and configure a cron job to verify our configuration.
SSH
Run the following command from any endpoint to establish an SSH connection to the monitored Ubuntu endpoint:
# ssh <USER_NAME>@<WAZUH_AGENT_IP_ADDRESS>
Where:
<USER_NAME>is the monitored Ubuntu endpoint user.<WAZUH_AGENT_IP_ADDRESS>is the IP address of the monitored Ubuntu endpoint.
CRON
Create a Python file
hello.pyin the root (/) directory:# cd / # touch hello.py
Add the following contents to the
hello.pyfile:#!/usr/bin/env python3 def main(): print("Hello, World!") if __name__ == "__main__": main()
Run the following command to open the CRON service configuration file:
# crontab -e
Add the following line to the CRON service configuration file to run the
hello.pyevery minute:* * * * * /hello.py
Visualizing the alerts
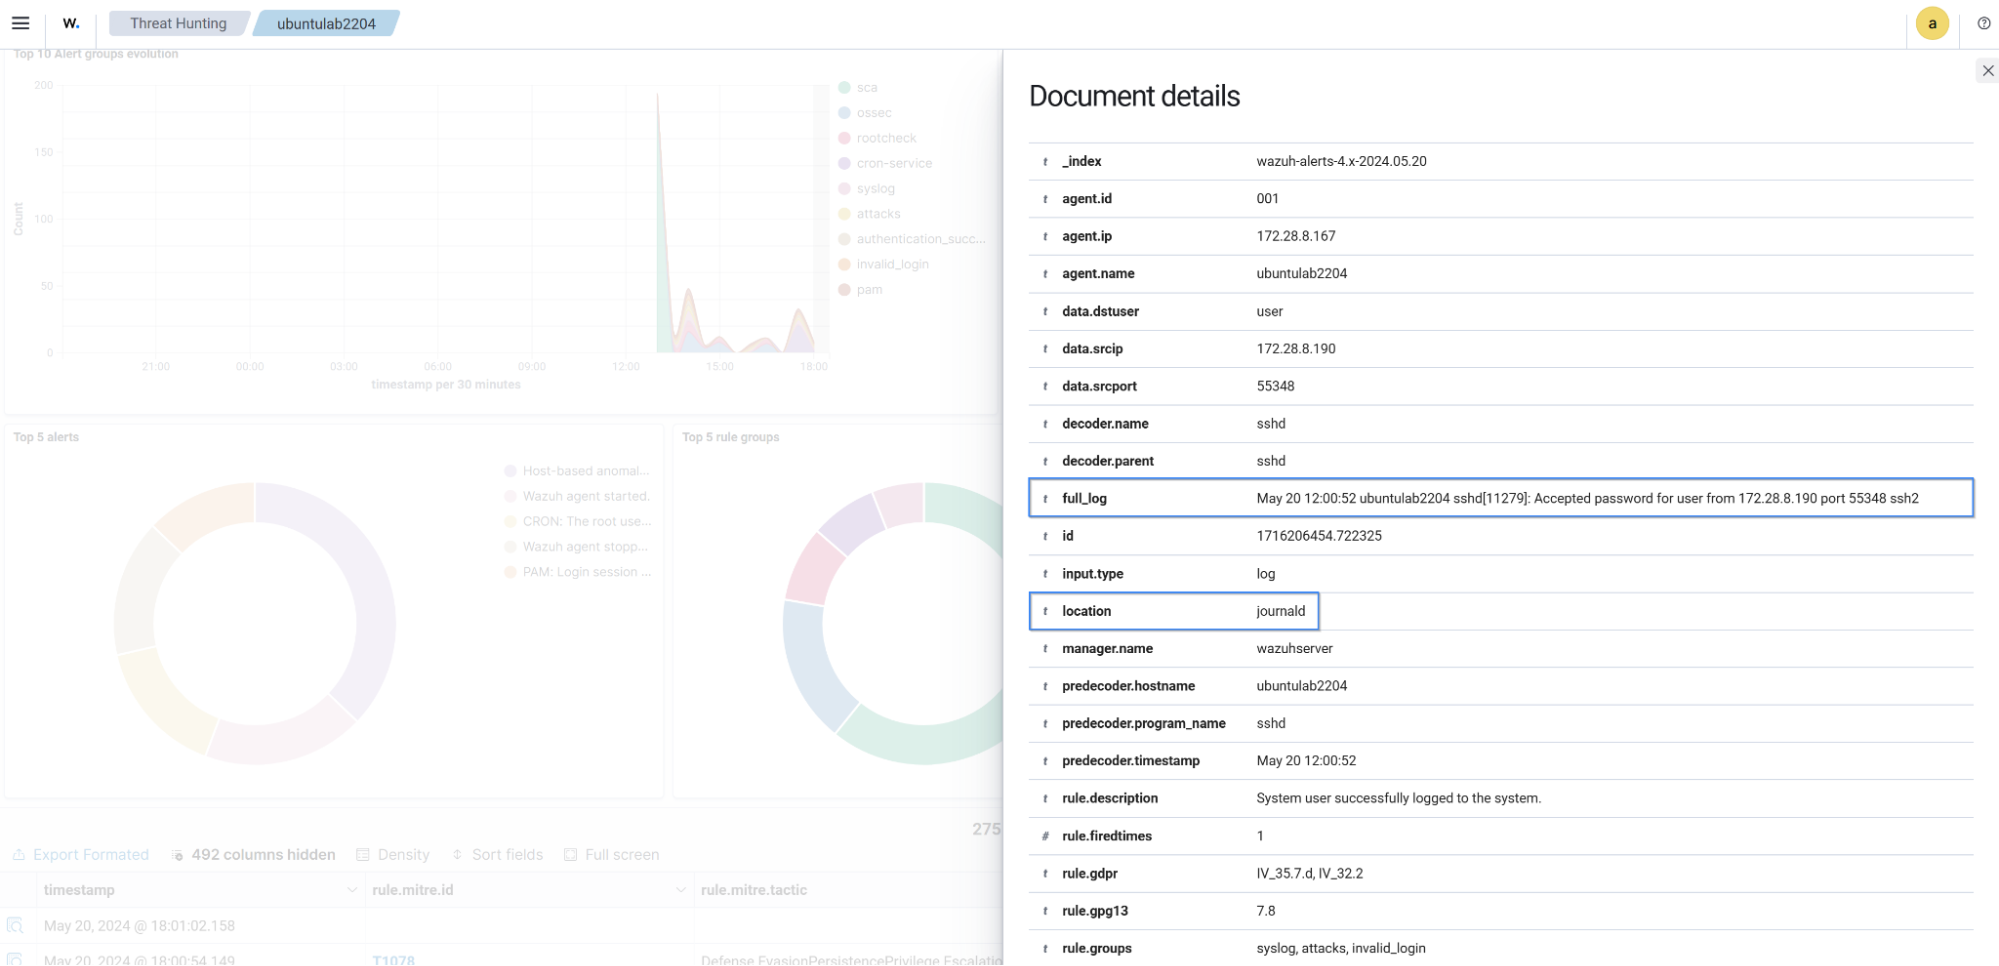
The image below displays a security alert generated on the Wazuh dashboard when an SSH connection is established to the Ubuntu endpoint.

{
  "timestamp": "2024-05-20T12:00:54.149+0000",
  "rule": {
    "level": 12,
    "description": "System user successfully logged to the system.",
    "id": "40101",
    "mitre": {
      "id": [
        "T1078"
      ],
      "tactic": [
        "Defense Evasion",
        "Persistence",
        "Privilege Escalation",
        "Initial Access"
      ],
      "technique": [
        "Valid Accounts"
      ]
    },
    "firedtimes": 1,
    "mail": true,
    "groups": [
      "syslog",
      "attacks",
      "invalid_login"
    ],
    "pci_dss": [
      "10.2.4",
      "10.2.5"
    ],
    "gpg13": [
      "7.8"
    ],
    "gdpr": [
      "IV_35.7.d",
      "IV_32.2"
    ],
    "hipaa": [
      "164.312.b"
    ],
    "nist_800_53": [
      "AU.14",
      "AC.7"
    ],
    "tsc": [
      "CC6.1",
      "CC6.8",
      "CC7.2",
      "CC7.3"
    ]
  },
  "agent": {
    "id": "001",
    "name": "ubuntulab2204",
    "ip": "172.28.8.167"
  },
  "manager": {
    "name": "wazuhserver"
  },
  "id": "1716206454.722325",
  "full_log": "May 20 12:00:52ubuntulab2204 sshd[11279]: Accepted password for user from 172.28.8.190 port 55348 ssh2",
  "predecoder": {
    "program_name": "sshd",
    "timestamp": "May 20 12:00:52",
    "hostname": "ubuntulab2204"
  },
  "decoder": {
    "parent": "sshd",
    "name": "sshd"
  },
  "data": {
    "srcip": "172.28.8.190",
    "srcport": "55348",
    "dstuser": "user"
  },
  "location": "journald"
}
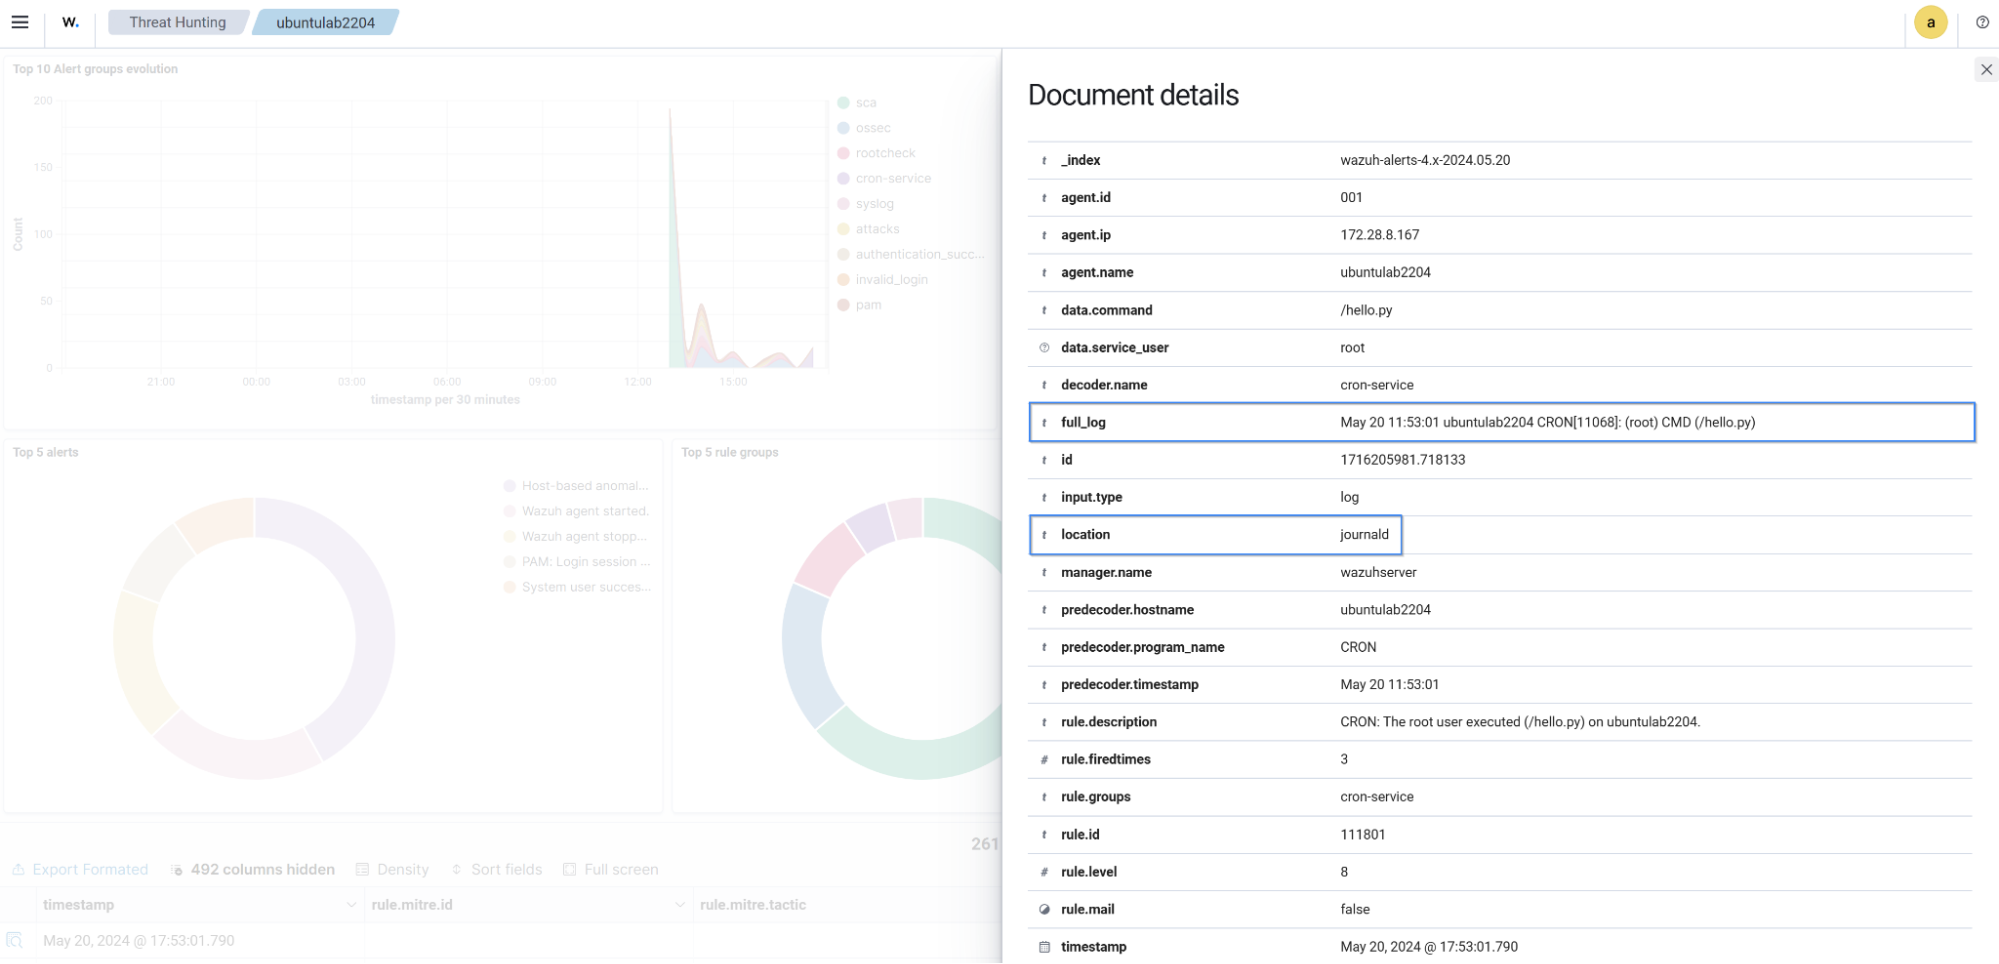
The image below displays a security alert generated on the Wazuh dashboard when a CRON service executed hello.py on the Ubuntu endpoint.

{
  "timestamp": "2024-05-20T12:01:02.158+0000",
  "rule": {
    "level": 8,
    "description": "CRON: The root user executed (/hello.py) on ubuntulab2204.",
    "id": "111801",
    "firedtimes": 2,
    "mail": false,
    "groups": [
      "cron-service"
    ]
  },
  "agent": {
    "id": "001",
    "name": "ubuntulab2204",
    "ip": "172.28.8.167"
  },
  "manager": {
    "name": "wazuhserver"
  },
  "id": "1716206462.723273",
  "full_log": "May 20 12:01:01 ubuntulab2204 CRON[11354]: (root) CMD (/hello.py)",
  "predecoder": {
    "program_name": "CRON",
    "timestamp": "May 20 12:01:01",
    "hostname": "ubuntulab2204"
  },
  "decoder": {
    "name": "cron-service"
  },
  "data": {
    "service_user": "root",
    "command": "/hello.py"
  },
  "location": "journald"
}
Using the journald service to forward Docker logs to Wazuh
In this section, we configure the journald service on a monitored Ubuntu endpoint to capture and forward Docker activity log messages to the Wazuh server. Then we utilize custom decoders and rules on the Wazuh server to process the received log messages and visualize the alerts.
Ubuntu
Perform the steps below on your monitored Ubuntu endpoint to forward Docker log messages to the Wazuh server.
Modify and add the following line to the Wazuh agent configuration file
/var/ossec/etc/ossec.conf:<localfile> <log_format>journald</log_format> <location>journald</location> <filter field="_SYSTEMD_UNIT">^docker.service$</filter> </localfile>
Restart the Wazuh agent service to apply the changes:
# systemctl restart wazuh-agent
Wazuh server
We create custom decoders and rules for the Docker logs to extract relevant data from them and generate security alerts.
Perform the steps below on your Wazuh server.
Add the following custom decoders to the local decoder
/var/ossec/etc/decoders/local_decoder.xmlfile:<decoder name="docker-service"> <program_name type="pcre2">^\w{12}$</program_name> <prematch type="pcre2">\d{4}\/\d{2}\/\d{2} \d{2}:\d{2}:\d{2} \[\w+]</prematch> </decoder> <decoder name="docker-service1"> <parent>docker-service</parent> <regex type="pcre2">(\d{4}\/\d{2}\/\d{2} \d{2}:\d{2}:\d{2}) \[(\w+)] .*: (.*)$</regex> <order>log_timestamp, severity, message</order> </decoder>
Add the following custom rules to the local rule
/var/ossec/etc/rules/local_rules.xmlfile:<!-- Rules for journald logs for docker services--> <group name="docker-service,"> <!-- rule for grouped logs --> <rule id="111700" level="0"> <decoded_as>docker-service</decoded_as> <description>Journald logs for Docker.</description> </rule> <!-- rule to detect the launching of docker containers --> <rule id="111701" level="8"> <if_sid>111700</if_sid> <match>start worker processes</match> <description>Docker with container ID $(program_name) just launched.</description> </rule> <!-- rule to detect when a container is stopped --> <rule id="111702" level="12"> <if_sid>111700</if_sid> <match>gracefully shutting down</match> <description>Docker with container ID $(program_name) just shut down.</description> </rule> </group>
Where:
Rule ID
111700groups all Docker logs from the journald service.Rule ID
111701triggers when the Docker service starts a container.Rule ID
111702triggers when the Docker service stops a container.
Restart the Wazuh manager for the changes to take effect:
# systemctl restart wazuh-manager
Testing the configuration
In this section, we proceed to install Docker on the monitored Ubuntu endpoint and execute various Docker commands to verify our configuration.
Run the following command to install Docker packages:
# curl -sSL https://get.docker.com/ | sh
Start the Docker service:
# systemctl start docker
Pull a Docker image. In this case, we pulled the latest NGINX image:
# docker pull nginx:latest
Run the docker image with the following command:
# docker run --log-driver=journald --name nginx_webserver -d -p 8080:80 nginx
Where:
--log-driveris set tojournaldto forward Docker logs to the journald service.--namedefines the Docker container name asnginx_werbserver.
Verify if the journald is configured for the NGINX Docker image:
# docker inspect -f '{{.HostConfig.LogConfig.Type}}' nginx_webserver
journald
Stop the Docker container:
# docker stop nginx_webserver
Visualizing the alerts
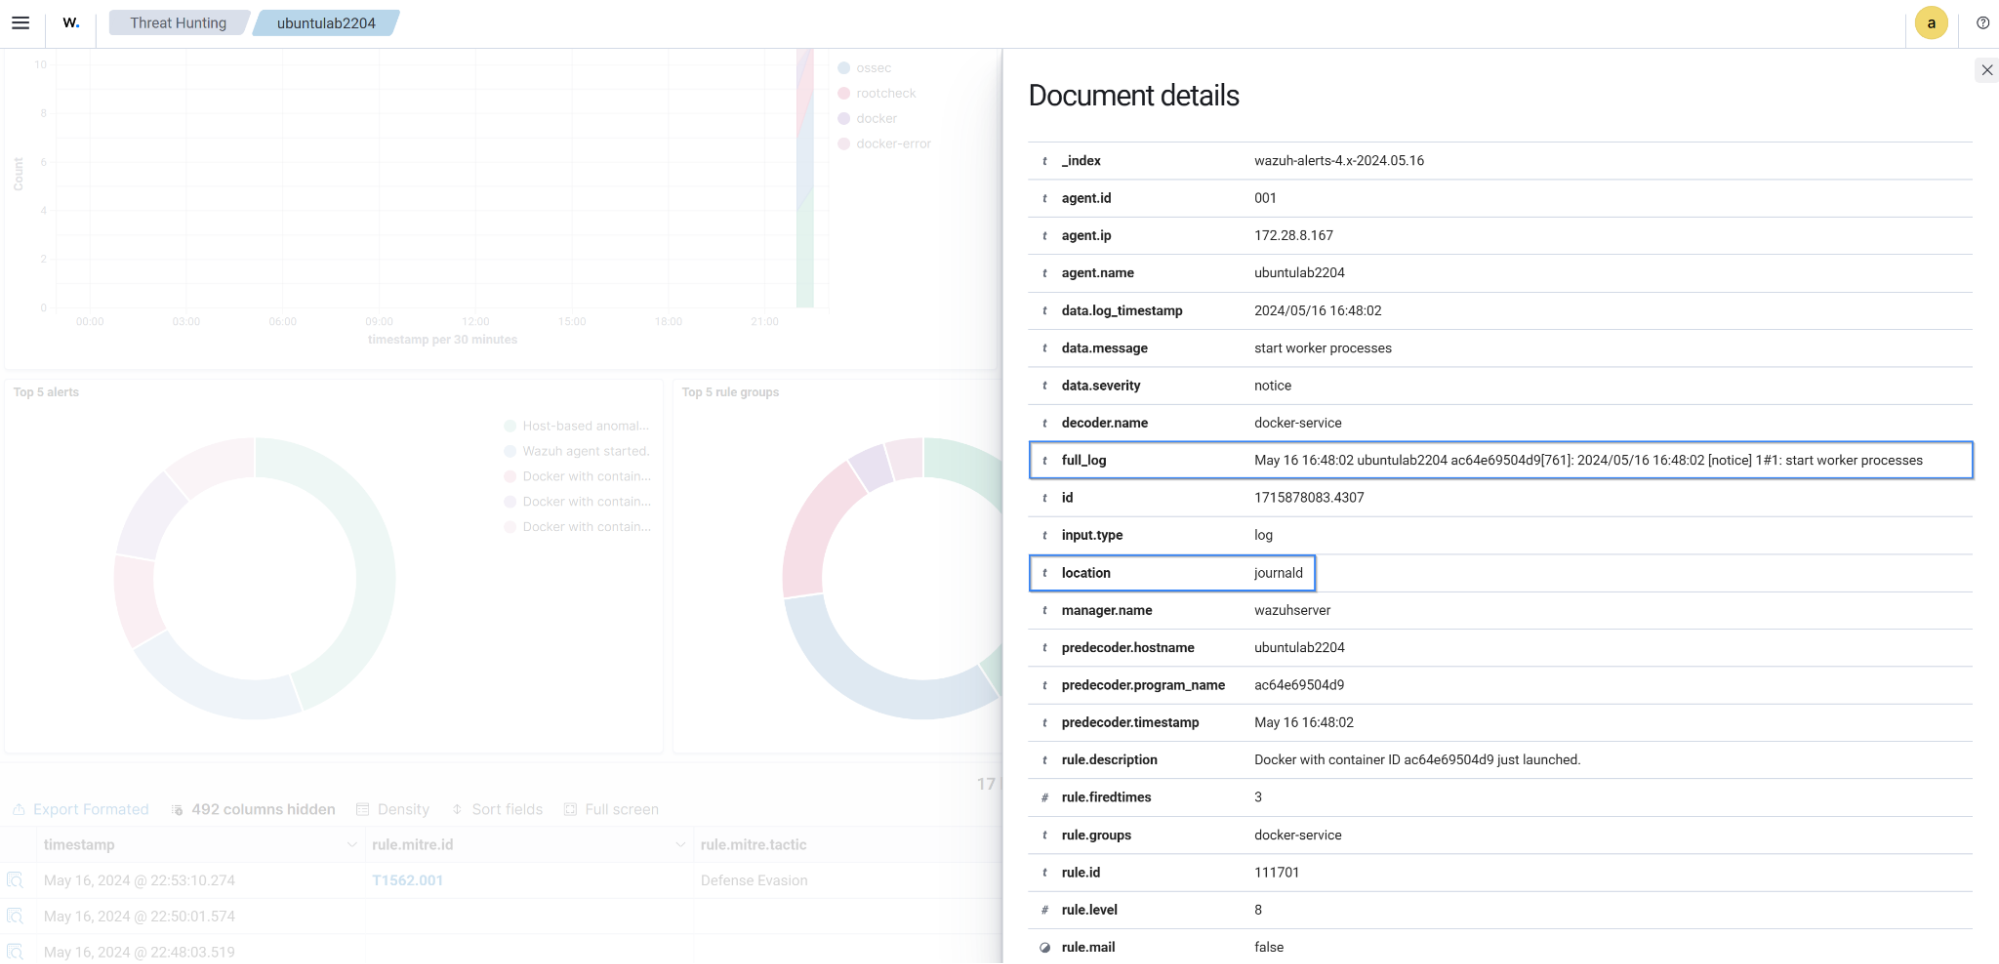
The image below displays a security alert generated on the Wazuh dashboard when Docker started the container with ID ac64e69504d9.

{
  "timestamp": "2024-05-16T16:48:03.519+0000",
  "rule": {
    "level": 8,
    "description": "Docker with container ID ac64e69504d9 just launched.",
    "id": "111701",
    "firedtimes": 3,
    "mail": false,
    "groups": [
      "docker-service"
    ]
  },
  "agent": {
    "id": "001",
    "name": "ubuntulab2204",
    "ip": "172.28.8.167"
  },
  "manager": {
    "name": "wazuhserver"
  },
  "id": "1715878083.4307",
  "full_log": "May 16 16:48:02 ubuntulab2204 ac64e69504d9[761]: 2024/05/16 16:48:02 [notice] 1#1: start worker processes",
  "predecoder": {
    "program_name": "ac64e69504d9",
    "timestamp": "May 16 16:48:02",
    "hostname": "ubuntulab2204"
  },
  "decoder": {
    "name": "docker-service"
  },
  "data": {
    "log_timestamp": "2024/05/16 16:48:02",
    "severity": "notice",
    "message": "start worker processes"
  },
  "location": "journald"
}
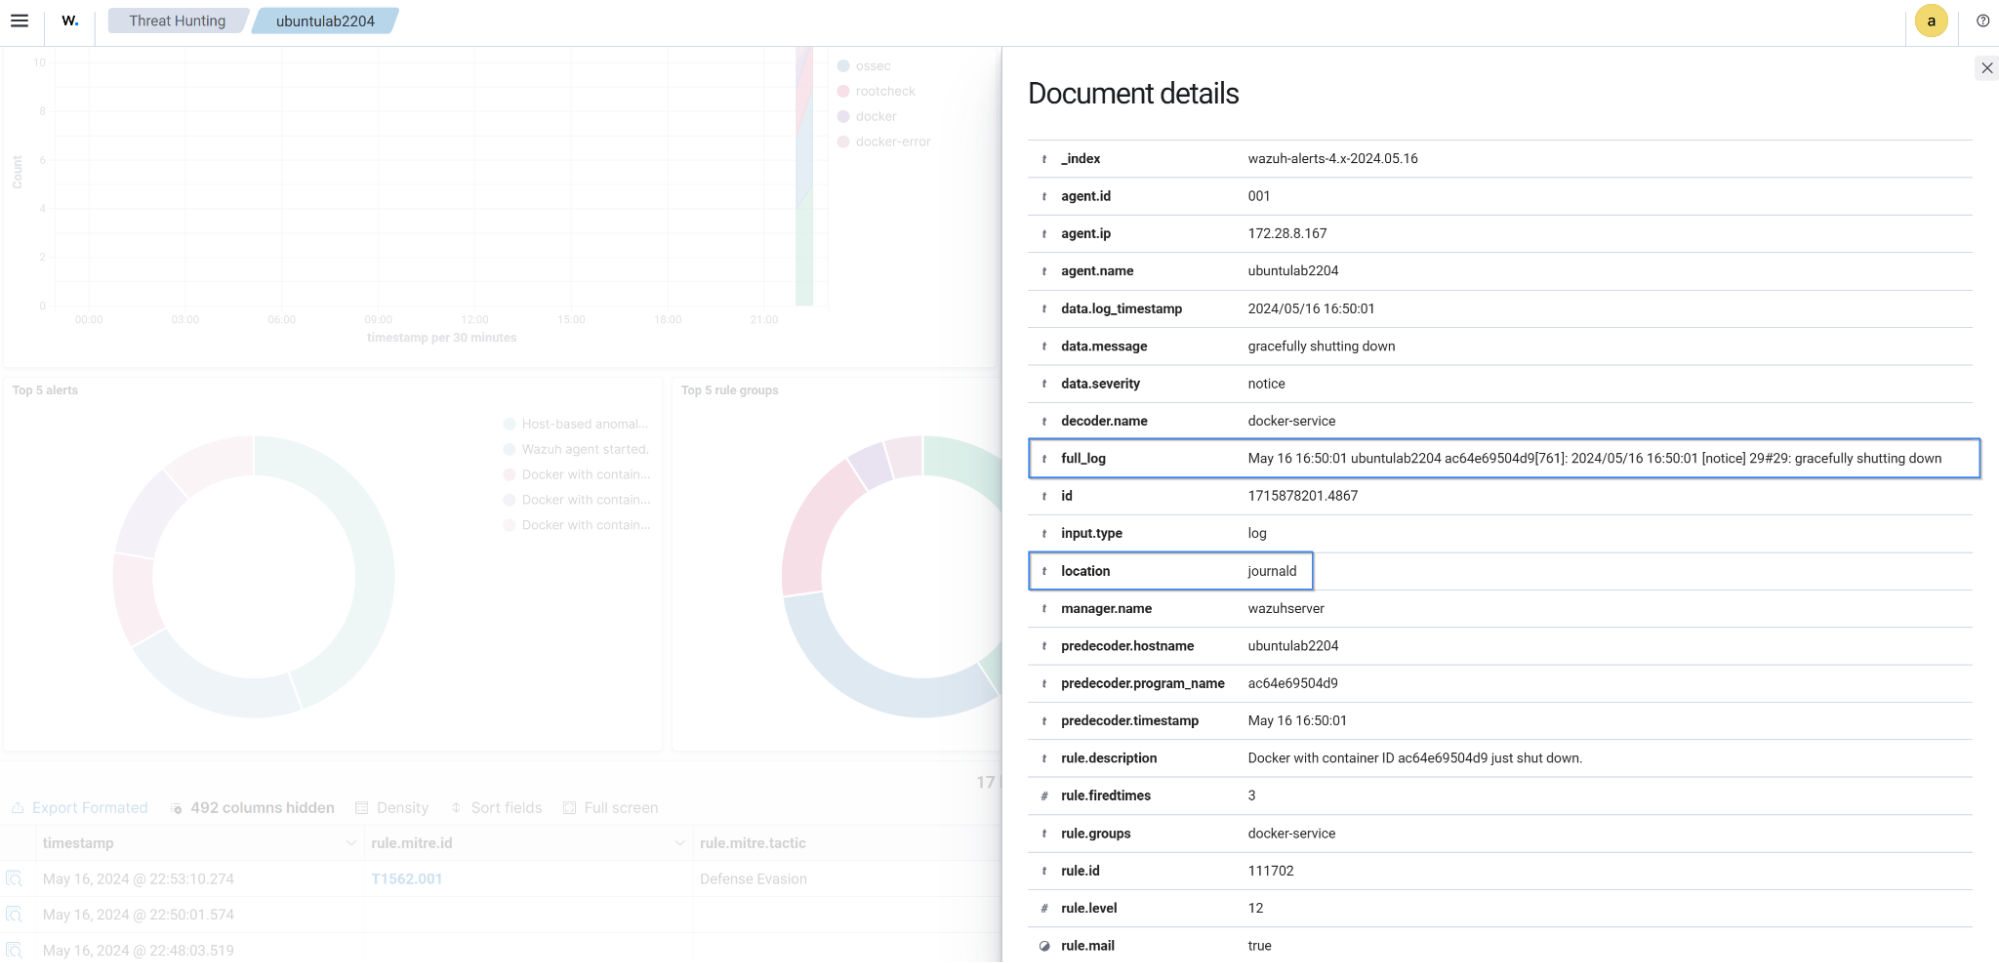
The image below displays a security alert generated on the Wazuh dashboard when the Docker service stops a container with container ID ac64e69504d9.

{
  "timestamp": "2024-05-16T16:50:01.574+0000",
  "rule": {
    "level": 12,
    "description": "Docker with container ID ac64e69504d9 just shut down.",
    "id": "111702",
    "firedtimes": 3,
    "mail": true,
    "groups": [
      "docker-service"
    ]
  },
  "agent": {
    "id": "001",
    "name": "ubuntulab2204",
    "ip": "172.28.8.167"
  },
  "manager": {
    "name": "wazuhserver"
  },
  "id": "1715878201.4867",
  "full_log": "May 16 16:50:01 ubuntulab2204 ac64e69504d9[761]: 2024/05/16 16:50:01 [notice] 29#29: gracefully shutting down",
  "predecoder": {
    "program_name": "ac64e69504d9",
    "timestamp": "May 16 16:50:01",
    "hostname": "ubuntulab2204"
  },
  "decoder": {
    "name": "docker-service"
  },
  "data": {
    "log_timestamp": "2024/05/16 16:50:01",
    "severity": "notice",
    "message": "gracefully shutting down"
  },
  "location": "journald"
}